Public market preparation covering SPX, SPY, Nasdaq futures, options, macro catalysts, risk and the levels shaping the next session.
Source · context · decisionHPT FIELD GUIDE
LATEST MARKET VIDEO · October 14, 2026
A long candle body needs a declared comparison #WMT #CandlestickBodies #Shorts
Calling a candle long needs a comparison. A twenty five cent body can be large beside recent candles and ordinary in another setting. Use a declared reference window instead of judging only its screen height. This historical Walmart IEX replay uses completed five minute bars from October eighth, twenty twenty six. The highlighted candle opens at one oh…
Rising three methods needs the fifth candle close #CAT #RisingThreeMethods #Shorts
Rising three methods is a five candle continuation formation, not just three small candles after a rally. Its definition includes an initial rising body, three smaller bodies contained within the first high to low range, and a fifth candle closing at a new high. Do not skip the final condition. This historical Caterpillar IEX replay uses completed five…
An abandoned baby needs gaps beyond the shadows #UNH #AbandonedBaby #Shorts
An abandoned baby needs more than a doji whose body sits above the previous close. In this definition, the middle doji must be isolated from both neighboring candles by gaps between their full ranges, including shadows. Body separation alone is insufficient. This historical UnitedHealth IEX replay uses completed five minute bars from October eighth,…
A spinning top can hide a wide price range #CRM #SpinningTop #Shorts
A spinning top can finish nearly unchanged while covering a much wider price range. The real body measures open to close. The shadows measure the extremes beyond that body. A small net change does not mean a quiet interval. This historical Salesforce IEX replay uses completed five minute bars from October eighth, twenty twenty six. The open is two twenty…
A hanging man candidate can still be a green candle #UPS #HangingMan #Shorts
A green hanging man candidate is not a contradiction. Green means the close is above the open. It does not promise a bullish future. A small body with a long lower shadow after an advance can instead raise a reversal question. This historical UPS IEX replay uses completed five minute bars from October eighth, twenty twenty six. The highlighted candle…
Dark cloud cover tests the body midpoint, not the wick range #QCOM #DarkCloudCover #TradingEducation
For dark cloud cover, the midpoint test refers to the previous real body, not its full high low range. The real body runs between the open and close. Wicks are separate. This historical Qualcomm IEX example uses completed five minute candles from October eighth, twenty twenty six. The first rising candle opens at one seventy four point six three and…
Three green candles do not automatically make three soldiers #CAT #CandlestickPatterns #Shorts
Three green candles are not automatically three white soldiers. The conventional formation also checks long bodies, later opens inside the previous body, closes near the highs and trend context. Counting colors alone skips those tests. This historical Caterpillar IEX replay uses completed five minute candles from October eighth, twenty twenty six. Three…
A marubozu does not prove a smooth price path #XOM #Marubozu #CandlestickPatterns #TradingEducation
A marubozu does not prove that price moves smoothly in one direction. A bullish marubozu opens at its low and closes at its high, leaving no shadows. This historical Exxon Mobil IEX example uses a completed five minute bar from October eighth, twenty twenty six. Open and low are one sixty eight point eight five five. Close and high are one sixty eight…
Harami containment tests bodies, not the whole range #UNH #CandlestickPatterns #Harami #Shorts
A harami body can fit inside the previous body without its whole range fitting. This UnitedHealth IEX replay uses completed five minute bars from October eighth, twenty twenty six. We examine the two candle shape, not a guaranteed reversal. The first candle rises from three seventy one point four one to three seventy two point zero zero five. The next…
Doji recognition needs a declared tolerance #MSFT #CandlestickPatterns #Doji #TradingEducation
A doji screen needs a definition of nearly equal, not just a candle name. This historical Microsoft IEX replay uses completed five minute bars from October eighth, twenty twenty six. The highlighted open is five thirty point seven eight five and the close is five thirty point seven nine. The body difference is half a cent. The high is five thirty one…
A bond coupon is not the issuer’s full interest expense #BondAccounting #Bonds #InterestExpense
A bond coupon payment can be smaller than the issuer's interest expense. Consider a hypothetical annual payment bond with one thousand dollars of face value and a five percent coupon. It was issued at a discount. Assume its beginning amortized cost is nine hundred dollars and its original annual effective interest rate is six percent. Cash interest is five percent of face value, or fifty dollars. Effective interest expense is six percent of the nine hundred dollar beginning carrying amount, or fifty four dollars. The four dollar difference amortizes part of the discount. After paying the coupon, carrying amount becomes nine hundred four dollars. This is the issuer's simplified effective interest accounting, with no fees, impairment or other adjustments. The original effective rate is not replaced each period by a new market yield. Carrying amount is not today's trading quote. Read the accounting basis before equating coupon cash with total interest expense.
Hypothetical worked example; stated assumptions apply. Educational content, not personalized investment advice.
QQQ Bulls Got Bailed Out… But Will CPI Kill the Rally?
QQQ bulls escaped the lows—but can the recovery survive CPI? We connect the rebound to oil, breadth, banks and the economic forces underneath. After the QQQ chart analysis, watch the original live 742-call walkthrough: point of control, entry, in-position alert, position management and exit. You can hear the keyboard as the alert is typed. The point is the p
The same four returns can have different serial dependence #Autocorrelation #Statistics #TimeSeries
Observation order can matter even when the average and histogram stay unchanged. Consider four hypothetical equally spaced returns: plus one, minus one, plus one, minus one percent. Their mean is zero. We will use a declared lag one sample autocorrelation with the full sample squared deviation denominator. The three adjacent deviation products are each negat
Bond cash-flow timing uses value weights, not equal dates #MacaulayDuration #Bonds #PresentValue
Macaulay duration is not simply the average of the payment dates. Consider a hypothetical two year bond with one hundred dollars of principal, ten dollar annual coupons, and a ten percent annual discount yield. Assume valuation immediately after a coupon, scheduled payments, no default and no embedded option. At year one, the ten dollar coupon has present value about nine dollars nine cents. At year two, the coupon plus principal is one hundred ten dollars, with present value about ninety dollars ninety one cents. Total present value is one hundred dollars. Weight each payment time by its share of that present value. Using unrounded inputs, one times the first value plus two times the second, divided by one hundred, gives approximately one point nine zero nine years. That is less than two year maturity, but greater than the equal date average of one point five years. Different duration measures answer different questions.
Hypothetical worked example; stated assumptions apply. Educational content, not personalized investment advice.
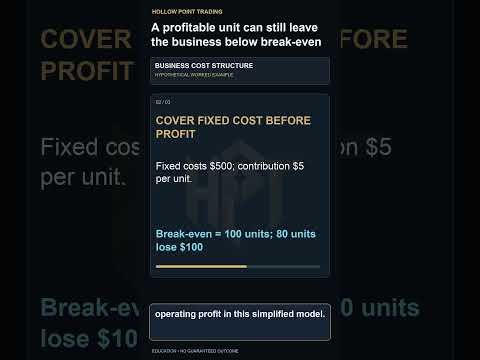
A profitable unit can still leave the business below break-even #ContributionMargin #BreakEven
Positive contribution from each sale does not guarantee an operating profit. Consider a hypothetical single product selling for ten dollars, with five dollars of variable cost per unit and five hundred dollars of fixed operating costs per period. Assume every unit produced is sold, and these costs stay constant within the relevant range. Each unit contribute
A deposit can grow your balance without improving your return #TimeWeightedReturn #CashFlows #Shorts
A larger ending balance does not by itself measure investment performance. Imagine a hypothetical account starting at one hundred dollars. It grows to one hundred ten before any cash flow, a ten percent return. Deposit another one hundred dollars immediately after that valuation. The account now holds two hundred ten dollars. In the next subperiod, it loses
NEE: money flow index is not the buyer share of volume #NEE #MoneyFlowIndex #TechnicalAnalysis
A Money Flow Index reading is not the percentage of shares bought by buyers. This historical NextEra Energy IEX replay uses fourteen completed five minute bars from October eighth, twenty twenty six, plus the preceding bar for comparison. Typical price is high plus low plus close, divided by three. Multiply each typical price by that interval's observed volume. Classify the product as positive when typical price rises, negative when it falls, and omit unchanged observations. The positive sum is approximately five point six five eight million. The negative sum is approximately four point eight eight four million. Using unrounded sums, divide the positive amount by their combined total, then multiply by one hundred. The result is approximately fifty three point six seven. This dimensionless oscillator does not count buyer initiated transactions or prove cash entered the stock. Every trade has both sides. Feed coverage and the lookback matter; this is not a forecast.
Historical observed IEX replay; not a live signal. Educational content, not personalized investment advice.
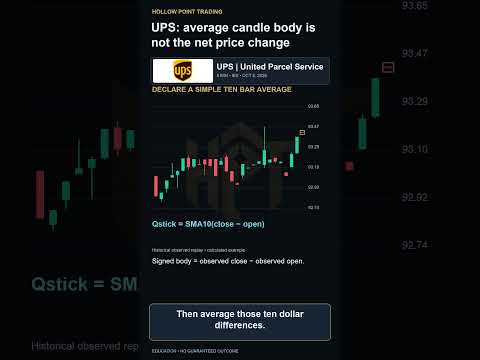
UPS: average candle body is not the net price change #UPS #Qstick #CandlestickAnalysis #Shorts
An average candle body is not the same as the total price change. This historical UPS IEX replay uses ten completed five minute candles from October eighth, twenty twenty six. We calculate a simple Qstick example: subtract each candles observed open from its close, retaining the sign. Then average those ten dollar differences. The signed bodies sum to approx
I Just Locked In $2,000 | QQQ Calls Live With My Discord #Shorts
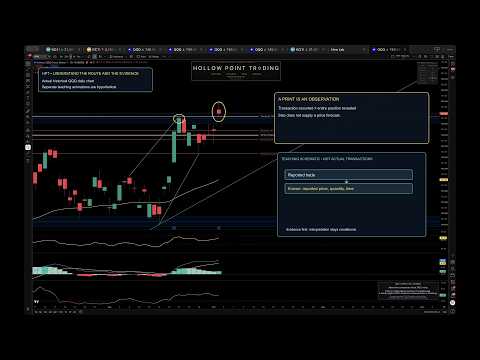
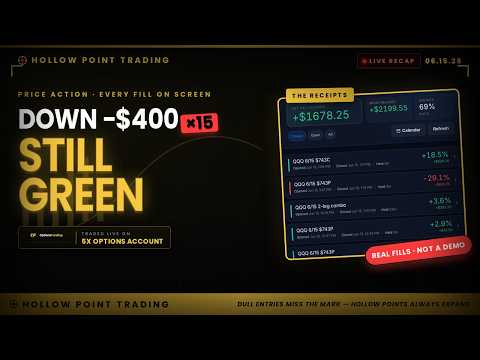
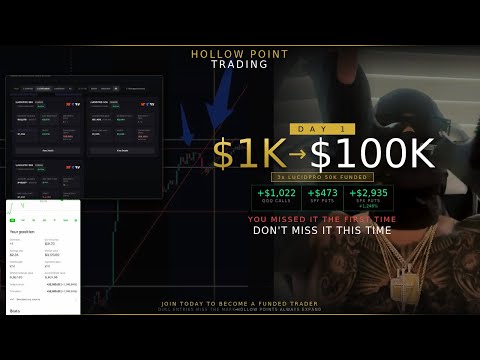
The callout. The chart. The position. The close. Watch my QQQ $742 calls trade live with Hollow Point Trading Discord: 50 contracts at $1.06, the original Discord callout, and the exit. Mark your levels before entering. Know where you plan to take profits. Full QQQ price-action breakdown: #QQQ #OptionsTrading #DayTrading #HollowPointTrading #Shorts
Days to cover can fall without a short position closing #DaysToCover #ShortInterest #TradingVolume
Days to cover is a ratio, not a countdown. Imagine a hypothetical reported short interest of one million shares and average daily volume of two hundred thousand shares. Dividing the position snapshot by that volume gives five days of average volume. Keep the short position unchanged, but use a later declared averaging window with five hundred thousand shares
GDP subtracts imports to remove foreign production #GDP #Imports #Macroeconomics #EconomicEducation
Imports are subtracted in GDP accounting to remove foreign production already included in spending. Consider a hypothetical consumer purchase of a fully imported good for one thousand dollars. In this simplified case, the purchase and import happen during one period. Exclude domestic retail margins, transport services and taxes. Consumer spending records plu
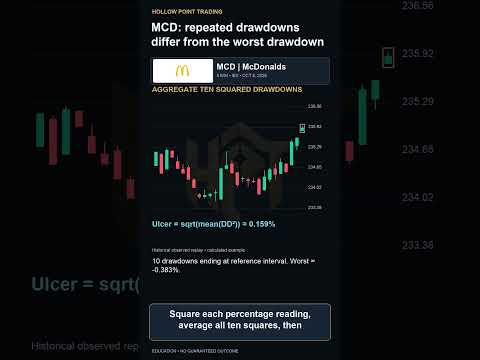
MCD: repeated drawdowns differ from the worst drawdown #MCD #UlcerIndex #Drawdown #TechnicalAnalysis
The worst drawdown does not describe every decline in a window. This historical McDonalds IEX replay uses completed five minute closes from October eighth, twenty twenty six. For each close, compare it with the highest of that close and the previous nine closes. Express the difference as a percentage of that rolling high. Now take ten consecutive completed d
Real GDP components do not always add like cash #RealGDP #ChainedDollars #Macroeconomics #Shorts
Inflation adjusted GDP components cannot always be added like cash receipts. The Bureau of Economic Analysis uses chain weighted quantity measures. A chained dollar series rescales its quantity index using the current dollar value in a reference period. This lets the series show real growth over time. Outside the reference period, components and their aggreg
A falling conversion price can create more shares #ConvertibleBonds #ConversionPrice #ShareDilution
A convertible security can create different share counts depending on its conversion formula. Consider a hypothetical one thousand dollar principal amount. Ignore accrued interest, fees and fractional share rules. At a fixed twenty dollar conversion price, that principal converts into fifty shares. Now consider a different contract whose conversion price res
I Just Locked In $2,000 | QQQ Calls Live With My Discord #Shorts
The callout. The chart. The position. The close. Watch my QQQ $742 calls trade live with Hollow Point Trading Discord: 50 contracts at $1.06, the original Discord callout, and the exit. Mark your levels before entering. Know where you plan to take profits. Full QQQ price-action breakdown: #QQQ #OptionsTrading #DayTrading #HollowPointTrading #Shorts
The Fed reserve rate is not your bank deposit rate #IORB #FederalReserve #MonetaryPolicy #Shorts
The interest rate on reserve balances is not the rate promised on your savings account. Eligible institutions hold balances at Federal Reserve Banks. The Federal Reserve sets the interest rate paid on those balances as a monetary policy tool. Your household deposit is instead a liability of your commercial bank. Imagine an eligible bank comparing a hypotheti
Ten percent of shares can control more than half the votes #DualClassShares #VotingRights #Shorts
Ten percent of the shares can carry more than half the votes. Consider a hypothetical company with ninety ordinary shares carrying one vote each, and ten founder shares carrying ten votes each. Assume both classes have identical economic rights per share, with no other voting securities. There are one hundred economic shares. The founder owns ten percent. Bu
A sinking fund retires an issue in stages #SinkingFund #Bonds #FixedIncome #FinancialEducation
A bond sinking fund does not necessarily give every holder the same annual principal payment. Imagine a hypothetical ten million dollar issue whose terms require one million dollars of bonds to be retired each year. After one completed retirement, the issue has nine million dollars outstanding, assuming no other changes. That issue level reduction does not p
An unfilled order can change measured execution cost #ImplementationShortfall #TradeExecution
Looking only at filled shares can miss part of implementation shortfall. Suppose a hypothetical decision is to buy one hundred shares at a ten dollar decision price. Assume all one hundred were reasonably executable. Only sixty fill, at ten dollars ten cents. The chosen end valuation is eleven dollars. Ignore fees and cash interest. The paper portfolio gains
HON: TRIX measures change in a smoothed series #HON #TRIX #TechnicalAnalysis #TradingEducation
A TRIX reading is not the return of the stock itself. This historical Honeywell IEX replay uses completed five minute observations from October eighth, twenty twenty six. For our worked example, choose fifteen periods for each of three exponential filters, with each filter seeded from the first observed close. First smooth the closes. Smooth that resulting s
Downside deviation keeps the target and denominator explicit #DownsideRisk #RiskManagement #Shorts
Downside deviation depends on both the target and the calculation convention. In a hypothetical four month sample, returns are minus two percent, zero percent, plus two percent and plus four percent. Choose a zero monthly target. We are illustrating a discrete historical calculation, not estimating every possible future loss. Keep only shortfalls below the t
Good Enough to Screenshot? Take Profits. #SPX #TradingDiscipline #Shorts
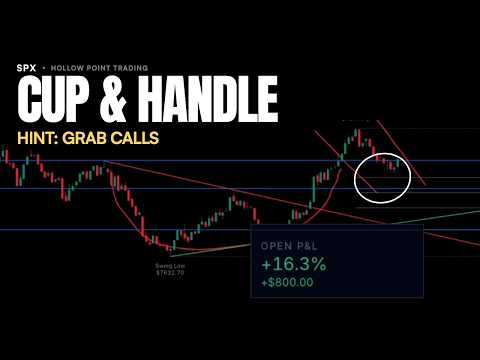
A green screenshot doesn’t lock in a dollar. A filled sell order does. My SPX 7,810 call: $60 in, $350 gross sale value, $290 gross profit before fees. One contract. A filled exit. Respect your target. Protect your capital. Lock it in. Hollow Point Trading #SPX #OptionsTrading #TakeProfits #TradingDiscipline #HollowPointTrading #Shorts
UPS: PPO normalizes the moving average difference #UPS #PPO #TechnicalAnalysis #TradingEducation
The same moving average difference can be stated in dollars or percent. This historical UPS IEX replay uses completed five minute closes from October eighth, twenty twenty six. We choose twelve and twenty six period exponential averages, each seeded with the first observed close. We calculate only the main oscillator, not its signal or histogram. At the mark
A Treasury bill discount quote is not your holding return #TreasuryBills #DiscountYield #FixedIncome
A Treasury bill discount rate is not the percentage earned on your purchase cash. Consider a hypothetical bill with ten thousand dollars of face value, purchased for nine thousand eight hundred, with one hundred eighty days until maturity. Assume it is held to maturity, with fees and taxes excluded. The two hundred dollar discount divided by ten thousand dol
MCD: R squared measures historical fit, not next trade odds #MCD #Regression #TradingStatistics
R squared is not the probability that the next trade wins. This historical McDonald's IEX example fits twenty completed five minute closes from October eighth, twenty twenty six. We use ordinary least squares with an intercept and interval numbers from zero through nineteen. Total squared variation measures each close against the sample mean. Residual square
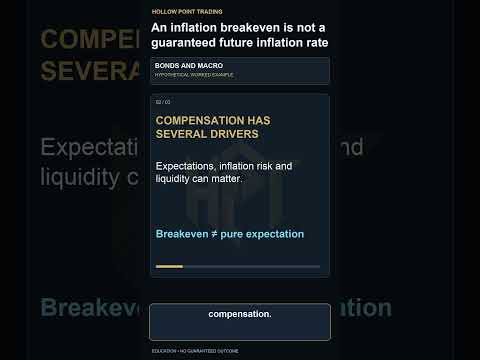
An inflation breakeven is not a guaranteed future inflation rate #BreakevenInflation #TIPS #Shorts
Market breakevens do not guarantee future inflation. In a hypothetical matched maturity comparison, a nominal Treasury yields five percent and an inflation protected Treasury has a real yield of two percent. The simple quoted yield difference is three percentage points. That spread is commonly called breakeven inflation, or inflation compensation. It contain
NEE: the channel midpoint is not an average of every close #NEE #DonchianChannels #TechnicalAnalysis
A channel midpoint is not necessarily the average closing price. This historical NextEra Energy IEX replay uses twenty completed five minute bars from October eighth, twenty twenty six. The declared window high is seventy six point seven three dollars. The window low measures seventy six point four three dollars. Add those two extremes and divide by two. The
CAT: a volatility reading above one hundred is not a stock return #CAT #ChaikinVolatility #Shorts
A volatility reading above one hundred does not mean the stock doubled. This historical Caterpillar IEX replay uses completed five minute bars from October eighth, twenty twenty six. For this Chaikin volatility example, calculate each high minus low spread. Smooth those spreads with a ten period exponential average, seeded with the first observed spread. The
Sharpe uses excess return and matched time units #SharpeRatio #RiskAdjustedReturns #Shorts
A Sharpe ratio is not your chance of winning the next trade. In a hypothetical monthly sample, assume average portfolio return is one percent per month. A matched monthly risk free return is zero point two percent, and the standard deviation of monthly excess returns is two percent. Subtract the monthly risk free return from the monthly average. That leaves
QCOM: double exponential does not mean double the period #QCOM #DEMA #TechnicalAnalysis #Shorts
Double exponential moving average does not mean doubling the lookback period. This historical Qualcomm IEX replay uses completed five minute observations from October eighth, twenty twenty six. We choose length ten. For this worked calculation, seed both exponential filters with the first observed close, using a smoothing weight of two divided by eleven. Fir
BAC: three oscillator windows are not three independent signals #BAC #UltimateOscillator #Shorts
Three lookback windows are not three independent confirmations. This historical Bank of America IEX replay uses completed five minute intervals from October eighth, twenty twenty six. Ultimate Oscillator defines buying pressure as close minus the smaller of current low and previous close. Its matching true range spans the larger high or previous close to tha
The plus line in Vortex is not a count of buyers. This historical UnitedHealth IEX data uses fourteen completed five minute intervals from October eighth, twenty twenty six. For each interval, positive movement means the absolute distance from the previous low to the current high. Negative movement uses the current low and previous high. Sum those distances
Profit factor compares dollar totals, not your win percentage #ProfitFactor #TradingStatistics
Profit factor is not your win rate or your account return. Consider four hypothetical closed trades, with costs already included. The gains are three hundred dollars and one hundred dollars. The losses are fifty dollars and one hundred fifty dollars. Total winning dollars are four hundred. Total losing dollars have a magnitude of two hundred. Profit factor i
A currency forward premium is not a guaranteed forecast #CurrencyForwards #InterestRateParity
A forward currency quote is not a guaranteed prediction of the future spot price. In a hypothetical frictionless example, one euro costs one dollar ten today. Assume matched one year simple rates of five percent for dollars and three percent for euros. For dollars per euro, multiply the spot rate by one point zero five divided by one point zero three. The im
XOM: choppiness compares accumulated range with the envelope #XOM #ChoppinessIndex #TradingEducation
Choppiness does not tell you whether the next move is up or down. This historical ExxonMobil IEX replay uses fourteen completed five minute intervals from October eighth, twenty twenty six. We sum each interval true range, including its previous close, then compare that sum with the window high minus its low. The summed true ranges are approximately 5.16 dol
JPM: PVT weights volume by a fractional price change #JPM #PriceVolumeTrend #TechnicalAnalysis
Price Volume Trend does not add the entire volume on every rising close. This historical JPMorgan IEX replay uses completed five minute observations from October eighth, twenty twenty six. The previous close is three hundred twenty eight point two three dollars. The next close is three hundred twenty eight point eight four. The close change is sixty one cent
The ex dividend date controls who gets this payment #Dividends #ExDividend #InvestingBasics #Shorts
The day a dividend is paid is not the deadline for buying the stock to receive it. For a regular cash dividend under the ordinary rule, a purchase on or after the ex dividend date does not receive that declared payment. A purchase before that date generally does. Imagine a declared dividend of fifty cents per share. An eligible holder of one hundred shares r
Equal cash purchases do not average the quoted prices #DollarCostAveraging #InvestingBasics #Shorts
Equal dollar purchases do not give you the simple average of two quoted prices. In this hypothetical example, invest one hundred dollars when a share costs ten dollars. That buys ten shares. Later invest another hundred dollars at five dollars per share, buying twenty more. You have spent two hundred dollars and bought thirty shares. Divide total cost by tot
JNJ: a channel can fall because an old high expires #JNJ #DonchianChannels #TechnicalAnalysis
A falling channel ceiling can reflect an old observation expiring. This historical Johnson and Johnson IEX replay uses completed five minute bars from October eighth, twenty twenty six. Define the ceiling as the highest high in ten observed bars, including the latest completed bar. The old window has a highest high of two fifty three point three six dollars. Its oldest bar carries that extreme. Advance the window by one bar. The incoming high is two fifty two point eight nine. The remaining highs top out at two fifty three point one nine, so the ceiling drops seventeen cents. The old price did not change, and the incoming bar did not create a new high. The reference set changed. This window effect does not prove new selling pressure. A prior session high stays fixed after that session, while a rolling high can age out. Specify the reference first.
Historical observed market-data replay.
Educational content, not personalized investment advice.
Sources:
https://www.tradingview.com/support/solutions/43000502253-donchian-channels-dc/
https://docs.alpaca.markets/us/reference/stockbars
#JNJ #DonchianChannels #TechnicalAnalysis #TradingEducation #Shorts
WMT: volume weighting does not make two windows identical #WMT #VWMA #VWAP #TechnicalAnalysis
Volume weighting does not make a rolling average identical to an anchored average. This historical Walmart IEX replay uses completed five minute bars from October eighth, twenty twenty six. Both use bar closes and the same reported volume. The ten bar volume weighted average uses the latest ten completed bars. At our marked reference it is approximately 110.41 dollars. The cumulative calculation starts at the first observed bar in this replay and includes forty one bars. It is approximately 109.97 dollars. Each divides weighted price by its included volume. When another bar completes, the rolling window removes its oldest bar. The anchored window keeps earlier bars until its chosen reset. We use close here; a platform VWAP may default to typical price. This partial IEX replay is not a full session benchmark. Declare source, anchor and window.
Historical observed market-data replay.
Educational content, not personalized investment advice.
Sources:
https://www.tradingview.com/support/solutions/43000592293-volume-weighted-moving-average-vwma/
https://docs.alpaca.markets/us/reference/stockbars
https://www.tradingview.com/support/solutions/43000502018-volume-weighted-average-price-vwap/
#WMT #VWMA #VWAP #TechnicalAnalysis #Shorts
XOM: a bounce is not a recovered drawdown #XOM #Drawdown #RiskManagement #TechnicalAnalysis #Shorts
A bounce after a decline does not mean the drawdown has recovered. This historical ExxonMobil IEX replay uses forty one completed five minute closing observations from October eighth, twenty twenty six. We measure drawdown from each running closing peak, not from intrabar highs. The largest closing peak to subsequent closing trough decline in this window goes from one sixty eight point nine nine to one sixty seven point four seven dollars. Divide the one dollar fifty two cent loss by the prior peak. Drawdown depth is approximately zero point nine zero percent. The final close rebounds to one sixty seven point eight two, still below the prior peak. Recovery is not observed before this window ends. Depth and recovery duration answer different questions. Changing the start date or using intrabar extremes changes the measurement. This is a retrospective description, not a forecast that price must return to the peak.
Historical observed market-data replay.
Educational content, not personalized investment advice.
Sources:
https://www.msci.com/documents/10199/402635a5-fd5d-498e-985a-1bec8ff8d8b1
https://docs.alpaca.markets/us/reference/stockbars
#XOM #Drawdown #RiskManagement #TechnicalAnalysis #Shorts
CRM: the same five closes can have two standard deviations #CRM #StandardDeviation #TradingEducation
Two different standard deviations can describe the exact same five prices. This historical Salesforce IEX replay uses five completed five minute closes from October eighth, twenty twenty six. Treat those five observations as the entire set being described. Divide the sum of squared distances from their mean by five, then take the square root. Population standard deviation is approximately zero point five three three dollars. Use the sample convention instead: divide by four. Sample standard deviation is approximately zero point five nine six dollars. The market did not become more volatile between calculations. The denominator changed. These are deviations of price levels, not percentage returns or an annualized volatility estimate. Match the statistical convention before comparing indicator values or research results.
Historical observed market-data replay.
Educational content, not personalized investment advice.
Sources:
https://www.itl.nist.gov/div898/handbook/eda/section3/eda356.htm
https://docs.alpaca.markets/us/reference/stockbars
#CRM #StandardDeviation #TechnicalAnalysis #TradingEducation #Shorts
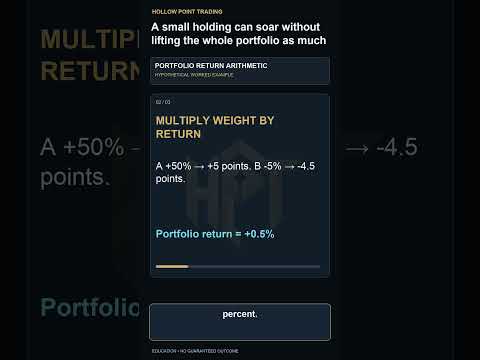
A small holding can soar without lifting the whole portfolio as much #PortfolioReturns #Investing
A stock return and its portfolio contribution are different numbers. Consider a hypothetical portfolio with ten percent in asset A and ninety percent in asset B at the start of one period. There are no cash flows, fees or rebalancing. Asset A gains fifty percent while B loses five percent. A contributes five percentage points to the portfolio return: ten percent weight times fifty percent return. B contributes negative four and a half percentage points. Together the portfolio gains only half a percent. A large winner can be offset by a much larger allocation to a modest loser. Use beginning period value weights and matching total return periods for this calculation. Do not average the two holding returns equally unless the starting allocations were equal. Contributions describe this period, not the next one.
Clearly labeled hypothetical worked example; figures are illustrative, not current company results.
Educational content, not personalized investment advice.
Sources:
https://www.investor.gov/introduction-investing/investing-basics/glossary/weighted-average
#PortfolioReturns #AssetAllocation #Investing #FinancialEducation #Shorts
AMZN: a long price path can end near its start #AMZN #EfficiencyRatio #PriceAction #Shorts
Price can travel a long way and end near its start. This historical Amazon IEX replay uses eleven completed five minute closes from October eighth, twenty twenty six, giving ten close to close intervals. The first close is two fifty eight point zero seven. The last is two fifty eight point three six. Absolute net displacement is twenty nine cents. Add the absolute changes of all ten intervals: three dollars seventy eight cents. Divide net displacement by total movement: approximately zero point zero seven seven. That is Kaufman efficiency for this declared window. Direction reversals enlarge the denominator while offsetting in the numerator. The ratio is not a stock return, a winning probability, or the full adaptive moving average. Use the same window and price source when comparing directional efficiency.
Historical observed market-data replay.
Educational content, not personalized investment advice.
Sources:
https://www.tradingview.com/support/solutions/43000773012-kaufman-s-adaptive-moving-average-kama/
https://docs.alpaca.markets/us/reference/stockbars
#AMZN #EfficiencyRatio #PriceAction #TechnicalAnalysis #Shorts
Vega: a volatility percentage point is not a one-percent relative change #Vega #ImpliedVolatility
A volatility percentage point is different from a one percent relative change. In a hypothetical option, implied volatility moves from twenty percent to twenty one percent. That is one percentage point, but a five percent relative increase in the volatility number. Suppose quoted vega is ten cents per share for each volatility percentage point. Holding other inputs fixed, the first order option value change is approximately ten cents per share. For a standard one hundred share contract, that is about ten dollars. Do not multiply by five simply because the relative volatility change was five percent. Confirm how the platform quotes vega and the actual contract multiplier. Vega itself changes, and stock price, time and other inputs can move together. This is a local sensitivity example, not a guaranteed trade profit.
Clearly labeled hypothetical worked example; figures are illustrative, not current company results.
Educational content, not personalized investment advice.
Sources:
https://www.optionseducation.org/advancedconcepts/vega
#Vega #ImpliedVolatility #OptionsTrading #OptionsGreeks #Shorts
A fifty percent markup is not a fifty percent gross margin #GrossMargin #Markup #Accounting #Shorts
A fifty percent markup does not mean a fifty percent gross margin. Imagine a hypothetical product costs eighty dollars and sells for one hundred twenty dollars. Gross profit is forty dollars before overhead, interest and taxes. Markup divides that forty dollar gross profit by the eighty dollar cost. It is fifty percent. Gross margin divides the same forty do
JNJ log returns: adding across time needs the right return definition #JNJ #LogReturns #Compounding
HPT explains why adding returns across time requires the right return definition, using three completed five-minute Johnson & Johnson IEX closes from October 8, 2026. The lesson works with natural logarithms of successive price ratios. Historical educational example, not a live quote or trading signal.
JPM regression: the fitted close is not the actual close #JPM #LinearRegression #StockMarket #Shorts
A fitted trend value is not an observed trade. This historical JPMorgan IEX example uses five completed five minute closes from October eighth, twenty twenty six. Number the bars zero through four, oldest to newest. Their average index is two; average close is three twenty seven point nine four eight. For a least squares straight line, divide the sum of cent
GOOGL weighted average: recent closes get more influence #GOOGL #WMA #MovingAverage #Shorts
A weighted moving average needs its weights declared. This historical Alphabet IEX example uses five completed five minute closes from October eighth, twenty twenty six. We assign weights one, two, three, four and five from oldest to newest. Their sum is fifteen. Multiply each close by its weight, add the products, and divide by fifteen. The five close weigh
COST directional movement: an outside bar does not score both sides #COST #DirectionalMovement #ADX
An outside candle can expand both ways without scoring positive directional movement on both sides. This historical Costco IEX example compares two completed five minute bars from October eighth, twenty twenty six. The previous high is nine forty seven point four one; the new high is nine forty seven point nine nine five. That upward extension is fifty eight
BAC RSI: count the size of gains and losses, not winning bars #BAC #RSI #TradingIndicators #Shorts
RSI does not count the percentage of winning candles. This historical Bank of America IEX example uses completed five minute closes from October eighth, twenty twenty six. We seed fourteen period average gains and losses with the first fourteen changes, then use Wilder updates. At the highlighted bar, smoothed average gain is approximately zero point zero th
Equal yield moves can produce unequal bond price changes #Bonds #Convexity #BondYields #FixedIncome
Equal yield changes can produce unequal dollar price changes. Consider a hypothetical default free, noncallable zero coupon bond paying one hundred dollars in three years. Use annual compounding and hold the remaining maturity fixed. At a five percent yield, its price is about eighty six dollars thirty eight cents. At four percent, it is eighty eight dollars
Selling ETF shares is different from redeeming a creation unit #ETF #CreationUnits #Investing
Selling an ETF share on an exchange is different from redeeming shares directly with the fund. Retail investors generally trade individual shares in the secondary market. Authorized participants can create or redeem large blocks under agreements with the fund. Imagine a hypothetical creation unit of fifty thousand shares and net asset value of twenty dollars
Stock Market Whipsaw: New Highs, Sharp Reversals—What’s Really Going On?
Start with the index, then the sector, then the stock. October 12 shows why: SOXX fell 2.60% while SPY slipped just 0.06%. A favorite ticker can be in the wrong part of the market for the setup you want. This HPT recap explains index membership and weight, sector and industry comparisons, IGV/SOXX and SOXX/QQQ relative strength, breadth, peer selection and t
MSFT Keltner: two ATRs do not mean a 95 percent interval #MSFT #KeltnerChannel #ATR #Shorts
Two average true ranges do not automatically create a ninety five percent probability interval. This historical Microsoft IEX replay uses completed five minute bars from October eighth, twenty twenty six. We declare a twenty period close EMA seeded at the first available close, and twenty period Wilder ATR seeded with twenty true ranges. At the highlighted b
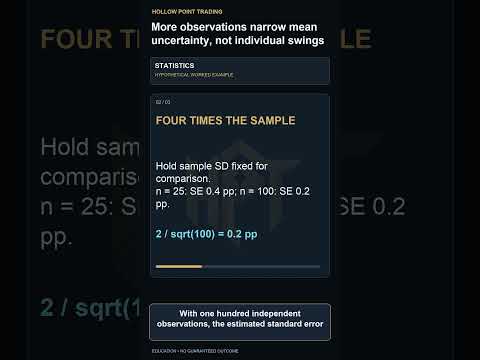
More observations narrow mean uncertainty, not individual swings #StandardError #Statistics #Shorts
A more precise average does not mean individual returns became calmer. Consider a hypothetical sample of independent observations with a sample standard deviation of two percentage points. With twenty five observations, the estimated standard error of the mean is zero point four percentage points. Hold that sample standard deviation fixed for comparison. Wit
DE Heikin Ashi: a calculated close is not the tape close #DE #HeikinAshi #Candlesticks #Shorts
A Heikin Ashi close is a calculated average, not the last observed trade price. The chart here remains standard observed candles. This historical Deere IEX example uses a closed five minute interval from October eighth, twenty twenty six. The interval opens at six forty three point seven six five. Its high is six forty four point one five, its low six forty
Supplier payment timing changes the cash conversion cycle #CashConversionCycle #WorkingCapital
Profit margin does not tell you how long cash stays tied up in operations. A simplified cash conversion cycle adds inventory days and receivable days, then subtracts payable days. It estimates the timing between paying suppliers and collecting sales cash. Imagine inventory lasts fifty days, customers pay thirty days after sale, and suppliers are paid forty d
XOM ATR percent: normalize dollars before comparing #XOM #ATR #Volatility #TechnicalAnalysis #Shorts
A dollar range needs a price denominator before comparing differently priced stocks. This historical Exxon Mobil IEX example uses completed five minute bars from October eighth, twenty twenty six. We seed fourteen period Wilder ATR with the first fourteen available true ranges, then update recursively. At the highlighted bar, ATR is approximately zero point
A low tracking error can coexist with consistent underperformance #TrackingError #TrackingDifference
A fund can track consistently and still lag its benchmark. Tracking difference describes a return gap over a stated period. Tracking error measures variability of periodic fund minus benchmark returns. Those are different questions. Imagine four hypothetical monthly active returns, each negative one tenth of a percentage point. Their variation around their o
AMD MACD: the histogram subtracts again #AMD #MACD #TradingIndicators #TechnicalAnalysis #Shorts
The MACD line and its histogram subtract different things. This historical AMD IEX example uses completed five minute closes from October eighth, twenty twenty six. We declare twelve and twenty six period exponential averages, seeded at the first available close. The signal is a nine period exponential average of their difference, seeded at zero. At the high
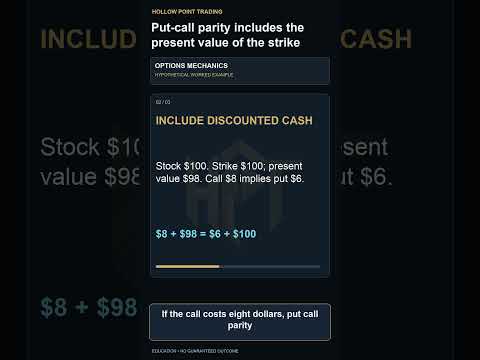
Put-call parity includes the present value of the strike #PutCallParity #OptionsPricing #Shorts
A call premium and a put premium are connected through more than their difference. Consider a hypothetical European call and put on the same underlying, with the same strike and expiration. Assume no dividends and an ideal market without transaction costs or borrowing restrictions. The stock costs one hundred dollars. The strike is one hundred dollars, but i
Twenty tests create more chances for a false discovery #MultipleTesting #FalsePositives #Backtesting
Testing twenty ideas gives noise twenty chances to look convincing. Consider a hypothetical example where every null hypothesis is true. Each test has a five percent false positive rate, and all twenty tests are independent. These are declared assumptions, not facts about trading strategies. The chance of no false positives is zero point nine five raised to
JPM ADL: a negative increment is not dollars leaving the stock #JPM #AccumulationDistribution
A negative accumulation distribution contribution is not measured dollars leaving a stock. This historical JPMorgan IEX replay uses a completed five minute bar from October eighth, twenty twenty six. Its high is three twenty nine point four seven; its low is three twenty eight point eight one. The close is three twenty nine point zero seven. It is twenty six
Two fourteen period ATR readings can differ because their smoothing differs. This historical Costco IEX example uses completed five minute bars from October eighth, twenty twenty six. We seed Wilder smoothing with the first fourteen available true ranges, then update recursively. Before the highlighted bar, the smoothed range is approximately one point zero
JNJ ROC: twelve intervals need thirteen closes #Shorts
A twelve period rate of change needs a current close and a close twelve bars earlier. That is thirteen closing observations, not twelve. This historical Johnson and Johnson IEX replay uses completed five minute bars from October eighth, twenty twenty six. The highlighted close is two fifty four point seven two. Twelve bars earlier, the close was two fifty tw
BAC Aroon: recency is not the size of a price move #Shorts
Aroon measures how recently an extreme occurred, not how many dollars price moved. This historical Bank of America IEX replay uses fourteen completed five minute bars from October eighth, twenty twenty six. We declare a fourteen bar window including the highlighted bar. The window high is fifty two point seven one, on the current bar. Zero bars have elapsed.
GOOGL CCI: mean deviation is not standard deviation #Shorts
The denominator in this CCI example is mean absolute deviation, not standard deviation. This historical Alphabet IEX chart uses five minute bars from October eighth, twenty twenty six. We explicitly choose typical price: high plus low plus close, divided by three. Across twenty completed bars, average typical price is approximately three forty nine point fou
XOM Williams percent R: measure distance from the window high #Shorts
A negative Williams percent R reading is not a negative stock return. This historical Exxon Mobil IEX example uses fourteen completed five minute bars from October eighth, twenty twenty six. The window high is one sixty nine point zero three five. The low is one sixty seven point two five. The highlighted close is one sixty seven point eight two. Its distanc
DE Donchian breakout: exclude the test candle from the threshold #Shorts
A breakout test needs a threshold that does not move with the candle being tested. This historical Deere IEX example uses five minute bars from October eighth, twenty twenty six. The highest high of the twenty completed bars before the highlighted candle is six forty six point three five five. The highlighted candle closes at six forty eight point three seve
MSFT moving average: the outgoing close matters too #Shorts
A simple moving average changes when one close enters and another leaves. This historical Microsoft IEX example uses five minute bars from October eighth, twenty twenty six. For the highlighted twenty close average, the incoming close is five twenty six point five two. The outgoing close is five thirty point three eight. The other nineteen closes stay in bot
Good till canceled does not always mean forever #Shorts
A good till canceled order can still expire under your broker rules. Imagine an unfilled buy limit left open after your original reason for buying has changed. Persistence is an instruction about duration, not proof that the trade still makes sense. Unlike a day order, a supported good till canceled order can remain across trading days. But brokers may impos
JNJ pivot highs: decide how equal prices are handled #Shorts
Two equal highs can expose an unstated rule in your swing detector. This historical Johnson and Johnson IEX replay uses five minute candles from October eighth, twenty twenty six. Four consecutive highs are two fifty six point six zero, two fifty six point eight one, two fifty six point eight one, and two fifty six point seven nine. Define a strict one neigh
Immediate or cancel can leave you with a partial position #Shorts
Immediate or cancel does not mean all or nothing. Imagine a hypothetical buy limit for five hundred shares at twenty dollars. Assume only two hundred shares can execute immediately at that price or better, and the order type is supported. With immediate or cancel, those two hundred shares can fill and the remaining three hundred are canceled. You now own a p
COST candlesticks: engulf the body or the entire range? #Shorts
An engulfing body and an outside candle are different tests. In this historical Costco IEX example from October eighth, twenty twenty six, the thirteen forty five candle opens at nine forty five point six four and closes at nine forty six point one nine. The next candle opens at nine forty six point oh three and closes at nine forty two point seven one five.
An adjusted profit needs its reconciliation bridge #Shorts
An adjusted profit headline needs a bridge back to reported earnings. Imagine a hypothetical company reports ten million dollars of net income under generally accepted accounting principles. Management adds back three million dollars of expenses, measured after tax. Adjusted net income becomes thirteen million dollars. The three million dollar difference is
Bullish harami Failed: Watch the Price Response #Shorts
Watch a bullish harami form after a decline, then fail. Its geometry is a small real body contained inside a preceding large red real body. Contrary follow-through crosses the pattern low, challenging the interpretation. A familiar pattern name does not guarantee the next move. Original Hollow Point Trading animation using an illustrative price sequence and
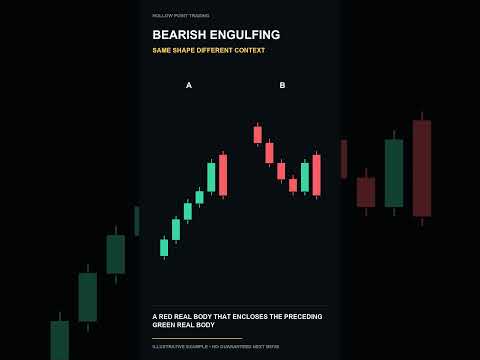
Bearish engulfing Failed: Watch the Price Respo nse #Shorts
Watch a bearish engulfing form after rising prices, then fail. Its geometry is a red real body that encloses the preceding green real body. Contrary follow-through crosses the two-candle high, challenging the interpretation. A familiar pattern name does not guarantee the next move. Original Hollow Point Trading animation using an illustrative price sequence
Bearish harami Failed: Watch the Price Response #Shorts
Watch a bearish harami form after an advance, then fail. Its geometry is a small real body contained inside a preceding large green real body. Contrary follow-through crosses the pattern high, challenging the interpretation. A familiar pattern name does not guarantee the next move. Original Hollow Point Trading animation using an illustrative price sequence
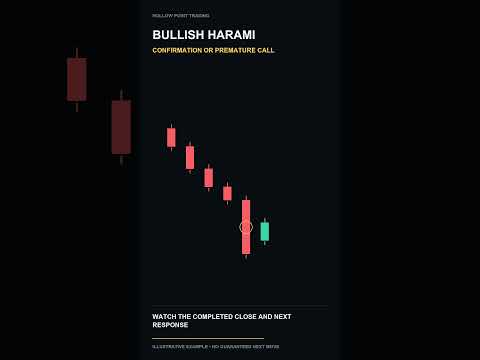
Bullish harami: Mark the Invalidation Before the Next Candle #Shorts
Define the pattern low before interpreting this bullish harami. Look for a small real body contained inside a preceding large red real body, after a decline. Watch subsequent price cross that boundary. Invalidation is new evidence; a structural level does not guarantee a stop fill at its exact price. Original Hollow Point Trading animation using an illustrat
Bearish engulfing: Mark the Invalidation Before the Next Candle #Shorts
Define the two-candle high before interpreting this bearish engulfing. Look for a red real body that encloses the preceding green real body, after rising prices. Watch subsequent price cross that boundary. Invalidation is new evidence; a structural level does not guarantee a stop fill at its exact price. Original Hollow Point Trading animation using an illus
Hanging man Failed: Watch the Price Response #Shorts
Watch a hanging man form after an advance, then fail. Its geometry is a small body near the high with a long lower wick. Contrary follow-through crosses the pattern high, challenging the interpretation. A familiar pattern name does not guarantee the next move. Original Hollow Point Trading animation using an illustrative price sequence and HPT narration. Fre
Inverted hammer: Mark the Invalidation Before the Next Candle #Shorts
Define the pattern low before interpreting this inverted hammer. Look for a small body near the low with a long upper wick, after a decline. Watch subsequent price cross that boundary. Invalidation is new evidence; a structural level does not guarantee a stop fill at its exact price. Original Hollow Point Trading animation using an illustrative price sequenc
Bullish engulfing Failed: Watch the Price Response #Shorts
Watch a bullish engulfing form after declining prices, then fail. Its geometry is a green real body that encloses the preceding red real body. Contrary follow-through crosses the two-candle low, challenging the interpretation. A familiar pattern name does not guarantee the next move. Original Hollow Point Trading animation using an illustrative price sequenc
Define the two-candle low before interpreting this bullish engulfing. Look for a green real body that encloses the preceding red real body, after declining prices. Watch subsequent price cross that boundary. Invalidation is new evidence; a structural level does not guarantee a stop fill at its exact price. Original Hollow Point Trading animation using an ill
Which Is the Real Bearish harami? Choose Before the Reveal #Shorts
Can you spot the bearish harami before the answer appears? Look for a small real body contained inside a preceding large green real body. Compare both examples carefully. One misses a defining feature. The correct shape is the starting point, not a prediction. Check the preceding trend and the next price response before drawing a conclusion. Original Hollow
Is This Bearish harami Confirmed Yet? Watch the Next Candle #Shorts
Is this bearish harami ready to interpret, or is the important bar still forming? Its structure is a small real body contained inside a preceding large green real body. Watch the next completed close and the response at the relevant boundary. Follow-through adds evidence, but it cannot guarantee continuation. An unfinished candle can change before the interv
Shooting star: Mark the Invalidation Before the Next Candle #Shorts
Define the shooting-star high before interpreting this shooting star. Look for a small body near the low and an upper wick at least twice the body, after an advance. Watch subsequent price cross that boundary. Invalidation is new evidence; a structural level does not guarantee a stop fill at its exact price. Original Hollow Point Trading animation using an i
Watch a inverted hammer form after a decline, then fail. Its geometry is a small body near the low with a long upper wick. Contrary follow-through crosses the pattern low, challenging the interpretation. A familiar pattern name does not guarantee the next move. Original Hollow Point Trading animation using an illustrative price sequence and HPT narration. Fr
Bearish harami: Same Shape, Different Trend—What Changes? #Shorts
These charts show the same bearish harami geometry. Do they tell the same story? The usual context is after an advance. Now compare that with the second chart. The shape can remain identical while its relevance changes. Read the trend and location first. A familiar name alone does not establish a directional edge. Original Hollow Point Trading animation usin
Which Is the Real Bullish harami? Choose Before the Reveal #Shorts
Can you spot the bullish harami before the answer appears? Look for a small real body contained inside a preceding large red real body. Compare both examples carefully. One misses a defining feature. The correct shape is the starting point, not a prediction. Check the preceding trend and the next price response before drawing a conclusion. Original Hollow Po
A big red candle can look convincing before it closes. This bearish engulfing example shows what to check before calling the pattern complete—and why the next price response matters. Look for a red real body that encloses the preceding green real body. A forming candle can still change; a completed pattern and follow-through add evidence without guaranteeing
Bullish harami: Same Shape, Different Trend—What Changes? #Shorts
These charts show the same bullish harami geometry. Do they tell the same story? The usual context is after a decline. Now compare that with the second chart. The shape can remain identical while its relevance changes. Read the trend and location first. A familiar name alone does not establish a directional edge. Original Hollow Point Trading animation using
Is This Bullish harami Confirmed Yet? Watch the Next Candle #Shorts
Is this bullish harami ready to interpret, or is the important bar still forming? Its structure is a small real body contained inside a preceding large red real body. Watch the next completed close and the response at the relevant boundary. Follow-through adds evidence, but it cannot guarantee continuation. An unfinished candle can change before the interval
Bearish engulfing: Same Shape, Different Trend—What Changes? #Shorts
The same bearish engulfing geometry can have different relevance. Look for a red real body that encloses the preceding green real body and compare its usual context, after rising prices, with the opposite trend. Read trend and location before assuming a directional edge. Original Hollow Point Trading animation using an illustrative price sequence and HPT nar
Is This Hanging man Confirmed Yet? Watch the Next Candle #Shorts
Is this hanging man ready to interpret, or is the important bar still forming? Its structure is a small body near the high with a long lower wick. Watch the next completed close and the response at the relevant boundary. Follow-through adds evidence, but it cannot guarantee continuation. An unfinished candle can change before the interval ends. Original Holl
Is This Bullish engulfing Confirmed Yet? Watch the Next Candle #Shorts
Is this bullish engulfing ready to interpret, or is the important bar still forming? Its structure is a green real body that encloses the preceding red real body. Watch the next completed close and the response at the relevant boundary. Follow-through adds evidence, but it cannot guarantee continuation. An unfinished candle can change before the interval end
Bullish Engulfing: Same Shape, Different Context #Shorts
These charts show the same bullish engulfing geometry. Do they tell the same story? The usual context is after declining prices. Now compare that with the second chart. The shape can remain identical while its relevance changes. Read the trend and location first. A familiar name alone does not establish a directional edge. Original Hollow Point Trading anima
Which Is the Real Bullish engulfing? Choose Before the Reveal #Shorts
Can you spot the bullish engulfing before the answer appears? Look for a green real body that encloses the preceding red real body. Compare both examples carefully. One misses a defining feature. The correct shape is the starting point, not a prediction. Check the preceding trend and the next price response before drawing a conclusion. Original Hollow Point
Which Is the Real Bearish engulfing? Choose Before the Reveal #Shorts
Can you spot the bearish engulfing before the answer appears? Look for a red real body that encloses the preceding green real body. Compare both examples carefully. One misses a defining feature. The correct shape is the starting point, not a prediction. Check the preceding trend and the next price response before drawing a conclusion. Original Hollow Point
Is This Inverted hammer Confirmed Yet? Watch the Next Candle #Shorts
Is this inverted hammer ready to interpret, or is the important bar still forming? Its structure is a small body near the low with a long upper wick. Watch the next completed close and the response at the relevant boundary. Follow-through adds evidence, but it cannot guarantee continuation. An unfinished candle can change before the interval ends. Original H
Which Is the Real Inverted hammer? Choose Before the Reveal #Shorts
Can you spot the inverted hammer before the answer appears? Look for a small body near the low with a long upper wick. Compare both examples carefully. One misses a defining feature. The correct shape is the starting point, not a prediction. Check the preceding trend and the next price response before drawing a conclusion. Original Hollow Point Trading anima
Hanging man: Same Shape, Different Trend—What Changes? #Shorts
These charts show the same hanging man geometry. Do they tell the same story? The usual context is after an advance. Now compare that with the second chart. The shape can remain identical while its relevance changes. Read the trend and location first. A familiar name alone does not establish a directional edge. Original Hollow Point Trading animation using a
Which Is the Real Hanging man? Choose Before the Reveal #Shorts
Can you spot the hanging man before the answer appears? Look for a small body near the high with a long lower wick. Compare both examples carefully. One misses a defining feature. The correct shape is the starting point, not a prediction. Check the preceding trend and the next price response before drawing a conclusion. Original Hollow Point Trading animatio
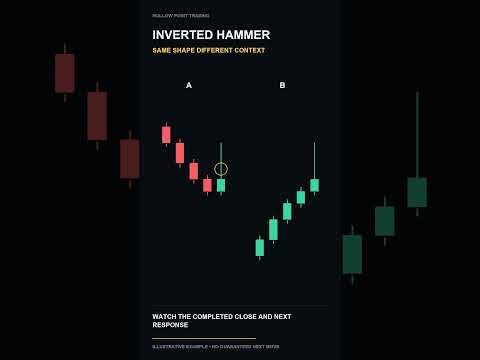
Inverted hammer: Same Shape, Different Trend—What Changes? #Shorts
These charts show the same inverted hammer geometry. Do they tell the same story? The usual context is after a decline. Now compare that with the second chart. The shape can remain identical while its relevance changes. Read the trend and location first. A familiar name alone does not establish a directional edge. Original Hollow Point Trading animation usin
The Market Is Rotating—Are You Holding the WRONG Stocks? | QQQ & SPY
The market bounced—but the leadership changed. Software jumped while semiconductors lagged. Before you trust the next green candle, see which groups are carrying the market, which levels must hold, and what could change the story next week. Saturday, October 10, 2026 deep dive on Friday’s October 9 market close: QQQ, SPY and SPX; RSP and breadth; NDFI and S5
SNDK: A low reclaim needs a fixed reference #Shorts
The prior candle low is 1668.69. The next candle reaches 1668.02, an overshoot of 0.67, and closes back above the reference at 1669.31. Now leave that original low in place as the next candles arrive. Moving the reference to each new candle changes the test you are running. A completed close back above the original level is a reclaim observation. It does not
AAPL: Range expansion is not body expansion #Shorts
This candle has a full range of 0.88. The preceding range is 0.48, so the new range is approximately 1.8 times as large. That comparison includes both wicks. It does not tell you how much of the candle is body or whether the next move continues. Compare the open and close separately, then watch the following response. A wider range means more price distance
This candle has a full range of 5.06. The preceding range is 2.63, so the new range is approximately 1.9 times as large. Now compare the candle body with that full range. Long wicks can create a wide high to low distance even when the open and close are close together. Calling every wide candle a strong directional candle mixes two measurements. Read body si
Do not check only one side of an inside bar. The mother candle high is 380.93 and its low is 380.46. The next candle high stays 0.01 below that high, while its low stays 0.04 above the mother low. Both boundaries are contained. That establishes range contraction. It does not choose the breakout direction. Keep the mother range fixed and wait for subsequent e
AAPL: Inside bars do not require matching colors #Shorts
Do not check only one side of an inside bar. The mother candle high is 333.57 and its low is 332.89. The next candle high stays 0.07 below that high, while its low stays 0.11 above the mother low. Those two boundaries define containment. Candle color is a separate observation: an inside bar does not need the same color as its mother candle. Check the high an
This Sandisk candle is red because it closes below its own open. Its open is 1669.70, and its close is 1669.31. But the preceding candle closed at 1669.11. The red candle still closes higher than that previous close. Candle color compares the open and close within one candle. Close to close change compares two candles. Read the reference before calling the c
Compare these real bodies. The earlier green candle opens at 376.91 and closes at 376.99. The next red body covers that interval, opening at 377.05 and closing at 376.73. That is bearish engulfing body geometry. It does not require engulfing the wicks. Read the location and next response before assuming continuation. HPT educational replay using recorded one
This upper wick measures 0.26, out of a full range of 0.34. Price traded above the real body, then finished below the high. A long wick describes the completed candle. It cannot identify individual orders or guarantee the next direction. Compare the high with nearby resistance and watch whether a later close reclaims it. HPT educational replay using recorded
These two highs are 373.29 and 373.28. They differ by no more than two cents. Calling them equal highs uses an explicit tolerance, rather than pretending every price is identical. The chart does not prove a stop cluster exists there. Treat the shared area as a reference and examine a later wick and close separately. HPT educational replay using recorded one-
This lower wick measures 4.75, out of a full range of 5.56. The final close sits above the interval low. That records a recovery inside this candle, not proof of a permanent bottom. Keep the actual low fixed. The following candles show whether the recovery holds or the low gets tested again. HPT educational replay using recorded one-minute SNDK observations
The prior candle high is 333.82. After the session break, the next observed opening is 337.67, above that range. This is a gap between observations. It differs from a three candle fair value gap. Do not animate invented overnight ticks between them. Watch the new session response without assuming every gap must fill. HPT educational replay using recorded one
The real body measures 0.24. The entire high to low range measures 0.32. Divide body by range: approximately 75 percent. A large body means the open and close are far apart relative to this candle. It does not measure individual buying or selling orders. Keep the completed candle fixed and compare what happens next. Recorded one-minute observations aggregate
The prior candle low is 339.75. The next observed session opens at 331.79, below that low. This opening gap compares observations across a session break. A three candle fair value gap uses a different rule. Leave the missing interval empty. Follow the actual new session candles instead of inventing overnight movement or assuming a gap must fill. Recorded one
This candle high is 1703.46, and its low is 1695.01. Add them and divide by two. The range midpoint is 1699.23. That is a price reference, not the average price of all trades. Compare the close with the midpoint and then watch the next response. The arithmetic alone cannot guarantee support or resistance. Recorded one-minute observations aggregated into five
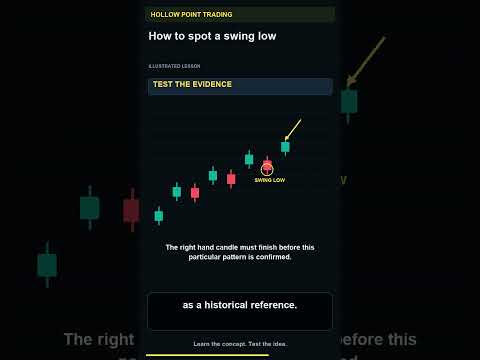
Spot the Swing High—Which Candle Confirms the Pivot? #Shorts
In a three-candle swing high, the middle candle has a higher high than both neighbors. Wait for the right-hand candle to close before calling that structure confirmed. A historical pivot alone does not predict the next move. Original Hollow Point Trading animation using an illustrative price sequence and HPT narration. Free trading education: HPT community:
Large Directional Candles or Small Overlapping Candles—What Changed? #Shorts
Large candle bodies making directional progress differ from several small overlapping candles. Compare expansion with consolidation to describe the current price behavior. This lesson compares candle sequences, not a separate range-bar chart type. Original Hollow Point Trading animation using an illustrative price sequence and HPT narration. Free trading edu
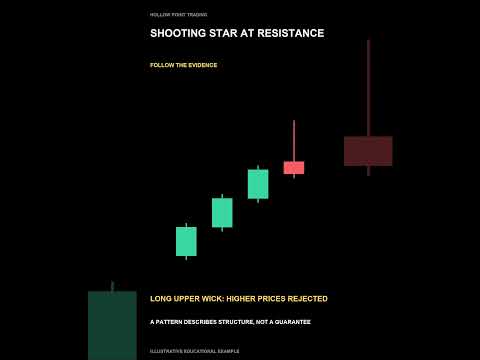
Shooting Star: Find the Long Upper Wick and Check the Trend #Shorts
A shooting star has a long upper wick and a small body near the bottom of its range. Context matters: compare it with the preceding uptrend and nearby resistance, then watch for confirmation rather than assuming a reversal. Original Hollow Point Trading animation using an illustrative price sequence and HPT narration. Free trading education: HPT community: #
Bullish Engulfing: Compare the Bodies, Not Just the Wicks #Shorts
A bullish engulfing candle has an up body that covers the prior down body. After a decline, a strong close can add reversal evidence. Mark the pattern low and nearby resistance; the shape alone does not guarantee a bottom. Original Hollow Point Trading animation using an illustrative price sequence and HPT narration. Free trading education: HPT community: #P
Hammer Candle: Does the Location Support the Pattern? #Shorts
A hammer has a long lower wick and a small body near the top of its range. After a decline near support it offers different context than the same shape inside a sideways range. Compare location and subsequent confirmation. Original Hollow Point Trading animation using an illustrative price sequence and HPT narration. Free trading education: HPT community: #P
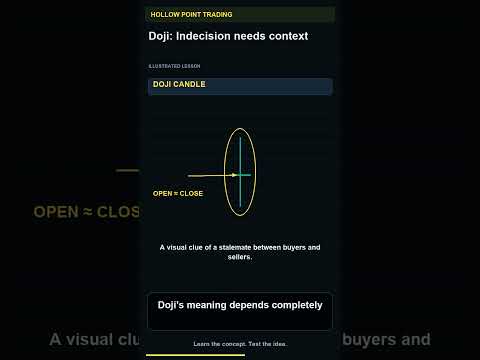
Doji: Tiny Body, Big Context—Where Did It Form? #Shorts
A doji forms when the open and close are almost the same, leaving a tiny body. Compare its location after a sustained move with the same shape inside sideways price action. Indecision alone does not choose the next direction. Original Hollow Point Trading animation using an illustrative price sequence and HPT narration. Free trading education: HPT community:
Bullish CHoCH on SNDK. First identify the confirmed swings: lower highs and lower lows. The gold line marks the relevant swing high at 1609.27. Now watch a completed candle close above that fixed level. Under this definition, that break challenges the preceding structure. It is an early change, not a completed reversal. A wick alone does not meet this close
Ichimoku Tenkan Kijun Cross — Read the Evidence #Shorts
The conversion line crosses above the base line. Is that enough? In the standard settings, they are the midpoints of nine and twenty six period high low ranges. Their cross describes changing range midpoints. Compare its location with price and the cloud. A cross above the cloud has different context from one trapped inside it. Recorded SPY one-minute observ
Bearish CHoCH on TSLA. First identify the confirmed swings: higher highs and higher lows. The gold line marks the relevant swing low at 372.31. Now watch a completed candle close below that fixed level. Under this definition, that break challenges the preceding structure. It is an early change, not a completed reversal. A wick alone does not meet this close
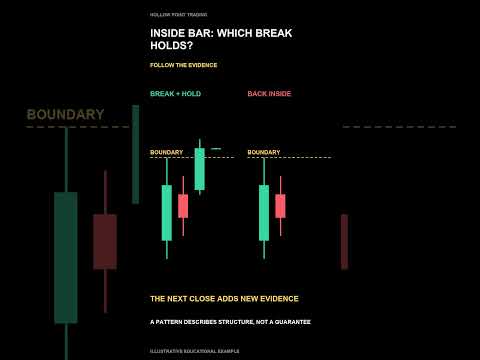
Inside Bar: Range Contraction Does Not Pick the Next Direction #Shorts
An inside bar has a high below the previous high and a low above the previous low. Mark the larger bar’s boundaries. A later break and hold provides different evidence from a break that returns inside; the smaller candle alone does not pick a direction. Original Hollow Point Trading animation using an illustrative price sequence and HPT narration. Free tradi
Read a Candlestick: Open, High, Low and Close in One Bar #Shorts
A candle summarizes four prices: open, high, low and close. Its body joins the open and close, while the wick tips mark the extremes. Changing the chart timeframe changes the interval each candle summarizes. Read the structure before predicting the next move. Original Hollow Point Trading animation using an illustrative price sequence and HPT narration. Free
RSI Crosses 50: Confirm the Price Breakout #Shorts
What changes when RSI crosses fifty? The balance of smoothed recent gains and losses has shifted. Now compare the oscillator with price clearing its local range. Those are two different observations. A midline cross inside sideways chop can fail repeatedly. Watch the price boundary and its next retest before assuming a new trend. HPT educational replay. Reco
Ichimoku Cloud Breakout: A Close Versus a Wick #Shorts
Price has closed above the cloud. What exactly changed? The close moved beyond the upper cloud boundary on this chart. That is different from a wick briefly poking through. Check the trend context and the next test of the boundary. A cloud breakout can fail; its appearance is evidence to evaluate, not a promise. HPT educational replay. Recorded one-minute SP
Ichimoku Cloud Rejection: Watch the Rally Fail #Shorts
Price rallies toward the underside of the cloud, then closes back below it. Watch the rejection candle and the following swing. The cloud is a calculated reference area, not a physical ceiling. If price later reclaims it, the earlier bearish interpretation needs updating. Follow the evidence rather than defending the first signal. HPT educational replay. Rec
Which Is the Real Morning star? Choose Before the Reveal #Shorts
Can you spot the morning star before the answer appears? Look for a long red body, a small middle body, then a green close deep into the first body. Compare both examples carefully. One misses a defining feature. The correct shape is the starting point, not a prediction. Check the preceding trend and the next price response before drawing a conclusion. Origi
RSI Above 70: Why Overbought Does Not Mean Sell #Shorts
RSI is above seventy. Would you sell just because of that? Watch price continue higher while the oscillator stays elevated. Overbought describes recent momentum; it does not set an expiration date on a trend. Compare the next pullback with the previous higher low. A loss of structure adds evidence that the threshold alone cannot provide. HPT educational repl
Price makes a lower low. Underneath, RSI makes a higher low at the matching swing. That is bullish divergence. Momentum is no longer confirming the new price extreme. But price can keep falling. Look for a defined level to reclaim instead of treating the divergence itself as a guaranteed entry. HPT educational replay using recorded one-minute SPY observation
Bearish RSI Divergence: Match These Two Swings #Shorts
Which pair matters here? Price makes a higher swing high, while RSI makes a lower swing high at the corresponding times. That is bearish divergence. It describes weaker momentum behind the later price high. It does not guarantee an immediate reversal. Keep the swing points aligned, then watch whether price actually loses support. HPT educational replay using
RSI Below 30: Why Oversold Does Not Guarantee a Bounce #Shorts
RSI is below thirty. Does that guarantee a bounce? Watch the next red candle make another low while the oscillator stays depressed. Oversold can persist in a strong decline. A reclaim of a defined price level is different evidence from an oscillator merely entering a zone. Identify the level first, then watch the close. HPT educational replay using recorded
Touch or Acceptance? Read the Close at the Level #Shorts
A brief wick through a level differs from sustained trading beyond it. Closes can add evidence, but a single close does not guarantee acceptance. Watch how later candles behave around the same reference. Original Hollow Point Trading animation using an illustrative price sequence and HPT narration. Free trading education: HPT community: #PriceAction #Trading
Swept High Rejected: False Breakout or Another Test? #Shorts
Price can move above a prior high and then close back below it. That failed hold is evidence of rejection, but it does not guarantee a decline or prove stops were triggered. Watch the next response and define invalidation. Original Hollow Point Trading animation using an illustrative price sequence and HPT narration. Free trading education: HPT community: #P
Round Numbers: Price Magnet or Guaranteed Barrier? #Shorts
Round numbers such as 50 or 100 can attract attention and orders. They are useful areas to observe, but they do not guarantee support or resistance. Watch the reaction and define where your idea fails. Original Hollow Point Trading animation using an illustrative price sequence and HPT narration. Free trading education: HPT community: #PriceAction #TradingEd
The Opening Price: Reference Level or Magic Pivot? #Shorts
The opening price depends on the market, session and chart provider. Holding above or below it can help frame a session, but touching the open is not a trade by itself. Watch the return and the price response. Original Hollow Point Trading animation using an illustrative price sequence and HPT narration. Free trading education: HPT community: #PriceAction #T
A Deeper Pullback: Normal Correction or Weakening Trend? #Shorts
Compare the current pullback with earlier corrections and the prior higher low. A deeper retracement can warn of changing trend strength, but one Fibonacci number cannot diagnose a reversal. Watch the next swing and reclaim response. Original Hollow Point Trading animation using an illustrative price sequence and HPT narration. Free trading education: HPT co
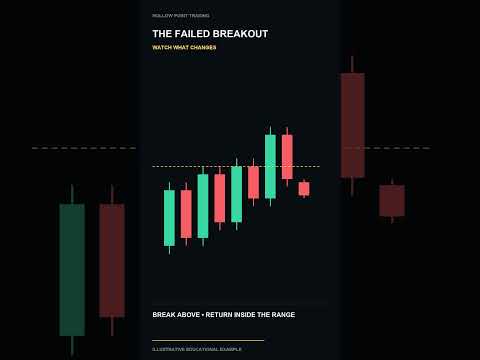
Breakout Failed? Watch the Close Back Inside the Range #Shorts
Price can push above resistance and then return below it. A decisive close back inside the range is evidence of failed follow-through. Watch the next response; the chart does not reveal every trader’s position or guarantee a decline. Original Hollow Point Trading animation using an illustrative price sequence and HPT narration. Free trading education: HPT co
Fresh Level: Untested Does Not Mean Guaranteed Support #Shorts
A fresh level has not been revisited since price moved away. That describes chart history; it does not prove hidden orders remain there. Watch the actual retest and price response before drawing conclusions. Original Hollow Point Trading animation using an illustrative price sequence and HPT narration. Free trading education: HPT community: #PriceAction #Tra
Impulse or Correction? Read the Direction and Overlap #Shorts
An impulse is typically directional and makes progress with the trend. A correction moves against it and can show more overlap. Compare both with the surrounding swings when assessing trend health. Original Hollow Point Trading animation using an illustrative price sequence and HPT narration. Free trading education: HPT community: #PriceAction #TradingEducat
Resistance Is an Area: Does the Wick Show Rejection or a Break? #Shorts
Resistance marks an area where sellers previously responded. A wick through the zone followed by a return below it differs from sustained price above it. Compare the close and the next response instead of treating one line as exact. Original Hollow Point Trading animation using an illustrative price sequence and HPT narration. Free trading education: HPT com
Support Is a Zone—Can Price Hold After Testing It? #Shorts
Support describes an area where buyers previously responded. Candles can probe through a line while remaining within the broader zone. Watch the close and follow-through to assess a hold or breakdown. Original Hollow Point Trading animation using an illustrative price sequence and HPT narration. Free trading education: HPT community: #PriceAction #TradingEdu
Trend or Range? Look for Progress Between the Swings #Shorts
A trend makes directional progress through its swing sequence. A range keeps rotating between support and resistance. Compare the highs, lows and overlap before assuming the next candle will continue in one direction. Original Hollow Point Trading animation using an illustrative price sequence and HPT narration. Free trading education: HPT community: #PriceA
Stock Market Update: Weak Hands Shaken Out—Are They Buying the Dip?
QQQ fell 1.34%, while equal-weight RSP rose about 0.63%. Was this a weak-hand shakeout and rotation—or the start of broader selling? We examine the buying-versus-selling evidence, not just the red index headline. Relative resilience outside the largest names is not proof that every breadth measure improved or that institutions accumulated every dip. Here is
Lower Highs and Lower Lows: Can You Trace the Downtrend? #Shorts
A downtrend is described by a sequence of lower swing highs and lower swing lows. Follow both sides of the structure instead of judging one red candle. A change in the swing sequence is a reason to reassess the trend. Original Hollow Point Trading animation using an illustrative price sequence and HPT narration. Free trading education: HPT community: #PriceA
Candle Body vs. Wick: What Does Each Part Actually Show? #Shorts
The body connects the open and close; the wicks extend to the highest and lowest prices beyond the body. A long wick shows an excursion that did not hold through the close. It does not prove who traded or what happens next. Original Hollow Point Trading animation using an illustrative price sequence and HPT narration. Free trading education: HPT community: #
Higher Highs and Higher Lows: Can You Trace the Uptrend? #Shorts
An uptrend is described by higher swing highs and higher swing lows. Trace both sides of the structure and compare each pullback with the preceding low. One green candle alone does not establish the trend. Original Hollow Point Trading animation using an illustrative price sequence and HPT narration. Free trading education: HPT community: #PriceAction #Tradi
Same Shooting Star Shape, Different Story? Watch the Trend #Shorts
Do identical candle shapes tell the same story? Compare the shooting-star geometry after an advance with the same shape after a decline. Read the trend and location first. A familiar name alone does not establish a directional edge. Original Hollow Point Trading animation using illustrative price sequences and HPT narration. Free trading education: HPT commu
Which One Is the Shooting Star? Choose A or B #Shorts
Which candle fits the shooting-star structure? Choose A or B, then watch the reveal. Look for a small body near the low and an upper shadow at least twice the body. The preceding advance and next price response matter. Original Hollow Point Trading animation using illustrative price sequences and HPT narration. Free trading education: HPT community: #Candles
Is This Hammer Confirmed Yet? Watch the Next Candle #Shorts
Is the important candle still forming? Watch a decline form a hammer, then follow the next completed closes. The gold line marks the hammer low. Follow-through adds evidence; an unfinished candle can change before its interval ends. Original Hollow Point Trading animation using illustrative price sequences and HPT narration. Free trading education: HPT commu
Same Hammer Shape, Different Meaning? Watch the Trend #Shorts
Two identical candle shapes can have different interpretations. Compare the decline on the left with the advance on the right. Read the trend and location before naming the pattern; shape alone does not establish what price will do next. Original Hollow Point Trading animation using illustrative price sequences and HPT narration. Free trading education: HPT
Which One Is the Real Hammer Candle? Choose A or B #Shorts
Choose A or B before the answer appears. A hammer has a small real body near the high and a lower shadow at least twice the body length. The preceding decline and the next price response matter. A familiar shape does not guarantee the next move. Original Hollow Point Trading animation using illustrative price sequences and HPT narration. Free trading educati
Is This Uptrend Losing Strength? Watch the Higher Low #Shorts
Watch an uptrend build higher highs and higher lows, fail to make a new high, and then close below its prior higher low. That changes the structure—it is a warning, not instant proof of a new downtrend. Original Hollow Point Trading animation with an illustrative price sequence. Free trading education: HPT community: #PriceAction #CandlestickPatterns #Tradin
Stock Market Update: Still Shorting Wall Street? Haven’t You Learned?
Micron rose 4.02% while SOXX fell 1.12%. Is memory leading the next move, or is this one winner inside a weaker market? October 7, 2026 market recap: QQQ and SPY levels, RSP and market breadth, all eleven sectors, chips versus software, Micron, Sandisk, Nvidia, AMD, Treasury yields, the dollar and commodities. Clear upside and downside tests connect the stor
October 6, 2026 after-market recap. QQQ and SPY held higher while software led, small caps lagged and biotech weakened. We connect the index levels, equal weighting, NDFI and S5FI reference readings, Marvell’s Investor Day, Micron’s reported earnings and stock reaction, Treasury yields, the dollar and commodities. Equity figures are native TradingView daily
Mid day Market Update: Indexes Are Green — But Chips Are Split
October 6, 2026 intraday market update: the indexes are green, but semiconductor leadership is split. We connect QQQ and SPY levels with equal-weight participation, software versus chips, Marvell's Investor Day, Micron, Treasury yields, the dollar, oil and gold. Afternoon observations around 2:38–2:44 PM Eastern, not final closing prices. NDFI and S5FI are t
When Market Structure Gets Messy: Read the Context
Learn how to approach market structure when price stops forming a clean trend. Full lesson: Trading education. No pattern guarantees an outcome. #Shorts #MarketStructure #HollowPointTrading
Learn how lower highs and lower lows describe a downtrend in market structure. Full lesson: Trading education. No pattern guarantees an outcome. #Shorts #MarketStructure #HollowPointTrading
Learn how higher highs and higher lows describe an uptrend in market structure. Full lesson: Trading education. No pattern guarantees an outcome. #Shorts #MarketStructure #HollowPointTrading
Learn to identify a swing low when reading market structure. Full lesson: Trading education. No pattern guarantees an outcome. #Shorts #MarketStructure #HollowPointTrading
QQQ broke higher on October 5, but semiconductors did not lead. Follow the index levels, breadth, software and biotech rotation, Micron earnings and tomorrow’s catalysts. Free education: Newsletter: Community: HPT All Access: 00:00 The breakout has a different engine 00:35 HPT mission and community 00:54 QQQ breakout and failure levels 02:41 SPY and equal we
Learn to identify a swing high when reading market structure. Full lesson: Trading education. No pattern guarantees an outcome. #Shorts #MarketStructure #HollowPointTrading
Impulse Candles vs. Range Candles: Spot the Difference
Learn the difference between impulse candles and candles inside a trading range. Full lesson: Trading education. No pattern guarantees an outcome. #Shorts #PriceAction #HollowPointTrading
A quick lesson on three-candle reversal patterns and why context and confirmation matter. Full lesson: Trading education. No pattern guarantees an outcome. #Shorts #PriceAction #HollowPointTrading
Learn to read engulfing candles using context, confirmation and invalidation. Full lesson: Trading education. No pattern guarantees an outcome. #Shorts #PriceAction #HollowPointTrading
Learn why a shooting star candle needs context and a meaningful location. Full lesson: Trading education. No pattern guarantees an outcome. #Shorts #PriceAction #HollowPointTrading
Learn why the location of a hammer candlestick matters when reading price action. Full lesson: Trading education. No pattern guarantees an outcome. #Shorts #Candlesticks #HollowPointTrading
A doji shows indecision. Its location and surrounding price action give it meaning. Full lesson: Trading education. No pattern guarantees an outcome. #Shorts #Candlesticks #HollowPointTrading
Outside Bar Candlestick: What Price Expansion Means
An outside bar shows price expanding beyond the previous candle. Learn to read it in context. Full lesson: Trading education. No pattern guarantees an outcome. #Shorts #Candlesticks #HollowPointTrading
Inside Bar Explained: What the Candle Is Telling You
Learn what an inside bar tells you about price action and context. Full lesson: Trading education. No pattern guarantees an outcome. #Shorts #PriceAction #HollowPointTrading
Learn to read candlestick bodies and wicks with HPT. Full lesson: Trading education. No pattern guarantees an outcome. #TradingEducation #HollowPointTrading
How to Read a Candlestick Without Guessing #Shorts
Learn to read candlestick bodies and wicks in context with Hollow Point Trading. Full lesson: Original animated educational diagrams, not live prices or trading signals. No pattern guarantees an outcome. Reference: #Shorts #TradingEducation #HollowPointTrading
Rates, the Dollar and Intermarket Context | HPT Academy
Stop staring at one chart. Learn to read the plumbing underneath the market — bonds, the dollar, credit, gold and oil — the way the desks that move real size actually read it. Read the complete lesson and its sources: Free HPT Academy: HPT community: Original education by Hollow Point Trading. Charts recorded in TradingView. Narration uses an AI-generated pr
Why the same chart that ignored you all week suddenly gaps 2% at 8:30am — and how to be on the right side of it Read the complete lesson and its sources: Free HPT Academy: HPT community: Original education by Hollow Point Trading. Charts recorded in TradingView. Narration uses an AI-generated presenter voice. Chart examples are educational and do not represe
Every chart is a fight between fear and greed. These are the two frameworks that let you read the fight — without pretending you can predict the winner. Read the complete lesson and its sources: Free HPT Academy: HPT community: Original education by Hollow Point Trading. Charts recorded in TradingView. Narration uses an AI-generated presenter voice. Chart ex
Ichimoku is five lines doing the work of a dozen indicators — here's how to run it, grade it, and trade it without drowning your chart Read the complete lesson and its sources: Free HPT Academy: HPT community: Original education by Hollow Point Trading. Charts recorded in TradingView. Narration uses an AI-generated presenter voice. Chart examples are educati
Market Structure: Trends, Breaks and Liquidity | HPT Academy
Market structure is the grammar of price. Learn to read it and you'll never stare at a chart wondering "what now?" again. Read the complete lesson and its sources: Free HPT Academy: HPT community: Original education by Hollow Point Trading. Charts recorded in TradingView. Narration uses an AI-generated presenter voice. Chart examples are educational and do n
Most of them fail. Here's how to trade the handful that don't — and how HPT stacks the odds in your favor before the breakout candle ever prints. Read the complete lesson and its sources: Free HPT Academy: HPT community: Original education by Hollow Point Trading. Charts recorded in TradingView. Narration uses an AI-generated presenter voice. Chart examples
Support and Resistance: Levels That Matter | HPT Academy
Price doesn't move at random. It travels from level to level — and once you can see the levels, you stop guessing and start reacting. Read the complete lesson and its sources: Free HPT Academy: HPT community: Original education by Hollow Point Trading. Charts recorded in TradingView. Narration uses an AI-generated presenter voice. Chart examples are educatio
Sector Rotation and Relative Strength | HPT Academy
Sector rotation, the business cycle, and reading relative strength to stand where the flow is going, not where it's been Read the complete lesson and its sources: Free HPT Academy: HPT community: Original education by Hollow Point Trading. Charts recorded in TradingView. Narration uses an AI-generated presenter voice. Chart examples are educational and do no
Every candle you stare at is a summary of a fight that already happened. Order flow is the fight itself — live, transaction by transaction. This is the complete guide to hearing it. Read the complete lesson and its sources: Free HPT Academy: HPT community: Original education by Hollow Point Trading. Charts recorded in TradingView. Narration uses an AI-genera
Market Breadth and Internals Explained | HPT Academy
Why the index lies, how breadth tells the truth before price does, and how to trade what you find there Read the complete lesson and its sources: Free HPT Academy: HPT community: Original education by Hollow Point Trading. Charts recorded in TradingView. Narration uses an AI-generated presenter voice. Chart examples are educational and do not represent curre
Entries get the glory. Risk pays the rent. Master this or the market ends your career for you. Read the complete lesson and its sources: Free HPT Academy: HPT community: Original education by Hollow Point Trading. Charts recorded in TradingView. Narration uses an AI-generated presenter voice. Chart examples are educational and do not represent current trade
Building a Trade: Entry, Target and Invalidation | HPT Academy
The whole series in one setup: from the macro tape down to the strike, the size, the trim, and the exit that gets you paid Read the complete lesson and its sources: Free HPT Academy: HPT community: Original education by Hollow Point Trading. Charts recorded in TradingView. Narration uses an AI-generated presenter voice. Chart examples are educational and do
Market Makers, Dark Pools and Liquidity | HPT Academy
The hidden machinery between your "buy" button and the print — and how to trade the flow instead of fearing it. Read the complete lesson and its sources: Free HPT Academy: HPT community: Original education by Hollow Point Trading. Charts recorded in TradingView. Narration uses an AI-generated presenter voice. Chart examples are educational and do not represe
Bollinger Bands: Volatility and Trade Context | HPT Academy
The volatility tool everyone plots and almost nobody reads correctly. Here's how to actually use it — construction, regime, the squeeze, and the confluence stack, with real numbers on every read. Read the complete lesson and its sources: Free HPT Academy: HPT community: Original education by Hollow Point Trading. Charts recorded in TradingView. Narration use
MACD: Momentum, Signals and Common Mistakes | HPT Academy
The most-used momentum indicator on Earth, and the one most traders read completely backwards Read the complete lesson and its sources: Free HPT Academy: HPT community: Original education by Hollow Point Trading. Charts recorded in TradingView. Narration uses an AI-generated presenter voice. Chart examples are educational and do not represent current trade r
RSI: Regimes, Momentum and Divergence | HPT Academy
The oscillator on every trader's screen is misunderstood by most of them. Here's how to actually read the momentum — regime, divergence, and the levels that make it a real edge. Read the complete lesson and its sources: Free HPT Academy: HPT community: Original education by Hollow Point Trading. Charts recorded in TradingView. Narration uses an AI-generated
Every average explained, why the EMA reacts faster, and how to turn a squiggly line into a decision you can act on Monday morning Read the complete lesson and its sources: Free HPT Academy: HPT community: Original education by Hollow Point Trading. Charts recorded in TradingView. Narration uses an AI-generated presenter voice. Chart examples are educational
Candlestick Patterns: Confirmation and Invalidation | HPT Academy
Every bar is a fight between buyers and sellers. Here's how to read who won, who's lying, and where the next move is hiding. Read the complete lesson and its sources: Free HPT Academy: HPT community: Original education by Hollow Point Trading. Charts recorded in TradingView. Narration uses an AI-generated presenter voice. Chart examples are educational and d
Why the best traders barely look at the chart until they've read everything holding it up Read the complete lesson and its sources: Free HPT Academy: HPT community: Original education by Hollow Point Trading. Charts recorded in TradingView. Narration uses an AI-generated presenter voice. Chart examples are educational and do not represent current trade recom
Futures Trading: Contracts, Margin and Risk | HPT Academy
Standardized contracts, near-24-hour access, and enough leverage to make or unmake an account before lunch — here's exactly how the machine works, and how a disciplined trader turns it into an edge. Read the complete lesson and its sources: Free HPT Academy: HPT community: Original education by Hollow Point Trading. Charts recorded in TradingView. Narration
Twenty-two ways to express a view — and the discipline to know which one fits Read the complete lesson and its sources: Free HPT Academy: HPT community: Original education by Hollow Point Trading. Charts recorded in TradingView. Narration uses an AI-generated presenter voice. Chart examples are educational and do not represent current trade recommendations.
Gamma Exposure and Dealer Hedging Explained | HPT Academy
Why the market pins, why it rips, and how to trade the levels the dealers are forced to defend Read the complete lesson and its sources: Free HPT Academy: HPT community: Original education by Hollow Point Trading. Charts recorded in TradingView. Narration uses an AI-generated presenter voice. Chart examples are educational and do not represent current trade
Options Greeks: Delta, Gamma, Theta and Vega | HPT Academy
Delta, Gamma, Theta, Vega, Rho — what every option is really doing under the hood, made intuitive, worked, and battle-tested Read the complete lesson and its sources: Free HPT Academy: HPT community: Original education by Hollow Point Trading. Charts recorded in TradingView. Narration uses an AI-generated presenter voice. Chart examples are educational and d
Calls and Puts: Payoffs and Risk Explained | HPT Academy
Long calls and long puts, taught properly — what you're betting, what it costs you, how the Greeks move against you, and how to stop donating premium to people who understand this better than you do Read the complete lesson and its sources: Free HPT Academy: HPT community: Original education by Hollow Point Trading. Charts recorded in TradingView. Narration
Options Basics: Contracts, Premium and Risk | HPT Academy
Everything a complete beginner needs to understand what an option actually is — and the mechanics that quietly decide whether you win — before you ever risk a dollar. Read the complete lesson and its sources: Free HPT Academy: HPT community: Original education by Hollow Point Trading. Charts recorded in TradingView. Narration uses an AI-generated presenter v
33 Trading Indicators and Tools Explained | HPT Academy
The master reference — what each one measures, the one signal that matters, when to use it, and how to stop drowning your chart in redundant noise Read the complete lesson and its sources: Free HPT Academy: HPT community: Original education by Hollow Point Trading. Charts recorded in TradingView. Narration uses an AI-generated presenter voice. Chart examples
Fibonacci Retracements and the Golden Pocket | HPT Academy
A trader's complete field guide to Fibonacci — the ratios, the one zone that does the heavy lifting, and the discipline that turns a 13th-century number pattern into an edge
Stock Market Update: Chips Are Ripping—Why Isn’t the Rest of the Market?
Chips rallied, but the weekly market repair was uneven. This October 3 HPT deep dive explains QQQ/SPY structure, weak breadth, semiconductor leadership, and a 20-stock conditional watchlist for next week. START HERE 03:46 QQQ upside and downside tests 10:20 Market breadth: who is participating? 36:05 Micron earnings versus stock performance 1:05:42 The 20-st
Stock Market Update: QQQ Hit ATH and You’re Still Bearish? Wake Up
QQQ hit a new intraday all-time high after the jobs report. A record high does not remove the need for a plan: this video shows what buyers need to reclaim, what they need to defend, and how rates and participation connect to the trade. This October 2 intraday update connects the morning economic releases with QQQ and SPY levels, equal weight participation,
Micron rallied while market breadth split. This October 1, 2026 chart breakdown explains the gap between QQQ/SPY performance and participation underneath the indexes. Includes Micron earnings, semiconductor versus software rotation, and the jobs-report scenarios discussed in that recording. Continue with the newer breakdowns: QQQ at all-time highs: Chips ral
The Green Index Hiding a Red Market: Why You Should Be Careful
Technology finished green, but most of the market did not. This September 30, 2026 market recap connects QQQ and SPY levels with Nasdaq and S&P 500 breadth, equal-weight weakness, Micron earnings, sector rotation, Treasury yields and commodities. We cover the upside reclaim, downside risk and confirmation that would change the outlook—not a guaranteed predic
NASDAQ & S&P 500 Critical Levels Don't Trade Until You Watch
Stock market update for September 29, 2026: QQQ and SPY levels, market breadth, semiconductor rotation, Micron earnings, and the catalysts that could change the next move. We connect the index charts to participation and sector leadership: NDFI alongside QQQ, RSP versus SPY, S5FI, and SOXX versus QQQ. Then we follow memory, storage, software, rates, the doll
Stock Market Update: Retail vs. Wall Street — Who’s Right About This Gap Up?
Watch Stock Market Update: Retail vs. Wall Street — Who’s Right About This Gap Up? from Hollow Point Trading. General trading education and market commentary.
Stock Market Update: QQQ Is Hiding This ( Not Yields )
Before you chase the next move in QQQ, Micron or SanDisk, know what confirms the setup—and what breaks it. A steady headline index can hide weak participation underneath. In this September 24 market breakdown, we connect QQQ, SPY and SPX levels with NDFI / S5FI breadth, equal weight, credit, all 11 sectors, semiconductor and memory-stock setups, Treasury…
Most Traders Are Missing the Next Breakout | What I’m Watching
QQQ reached the $748 test. The next question is whether semiconductor leaders can hold their breakouts while the rest of the market catches up. In this September 22, 2026 market review, I connect QQQ, SPY and IWM with breadth, sector rotation, individual stock setups, yields, oil, credit and volatility. I walk through the bullish conditions, the weaker…
QQQ Broke Out While Breadth Was Weak. Here’s the Trade.
QQQ broke out while broad-market participation remained weak. Is that a warning—or a semiconductor rotation you’re overlooking? In this September 21, 2026 market review, I connect the Nasdaq breakout to SOXX leadership, small-cap divergence, breadth, Treasury yields, credit, and the individual AI infrastructure stocks. Then I explain the long and short…
How I Passed My 13th E8 Account | Futures Trading & Live Chart Breakdown
Watch how I passed my 13th account live. This E8 futures session shows the chart work, the wait, and the final trade that finished the challenge. The result and certificate are in this video. 🔥 Ready to get in the room? Join HPT All-Access and start studying the process: Start with the education library: This is my actual September 14 TradingView…
SPX cup and handle explained with the original chart, trade and changing P&L. 📖 Study the free chart-pattern guide: Anybody can circle a cup and handle on a random screenshot. That part is easy. Watch the setup, the trade, and the P&L as it unfolds. Hollow Point Trading breaks down the SPX cup and handle with confident narration, timed arrows, and the…
QQQ bullish pennant explained: watch the chart pattern and the SPX options position shown in this recorded example. 📖 Study the free chart-pattern guide: Anybody can draw two lines on a screenshot. Watch the pattern, the breakout, and the P&L together. Hollow Point Trading walks through the QQQ bullish pennant with confident narration, timed arrows, and…
SOXX vs IWM: The Rotation Most Traders Missed | QQQ $721
While the headlines held everyone’s attention, semiconductor relative strength was improving. On Wednesday, September 16, SOXX gained approximately 0.64% while QQQ was nearly flat. By Friday, QQQ had closed at $721.45 after testing $700 on Wednesday. That is the price action behind my bullish case. I start with QQQ’s daily structure, levels and momentum,…
They want you to short this QQQ daily candle. It's a trap — and the reversal is already confirmed. QQQ closed 716.92, up 1.73%, which is +2.42% off yesterday's 700.00 low, and it did it by printing a bullish hammer right back above the 55-day EMA. Semis led: SOXX +3.39%, AMD +6.36%, MU +5.50%. VIX collapsed 12.8% to 15.44, the 10-year came back under 5%…
The Fed hiked 25 bps for the first time in three years, Kevin Warsh talked up sticky inflation, the Dow lost 631 points — and at 2:27 PM QQQ printed exactly 700.00, the put wall, and Wall Street bought it. Nasdaq closed green. Everyone who panicked sold the low, again. Same candle as the 2024, 2025 and April 2026 bottoms: undercut once, hold the level,…
QQQ closed at 704.54, back under its 55-day EMA, on the night before the Fed decision — with the 10-year yield at 5%, a 19-year high, and oil up another 3.6%. Three levels decide tomorrow: 730 is the call wall, 715 is the magnet price has fought over for 131 straight days, and 700 is the put wall. Lose 700 and 689 is the flush. Full QQQ, SPY and SOXX…
Fed decision Wednesday, the 10-year at 5%, semis down 5% in a day. SPY: call wall 763, put wall 758, flush 756 — then 775 or 745. QQQ: 716 to the 735 gamma wall, or 700 → 686 → 673. 🎯 Join the Discord — daily levels before the open: ⏱ Timestamps below 👇 0:00 Another chop day — why you don't have to be involved before the Fed 0:20 SPY daily: spinning top…
SPY and QQQ broke key support. Can CPI give the bulls a rebound, or does the next failed reclaim open the door to a deeper selloff? HPT Discord: Timestamps: 00:53 QQQ | 02:25 SPY | 11:23 Treasury yields. Full chapters below. Recorded September 10, 2026, ahead of the September 11 CPI release. This is my plan going into the number, with the chart levels,…
Bulls got scared when QQQ and SPY weakened—but bears should be watching what held up. In this September 9 market recap, Hollow Point Trading breaks down the divergence between trapped QQQ price action and semiconductor, memory, and AI-hardware strength across SOXX, MU, SNDK, AMD, and SMCI. The thesis from the video: broad-market breadth weakened while…
Watchlist For Week of Sept 8: 5 Stocks Ready to Rip
A multi-timeframe audit of the September watchlist, narrowing 42 assets to five defined long setups with institutional levels and explicit risk parameters.
The jobs report came in hot, yet SPY and QQQ refused to break. That contradiction is the market signal most traders are missing. In this Hollow Point Trading breakdown, I go from macro to index to sector to stock and map the levels that decide what happens next. We examine SPY and QQQ structure, gamma and expected-move levels, the 55 EMA, candlestick…
The ONE Chart Everyone Ignored Just Hit $90 — Is $100 Next?
Oil closed over $90 for the first time in a month and the S&P 500 fell a third straight day — but SPX, QQQ and SOXX are all still inside the chop box. The map: SPY 764 reclaim, 759 floor, 737 flush zone. 🎯 Join the Discord — daily levels before the open: ⏱ Timestamps below 👇 0:00 The hook — third straight down day; this wasn't a normal pullback 0:17…
NVIDIA Earnings Tomorrow — What The Semi Bounce Is Telling Us
Market preparation for NVIDIA earnings using semiconductor price action, sector context, and the levels that can confirm or reject the developing setup.
🚨 DON'T GET CHOPPED THIS WEEK. You have been warned. QQQ is pinned right under 721.64 — the line in the sand. Break above it and hold, the game changes. Fail it, and they will saw you in half into the biggest event stack of the quarter. This is a trap-until-proven-otherwise tape, and here's exactly what's loaded: 📅 THE WEEK AHEAD (Aug 24–28) - WED 8/26 —…
Stock Market Update: The QQQ Doji Into OPEX — The Setup Everyone's Missing ( Watch Now)
⚠️ Join The Discord ⚠️ 👉 📩 Subscribe to the Free Daily Point Blank Newsletter 👉 🎯 Futures & Trading Signals — NQ, MNQ, GC, Stocks & Options Live Callouts 👉 🔫 Join the Patreon — Full War Room Access 👉 📡 Free Telegram — Real-Time Fire 👉 📱 Connect with Us Website:
STOCK MARKET UPDATE The Treasury Bailed Out the Bond Market — Tech Bleeds, Gold Explodes | WATCH NOW
⚠️ Join The Discord ⚠️ 👉 📩 Subscribe to the Free Daily Point Blank Newsletter 👉 🎯 Futures & Trading Signals — NQ, MNQ, GC, Stocks & Options Live Callouts 👉 🔫 Join the Patreon — Full War Room Access 👉 📡 Free Telegram — Real-Time Fire 👉 📱 Connect with Us Website:
Wall Street Sold Retail Bought the dip... ( The Top Is in)
⚠️ Join The Discord ⚠️ 👉 📩 Subscribe to the Free Daily Point Blank Newsletter 👉 🎯 Futures & Trading Signals — NQ, MNQ, GC, Stocks & Options Live Callouts 👉 🔫 Join the Patreon — Full War Room Access 👉 📡 Free Telegram — Real-Time Fire 👉 📱 Connect with Us Website:
Nasdaq Printed a Lower High — Is Wall Street Setting Another Retail Trap?
⚠️ Join The Discord ⚠️ 👉 📩 Subscribe to the Free Daily Point Blank Newsletter 👉 🎯 Futures & Trading Signals — NQ, MNQ, GC, Stocks & Options Live Callouts 👉 🔫 Join the Patreon — Full War Room Access 👉 📡 Free Telegram — Real-Time Fire 👉 📱 Connect with Us Website:
S&P 500 Update: WALL STREET Wants You To SHORT This… ( ITS A TRAP WATCH NOW)
⚠️ Join The Discord ⚠️ 👉 📩 Subscribe to the Free Daily Point Blank Newsletter 👉 🎯 Futures & Trading Signals — NQ, MNQ, GC, Stocks & Options Live Callouts 👉 🔫 Join the Patreon — Full War Room Access 👉 📡 Free Telegram — Real-Time Fire 👉 📱 Connect with Us Website:
PPI + CPI Flipped the S&P 500 Bullish — Here’s the Level That Confirms It
⚠️ Join My Next 8 Hour Live Stream⚠️ 👉 📩 Subscribe to the Free Daily Point Blank Newsletter 👉 🎯 Futures & Trading Signals — NQ, MNQ, GC, Stocks & Options Live Callouts 👉 🔫 Join the Patreon — Full War Room Access 👉 📡 Free Telegram — Real-Time Fire 👉 📱 Connect with Us Website:
AI Stocks Just Hit New Highs — The Rotation Wall Street Is Chasing
AI stocks just pushed to new highs as Wall Street rotates toward the companies capturing the 2026 AI infrastructure buildout. In this market update, I break down the key AI-stock levels, the rotation setup, and what could invalidate the bullish move. ⚠️ Join The Discord ⚠️ 👉 📩 Subscribe to the Free Daily Point Blank Newsletter 👉 🎯 Futures & Trading…
WALL STREET IS SELLING THEY MADE YOU FORGET WE NEED OIL NOT CHIPS S&P 500 RECORD CLOSE WAS A TRAP
⚠️ Join The Discord ⚠️ 👉 📩 Subscribe to the Free Daily Point Blank Newsletter 👉 🎯 Futures & Trading Signals — NQ, MNQ, GC, Stocks & Options Live Callouts 👉 🔫 Join the Patreon — Full War Room Access 👉 📡 Free Telegram — Real-Time Fire 👉 📱 Connect with Us Website:
Nasdaq Bearish Reversal Confirmed? Key QQQ Levels Traders Need Now
The Nasdaq printed a bearish reversal at a key resistance zone. This breakdown maps the QQQ and NQ levels that could confirm continuation lower—or invalidate the setup. ⚠️ Join The Discord ⚠️ 👉 📩 Subscribe to the Free Daily Point Blank Newsletter 👉 🎯 Futures & Trading Signals — NQ, MNQ, GC, Stocks & Options Live Callouts 👉 🔫 Join the Patreon — Full War…
Fibonacci Retracement for Beginners: How to Find the 0.618 Golden Pocket
Learn how to draw Fibonacci retracement levels and identify the 0.618 golden pocket. This beginner tutorial explains chart anchors, key levels, and common mistakes. 📖 FREE FIBONACCI GUIDE — continue the lesson with written examples: Start with the video, then use the guide to review retracements, extensions, char
Nasdaq Morning Star Pattern: The Next Candle Could Confirm the Reversal
The Nasdaq formed a Morning Star reversal pattern near support. This analysis explains the confirmation candle, invalidation level, and QQQ/NQ levels traders should watch next. ⚠️ Join The Discord ⚠️ 👉 📩 Subscribe to the Free Daily Point Blank Newsletter 👉 🎯 Futures & Trading Signals — NQ, MNQ, GC, Stocks & Options Live Callouts 👉 🔫 Join the Patreon —…
QQQ Inverse Head and Shoulders: The Breakout Level Nobody Is Watching
Watch QQQ Inverse Head and Shoulders: The Breakout Level Nobody Is Watching from Hollow Point Trading. General trading education and market commentary.
Wall Street Rotated Before the Headlines — Here’s Where the Money Went
Wall Street began rotating capital before the headlines caught up. This market update shows which sectors weakened, which groups gained strength, and the levels that would confirm whether the rotation continues. Follow the sector-by-sector money flow across the S&P 500 and Nasdaq, then compare market breadth with the SPY and QQQ levels shown in the video…
The Nasdaq and QQQ triggered a short squeeze as memory-chip and semiconductor stocks led a sharp rebound. In this breakdown, we use price action—not headlines—to map the bullish engulfing signal, the 55 EMA, and the levels that determine whether the rally has real follow-through. Key levels and catalysts: • QQQ 688 is the must-hold support area for…
QQQ Lost the 50% Control Level — Did Bulls Lose Control?
QQQ sold off sharply, then rebounded after hours. This market breakdown uses the 50% retracement/control level to show who owns the move—and why a fast overnight reversal can trap both bulls and bears. The Nasdaq and SPY had broken below the 55 EMA “institutional line” in the analysis, which the video treats as evidence of net sellers. It also connects…
S&P 500 Retail Trap? What Traders Should Watch Next
This S&P 500 market update examines the video’s retail-trap thesis and the price action traders should evaluate before choosing a direction. The focus is process over prediction: identify the setup, wait for confirmation, and define risk before acting. Use the S&P 500 and SPY chart discussion to decide whether the move is strengthening or failing instead…
Nasdaq Breakdown: QQQ Lost Institutional Support—What Comes Next?
QQQ lost the 55 EMA level used in the video as institutional support and broke a key options level. This Nasdaq breakdown explains what an undercut, retest, breakout, or continued breakdown would mean for the next move. The analysis also covers Nvidia’s loss of 55 EMA support, SOXX net selling, crude-oil structure, and the three-black-crows and…
SPY Has No Gap to Fill: The 50% Control Bar Traders Must Reclaim
Many traders saw a gap above SPY, but the video argues that the higher-time-frame chart shows a single bearish control bar instead. It explains the repeated rejection near the bar’s 50% line, the 55 EMA institutional-support test, and why price must reclaim the control bar before the bullish case strengthens. The walkthrough compares SPY with ES and maps…
Oil Shock Sends Nasdaq Lower — The QQQ 703 Level That Matters
An oil-driven geopolitical shock hit risk assets while hot labor data pushed yields higher, sending the Nasdaq and S&P 500 lower. This breakdown separates the news from the chart and maps the price levels that matter next. Inside the setup: • QQQ 703 is the key control level for the next move. • SPY and ES printed an evening-star warning near resistance.…
S&P 500 Evening Star Warning — Why Google Fell After a Huge Beat
The S&P 500 flashed an evening-star warning while Google reported a major earnings beat—yet the stock still fell. This market breakdown explains why headline earnings were not enough and what price action was signaling beneath the surface. What mattered: • SPY and ES showed an evening-star / falling-three warning near resistance. • The 55 EMA is the…
S&P 500 Bottom Signal? The 55 EMA Reclaim Bulls Needed
The S&P 500 and Nasdaq produced a risk-on reversal as bulls reclaimed the 55 EMA. This breakdown examines whether the move was a real bottom signal or only another rally that still needed confirmation. Signals covered: • A bullish abandoned-baby pattern marked the reversal attempt. • Three white soldiers added momentum after the 55 EMA reclaim. • SPY,…
Stock Market CRASH: Korea Entered a Bear Market Is The Nasdaq Is Next? The Chart says #stockmarket
I top-ticked QQQ 703c into a -$2,000 hole… then held it for an hour and walked it all the way back to green. Then I passed a $50K E8 futures account LIVE in front of the entire Discord — no edits, no cuts. All of this while the KOSPI enters an official bear market, the semis sit 20% off their highs, and the single biggest earnings week of the summer…
Stock Market Crash: Google Decides the Global Recession Wednesday — If They Say This, Sell It all.
⚠️ Join The Hollow Point Discord — INTERVIEW-ONLY ENTRY ⚠️ 👉 📩 Subscribe to the Free Daily Point Blank Newsletter 👉 🎯 Futures Only Signals — NQ, MNQ & GC Live Callouts 👉 🔫 Join the Patreon — Full War Room Access 👉 📡 Free Telegram — Real-Time Fire 👉 📱 Connect with Us Website:
NASDAQ FLIPS BEARISH — 55 EMA Broken, Oil +21%, VIX Breakout. This Preceded 8%, 14% & BTC's -36%
OPERATION DEAD CALM — Session Debrief, Thursday July 16, 2026. The market went quiet. That's the warning. Sideways since May, and while the crowd got bored, the structure rotted: the NASDAQ 100 just printed a FINAL daily bearish signal with the 10 crossing below the 50 and the 20 about to join. SOXX is down 20.29% from its peak. The VIX is coiled at the…
Smart Money Left Semiconductors & Retail Hasn't Noticed — Set The Alert That Fires BEFORE The Crash
PERATION LAST STAND — They come for the generals last. The index looked calm today. The internals were carnage. Semiconductor breadth broke down hard, the 55-day moving average keeps getting tested across the entire complex, and IBM pre-announced a disaster quarter that accidentally published a map of where every enterprise capex dollar in the market…
Stock Market CrashL The Biggest CPI Drop Since 2020, IBM's Worst Day EVER, Korea's Margin Call!!!
The S&P 500 printed a 70bp one-minute bar on the biggest CPI drop since April 2020 (-0.4% M/M, 3.5% Y/Y vs 3.8% expected)... and then ranged for six hours. Quiet index. Violent internals. This is the full debrief. Inside Operation Night Market: ▸ Korea's margin-call massacre — ~400,000 accounts force-liquidated, and why exhausted supply is how real…
Stock Market Crash: he −0.1 CPI Tripwire: Yen Carry, DRAM Collapse & Who Defends SPCX At $135?
The S&P said "normal day." It was lying. The NASDAQ gapped down on DRAM, SK Hynix's ADR fell straight back to its $149 IPO print on an LTA earnings downgrade, and South Korea (EWY) broke the head & shoulders neckline we mapped on Saturday. Tonight the margin calls fire in Seoul — tomorrow the levered ETFs go live (swaps for them, nothing for you) and CPI…
8 Hindenburg Omens, Retail All-In & a 7X IPO Dead Cat Bounce or NINE MORE LIVES?
🎯 OPERATION NINE LIVES — Weekend Sitrep, July 12, 2026 Semis crashed ~30% in days, bounced, and now the biggest earnings week in 5 YEARS decides everything: dead cat bounce, or nine more lives? In this briefing: ▸ Tuesday: JPM, GS, C, WFC open fire — the credit health check (±4–5% implied) ▸ Thursday: TSM rules on the entire hardware cycle (±6.5% implied…
My Pre-Market Warm-Up Routine..Athletes Warm Up Before every game. Why Are You Trading Cold? #
No sprinter steps into the blocks cold. No shooter checks into a game without warm-up shots. No fighter walks into the ring without shadowboxing. Every performance discipline on earth warms up before the moment that counts — except the average trader, who rolls out of bed at 9:12 and starts clicking buttons at 9:30 with real money on the line. In this…
U.S. Gives Iran Until SATURDAY — Oil Shock Loading, Semis Tracing Silver's −54.5% Crash Script
⏱️ OPERATION ZERO HOUR — Weekly Market Recap · Friday, July 10, 2026 Two clocks are ticking. The U.S. just gave Iran until SATURDAY to publicly renounce the Strait of Hormuz attacks — or face unspecified consequences (per Axios). Meanwhile, Kevin Warsh named his Fed task force roster: 15 picks, and not one vote for the money printer. In between sits a…
Memory Stock CRASH:Smart Money Leaves, The SK Hynix VS MICRON Playbook | Operation Hollow Point
⏱ CHAPTERS 0:00 Sitrep — the close, the put wall, the NASDAQ 55 2:10 The Beachhead — SK Hynix ADR ($149, SKHY, $28–30B, oversubscribed) 5:30 The TSM template — why ADRs eat the country ETF (EWY / KORU) 8:15 Stopped dead — SOXX, KLAC, Lam Research all reject the 12/22 11:00 The capex head-fake — Meta's 3 reinventions + gigawatt math ($20B/GW) 14:20…
Stock Market Crash: We ran out of Cash Last time this signal fired was 7 days before the 2007 CRASH
The market isn't failing at all-time highs because of Iran. It's failing because somebody hooked a fire hose to the liquidity swamp — and today we name everyone holding the hose. SpaceX marked the top with a $110B equity+debt suck. Google walked a $75B share sale to $84.75B (and the Berkshire anchor discount is already gone). Amazon grabbed $25B. SK…
SK HYNIX CRASHED THE Market Korea PANICS, CHEATS & HALTS ITS MARKET.. these moves are getting INSANE
The KOSPI tanked 8% and Korea HALTED trading for 30 minutes — on a Samsung BEAT. That's not a bad quarter. That's a cycle top. In this Operation Quicksand briefing I break down the $114 BILLION liquidity vacuum (SpaceX $85B + SK Hynix $29B Friday), the DRAM supply glut scheduled for 2028, the split-arrow rotation into healthcare and software, and why…
Why Every QQQ Rally Dies at 724, VIX at 15 Is Lying to You. Semi trade is OVER (And What Comes Next)
The S&P isn't the problem — the NASDAQ is. QQQ just got rejected at the top of its island reversal gap right on schedule, every rally is dying in the 724–725.53 kill zone, and semiconductors have been under bear control for two straight days. But the real warning is the one almost nobody is watching: the implied correlation index (CO1) just hit an…
Futures Props Are Bleeding You Dry. I Switched to Funded Options.
Futures props are built so you breach. I did the math, switched to funded options, and got paid $4,203 in 13 days — receipt posted publicly by the firm. In this video: - Why 5 micros = a dead $50K account (the $10/pt math) - Breached while UP $1,350 — how trailing drawdowns actually work - The reset-fee subscription model nobody talks about - NQ vs NDX:…
Smart Money Just Printed the BIGGEST BEARISH QQQ Trade in STOCK MARKET HISTORY
The single largest QQQ dark pool transaction in HISTORY just printed. SanDisk fell 14% in a day. A 3x semiconductor fund is down 42.9% from its top. Bullish sentiment just collapsed 13.5 points in ONE week — the fastest flush since 2021. And Meta just casually mentioned it has "excess compute" to sell... after years of everyone telling us compute was…
Market Crash"? The Dow Is At ALL-TIME HIGHS. You're Being Played.
Everyone's screaming carnage — the SOX dropped 14% in TWO trading days. But the Dow is at all-time highs, breadth got STRONGER all week, and the whole "collapse" took exactly five days to set up: window dressing into June 30 (+12% in 2 days, 95% close), a perfectly-timed Meta "neo-cloud" leak into a dead holiday tape, a coordinated "DRAM at half price"…
Palantir's CEO Just Called The AI Trade "Irresponsibly Oversold" — Then Zuck's Tape Leaked | #pltr
This market doesn't go up on truth. Truth has no bid. And for 48 hours in July, the two loudest insiders in the AI trade told the truth anyway — one on live TV, one on a tape he didn't know would leak. JULY 1 — Palantir CEO Alex Karp walks onto CNBC's Squawk Box and calls frontier AI models "completely, irresponsibly oversold." Says enterprise CEOs…
Dow's Record High Is a TRAP, Crude Filled Gap at 67, Oil Shock Setup Is Live, SPACEX Sell Signal
18:51 | Dow's Record High Is a TRAP, Crude Filled Gap at 67, Oil Shock Setup Is Live, SPACEX Sell Signal | The Dow closed at a record high, up ~600 points — while the NASDAQ-100 dropped 1.61% and the S&P closed flat. That's not strength. That's a decoy. In this brief: The S&P 500 1-2-1-2 nested wave structure — subwave 2 likely complete Why the bullish…
Stock Market bear trap? How JOLTS Flipped Every Key Level Into Quarter-End
Quarter-end close and they flipped every level that mattered in five days. In this one we break down exactly WHY it happened — not after retail was already in, but ahead of it. The 10:00 JOLTS print was the whole game: highest job openings in 12 months, dollar drops, equities bid — and that 10:00 bar became the low of the day on both the S&P and the NDX.…
Spy Day Trading $741.98 → $747.14, Hollow Point Trading Gap Filled (+$27K Day)| #BTC #NQ #daytrading
Bound by Rules. Feared by Trade. 8:43 AM I posted "I'm in SPY 742 Calls 0DTE" to @everyone — live, timestamped, before the move. Eight minutes later they were in the money. SPY ran clean from $741.98 → $747.14, filled the gap, and tagged the swing high right on the level I marked. The 742C closed +28.3% / +$6,369, and the session netted +$27,064. The…
I Doubled My Day Reading Cup & Handle on a 1-SECOND Chart | Spy Day Trading REVIEW Top Tick Budddddd
Watch I Doubled My Day Reading Cup & Handle on a 1-SECOND Chart | Spy Day Trading REVIEW Top Tick Budddddd from Hollow Point Trading. General trading education and market commentary.
POV: Spy Day Trading with a Top Ranked Options Trader +$3,725 in MINUTES on SPY 0DTE | HPT
Bound by Rules. Feared by Trade. Today was a clinic in patience-then-violence. One SPY 741C runner held into +20.6% (+$3,725.90), a 2-minute scalp that printed +16.5%, and a QQQ 724C swing that closed +8.5% (+$4,173.55). One red trade, cut in 6 minutes — that's the job. Net session: +$9,029.65. No signal-chasing. No revenge entries. Just the framework:…
The Rebalance Was A Trap Here's How They Flushed Retail and got you again. We were prepared this AM
This was supposed to be a quiet Monday bleeding off Friday's rebalance. Instead it was a textbook decoy: retail got told the sky was falling, scared out of semiconductors, and herded into healthcare and the Mag 7 — right before institutions calmly bought back everything that just got dumped. In Operation DECOY we break down the whole play. The flush (45…
MSTR/STRC/BMNR The largest Crypto PONZI SCHEME EVER. Saylor & TOM LEE LIED AND YOU FELL FOR IT WOW
Strategy (MSTR) just told the market two things at once: it authorized selling up to $1.25B of Bitcoin, and it quietly rewrote the dividend on its STRC "Stretch" preferred. The stock popped. The structure underneath did NOT get safer. In Operation BONFIRE we take the whole thing apart — the "infinite money glitch" that only ever ran one direction, the…
Stock Market Crash: AI Bubble CRACKED, Crude Oil PRIMED, Gold WILL CRASH | Hollow Point Trading
Asia led a global tech selloff, Nvidia cracked, and the U.S. struck Iran right after the close. In this week's recap I break down OPERATION TINDERBOX — three lit fuses sitting under the most overvalued market in history, and the exact levels that matter into a short holiday week. We were told this time was different. It isn't. A bubble with real earnings…
Stock Market Crash: The Real Reason Stocks Sold Off | The $165B Sell Order Nobody's Talking About
Friday handed us the mother of all flim flams. The tape looked broken — under the 55-day, a 12/22 cross, an island reversal, and big tech names cratering. The timeline decided the AI trade was over. I don't see it. In this breakdown I walk you through the TWO mechanical sellers that actually drove the move — neither of which has anything to do with…
STOCK MARKET IS ROTATING into builders, biotech, airlines, cruises while mega-cap software CRACK
TL;DR Tomorrow is quad-witching OPEX, and it collides with a quarter-end rebalance JP Morgan pegs near $150B in net equity selling — the biggest since 2023, and it's global, not just the S&P. Pension and insurance books are carrying their highest equity / lowest bond weights since ~2001 (the "alligator mouth"). Over their hurdle, they sell winners and…
The Tape Just Flipped: Island Reversals on 3 Indexes | Hollow Point Trading | Vix Close below 20??
The indexes dropped ~4% and printed textbook island reversals on the S&P, NASDAQ and NDX — yet the VIX couldn't even close over 20. That's the tell. In Operation: MAROONED we break down the gap fill to the futures roll, the 12/22/55 demarcation lines, the SPY 725 retest, the dollar breakout driving Korea's outflow cascade, and exactly how they hunted…
Stock Market Crash: SpaceX Broke VWAP, Emergency YEN Meeting & the Gamma Flip I WARNED YOU About..
It looked like a quiet day. It was anything but. In Operation: REENTRY we break down the Monday, June 22 tape level by level — the indices rejecting at core resistance, the leaders printing all-time-high closes, a freshly public trillion-dollar name making a complete round trip back to its IPO bid, and a carry-trade landmine that just woke back up.…
#1 Largest transaction ever recorded on the S&P500 what this mean for the Next 10 Days
The biggest options expiration on record just cleared — and now comes the undertow. 📉 This week we break down the post-OPEX / quad-witching setup heading into the historical "June swoon," a $14.6B whale print on SPY (the #1 single cluster of all time), SpaceX's record-shattering IPO volume, and a U.S. dollar breakout that may be the cleanest risk-off…
Micron Earnings Could BREAK the Market (17.6% Move Priced In) | Hollow Point Trading Report
Micron reports fiscal Q3 after the close on Wednesday, June 24 — and it may be the cleanest read-through on whether the AI-memory boom still has room to run. $MU is up ~300% on the year, the options market is pricing a ~17.6% overnight move, and the whole hardware tape is leaning on this print. In this dossier we stay neutral on the stock and run it…
The Stock Market"Scam" That Was Actually a Margin Call (STRC, SpaceX & the New Fed Chair)
A week of firsts. New buy volume I haven't seen print like that in years, a brand-new Fed chair who rewrote the rulebook in a single meeting, semis up 84% that the crowd still swears "can't last," a trapped pre-IPO name everyone wants to trade, and a "scam" that turned out to be a margin call in a costume. The loudest voices spent the week screaming — it…
WATCH BEFORE YOU TRADE NEXT WEEK. SPY DAY TRADING Quad Witching Playbook: The 7400 PIN LEVEL
The market pinned itself to 7400 into June expiration — and that pin is the bait. June 19 is quadruple witching, and the trade isn't Friday. It's the week AFTER. Here's the full breakdown: the mechanics, the implied move, and a backtest of every window around June OpEx. We run the three pillars — macro, fundamental, technical — through the single most…
THE FED JUST FLIPPED the Dot-Plot CUT → HIKE (Nobody's Ready) | Hollow Point Trading
A dove was priced in. A hawk showed up. In this Weekend Market Intelligence breakdown, we walk through why the green Thursday close is masking the most hawkish Fed week of 2026 — and what it sets up into the summer and the midterms. New Fed chair Kevin Warsh held the funds rate but flipped the dot-plot from an implied cut to an implied hike. 9 of 18…
Spy Day Trading | Learn how to scalp 1,000$ per day reading price action | Hollow Point Trading
Gave the first two calls away for FREE. Then I went solo and let the tape talk — six plays, all green, ~$9,700 on the session (~$7.1K locked). I called SPX 7,500 calls at 9:17 AM, live to @everyone. In the money by 9:45. Timestamped. I post the entry BEFORE it works — not the win after. Want to learn how to scalp 0DTE? Join my next FREE live stream.…
The Market Didn't Crash It Split. Here's the Real Story | Market Crash Cancelled..It's Bullish
21:03 | The Market Didn't Crash It Split. Here's the Real Story | Market Crash Cancelled..It's Bullish | The headlines screamed "meltdown." The tape said something more precise. June 2026 wasn't a crash — it was a violent rotation. The Dow ran to a record ~52,000 while the Nasdaq and S&P pulled back from their highs. In this briefing I break down exactly…
I Sat On My Hands For 37 Minutes — Then QQQ Calls Doubled | Hollow Point Entry
37 minutes of patience. One Hollow Point entry. Done for the day in ten. On June 17 the open was pure chop — and most people lost money fighting it. We didn't take a single trade for 37 minutes. One chart, one level, one note to the room: "waiting for things to shake out." Then QQQ flushed into the lows around 731, reclaimed, and the Hollow Point entry…
How to Read GEX (Gamma Exposure) for Day Trading Learn How Dealers Move the Market | Masterclass
Ever watch the market grind sideways all day and then rip into the close — or waterfall lower like someone was FORCED to sell? That's gamma exposure. In this 90-slide masterclass I break down GEX from the ground up, written in crayon, so you can finally read the chart everyone has and almost nobody understands. We build it piece by piece: Delta, gamma,…
Fed Day, BOJ to 1%, Iran Oil — The Exact Levels to Watch
One change today matters more than the SpaceX headlines: semiconductors — the leaders that dragged this tape higher all year — led the market LOWER. That's a warning, and it's landing the night before Kevin Walsh's first FOMC meeting as Fed chair. In this breakdown I give you the exact levels into Fed day, the semis on the line, and the trades worth…
Semis Are Driving Everything — The 560 Level Nobody's Watching
We sold off today — and after a gap that big, you shouldn't be surprised. In this Fed Eve breakdown I give you the EXACT levels to watch when the new Fed chair steps up tomorrow: where the Q's have to hold, the gap-fill magnet below, the semis target that's dragging the whole index, and why this is the best put-selling tape I've seen since the pandemic.…
ITS A TRAP: The TRUMP Iran "Deal is FAKE," $75B SpaceX TIC...TIC | Hollow Point Trading
The tape ripped today — Dow +470 intraday, S&P 500 +1.65% to 7,554, Nasdaq 100 back over 30,000, VIX crushed 8.37%. Clean risk-on session, right? Peace talk in the Middle East, a fresh mega-raise in the hottest private name on the planet, a Fed week ahead. Underneath the surface, every pillar is pointing at the same uncomfortable question: who, exactly,…
SPY DAY TRADING DOWN −$400 Closed Green | Live QQQ 0DTE | LIVE PRICE ACTION | HOLLOW POINT TRADING
I read price action to the tick for 2 hours straight — LIVE, in front of the room — and got scratched for −$400 fifteen separate times before the tape finally broke my way. Closed the day GREEN at +$692. No edited highlight reel. No curated win montage. Every entry, every exit, every fill is on screen exactly as it happened — the stop-outs, the patience,…
How To Actually Use Technical Analysis & Indicators (Full Masterclass) | Hollow Point Trading
Most traders pile 12 indicators on a chart and still lose. This is how to actually use technical analysis: moving averages, RSI, MACD, VWAP and market structure, broken down by WHAT they measure, WHY they matter, and HOW to stack them into clean confluence on any timeframe. No magic signals, no 70/30 nonsense, just a price-first process you can run on…
How ICT Actually Works on NQ Futures | Smart Money Concepts Masterclass
🔫 ICT TRADING EXPLAINED — How I read NQ futures using Smart Money Concepts, and where ICT fits inside the bigger macro → fundamental → technical framework I trade live every session. Most ICT content throws 40 acronyms at you and never shows you a real entry. This one's different. I break down the concepts that actually move the needle on NQ and show you…
Futures Day Trading 101: From Tick Size to Liquidity | Hollow Point Trading
Why futures beat options intraday · tick value (NQ $20 · ES $50 · GC $100) · exact P&L before you click buy · minis vs. micros as a risk dial · margin + prop firms · why day trading is the hardest game · drawdown, the unexpected, and tilt · chart setup (tools, news, levels, time frames) · liquidity explained simply · why double bottoms get hunted · fair…
Every Options Strategy Explained — Spreads, Straddles & Iron Condors (Masterclass) | Hollow Point T
Every core options strategy in one masterclass — bullish, bearish, neutral and volatility plays — with the construction, payoff diagram, risk profile and exact market conditions each one is built for. From single calls and puts to verticals, straddles, strangles, iron condors, butterflies, calendars and combos. No fluff. No ICT-only dogma. Just the full…
The Option Greeks, Finally Made Simple — Delta · Gamma · Theta · Vega | Hollow Point Trading
Option Greeks explained for beginners — Delta, Gamma, Theta and Vega, fully decoded with clean visuals and real Apple and Tesla examples. Every Greek measures a real risk you carry: direction, time, and volatility. We break down positive vs negative delta, gamma as the speed of delta, theta and time decay, implied volatility and vega, position-level…
Calls & Puts EXPLAINED for Beginners (Options Trading 101) | Hollow Point Trading #optionstrading
Option Greeks explained for beginners — Delta, Gamma, Theta and Vega, fully decoded with clean visuals and real Apple and Tesla examples. Every Greek measures a real risk you carry: direction, time, and volatility. We break down positive vs negative delta, gamma as the speed of delta, theta and time decay, implied volatility and vega, position-level…
BULL TRAP?! The $2.1 Trillion Top Nobody Wants To Talk About | Exit Liquidity Explained
The largest IPO in history just printed — but underneath the rocket, the Magnificent 7 quietly closed at a new relative LOW while the index made a new high. That divergence has a name: a bull trap. In this breakdown I walk the macro, the fundamentals, and the chart that ties it together, then give you the exact levels that confirm the trap sprung — or…
Wall Street Is Lying to YOU: The REVERSALl Nobody's Watching | MASSIVE CRISIS UNDERWAY
23:35 | Wall Street Is Lying to YOU: The REVERSALl Nobody's Watching | MASSIVE CRISIS UNDERWAY | Everybody's looking up at the rockets. I'm looking under the hood. SpaceX just printed the largest listing in history — $1.8T valuation, $75B raised, and only 4% of the float actually trading. The whole tape is a parade. But there's a problem hiding under the…
Morning Star & Evening Star: The Only Reversal You Need to Master | Hollow Point Trading
Morning star. Evening star. The two faces of the three-candle reversal — broken down the Hollow Point way. Inside: anatomy, the psychology behind every candle, confirmation vs. invalidation, the 1-minute vs. 3-month lens, sizing, and the "trap stars" that look real but aren't. No two patterns are equal — but it either is, or it isn't. ▶ Full 45-page…
STOCK MARKET CRASH WALL STREET BETS TYPE SHI | BURGER FLIPPER OR LAMBO DRIVER | HOLLOW POINT TRADING
WHAT WE COVER: - Why yesterday's CPI shock (4.2% — a 3-year high) flipped the whole tape - The hot PPI nobody's reading right — it's an OIL story, not a broad inflation story - The Trump/Iran "deal is close" headline pump-and-fade and how to stop chasing it - SpaceX: short squeeze, story-stock unlock trap, or Elliott Wave wave-3 collapse? - The July 6…
STOCK MARKET TRAP: CPI CRASH (They're Blaming Iran… It's NOT Iran) HERES WHY | HOLLOW POINT TRADING
ix days ago I drew the line in front of everyone: the Nasdaq cracked −5.01% and the S&P shed −2.64% on June 5 — a move I posted before it happened. The NDX puts ran +1,789% and the book closed +$333K green. Now CPI just dropped, and we're standing exactly where I said we'd be: a market trying to decide if Tuesday's bounce was THE bottom — or the bounce…
Practice Makes Profit: The A+ Candlestick Setup I Showed My Discord LIVE | Hollow Point Trading
Paper trading isn't cheating — it's reps before risk. In this session I broke down an A+ setup LIVE for the Hollow Point Trading Discord, walking through the exact candlestick patterns that flagged the entry: a clean push into the demand zone, a hammer rejection, and the bullish engulfing trigger that confirmed the long. Practice is where the edge gets…
THE BIGGEST TRAP IN STOCK MARKET HISTORY Wall St Shorts SPX to 5,500| Hollow Point Trading #bitcoin
Last week I drew the line and called it: the Nasdaq cracked -5.01% and the S&P shed -2.64% on June 5. The NDX puts ran +1,789% and the book closed green at $333K. Now comes the only question that matters — did we bottom on Tuesday, or is this the bounce they sell you right before the real flush? In File No. 05 — THE VERDICT — I lay out the full picture…
SPY DAY TRADING RECAP INSANE DAY +21,000, 1k-10K Challenge Compelte | Hollow Point Trading #trading
Another day. Another green close. On June 9, 2026 the room printed top to bottom — index 0DTE, single names, prop passes, and payouts. We called SPX 0DTE LIVE and rode it from +$100 all the way to ~+$2,000, while accounts ran to a +$21.4K day and $333K net. 90 days straight. Every single one green. That's not a highlight reel — that's the standard. The…
STOCK MARKET CRASH TICK..TICK..TICK THIS WEEK DECIDES EVERYTHING | Hollow Point Trading #stockmarket
Friday was a 4-SIGMA day on the Nasdaq — about a 5% drop. That's institutional distribution, not noise. Here's the read going into the week that decides the tape: Oracle Tuesday, CPI / PPI Wednesday, SpaceX IPO Friday — all under the shadow of Iran and the Strait of Hormuz. In this session I break down: ▸ Why Friday was four standard deviations into the…
Monday couldn't pick a direction. So we took both. 🎯 | Hollow Point Trading | Spy Day Trading #nq
Most traders spend the open praying the tape goes one way. We don't pray. We read. Monday handed us a two-way fight — buyers and sellers trading blows around SPX 7,450 and QQQ 717 all session — and instead of getting chopped to pieces like the people guessing, Hollow Point took money off both sides of the move. Calls when it pushed. Puts when it broke.…
What 300,000 inside a WebullTrading Account Looks like | Hollow Point Trading +17,000 INSANE DAY WOW
$300,000. 46 positions. One Webull account. Today I'm opening the book and walking you through every line. This isn't a flex it's a teardown. How the portfolio is actually built: the NDX straddles and 0DTE NDXP puts, the SMCI swing, the JEPQ income base, and how I size risk across options and futures without blowing it up. The green, the red, and the why beh
STOCK MARKET CRASH: Nasdaq Crashed Right Before The SpaceX IPO. The Worst Is Next Week (URGENT)
I told you it was coming — and Friday it hit. The Nasdaq 100 dropped 4.77% — its worst day since April 2025. Chips got gutted 9%. SOXL lost a third of its value in two days. Bitcoin slid under 60K. The VIX exploded +40%. And while everyone was buying the all-time high, I was sitting in QQQ puts I posted PUBLICLY on June 2nd. This is the full breakdown —…
I'm DONE Trading Futures — This Hidden Options Prop Firm Changes Everything | Hollow Point Trading
You've blown combines at Topstep, Apex, Tradeify, My Funded Futures and Alpha Futures — but there's an options-first prop firm they don't want on your radar: Options Funding. Why risk $3,000–$6,000 of your own money making mistakes in the most volatile tape in years? With a funded options account your worst case while you learn is a defined max-loss on a…
LIVE Day Trading +$50,000 — MASSIVE WINS!!!! 🚨 | Hollow Point Trading #tradingstrategy #daytrading
🚨 +$50,000 on JPM & UNH calls — called LIVE, tick for tick, in front of the whole room. No hindsight. No edits. Real charts, real entries, real time. This is what day trading looks like when you stop guessing and start running a framework. In this stream I break down exactly how the JPM and UNH calls were spotted, where the entries were marked, the…
Every BEARISH Signal Just Fired FIRST TIME SINCE 2007 | HOLLOW POINT TRADING | URGENT RECAP
The biggest IPO in history is about to drop into the most liquidity-starved window in years — and the market is pricing the exact opposite. AVGO just printed the first real AI miss. SPX is flashing a completed TD-9, a gravestone doji, and a textbook bearish divergence. Bitcoin is snapping every support on the road to 30K. Oil's higher-for-longer, yields…
E8 Futures Challenge PASSED In 15 Minutes| I am now a Funded futures Trader | HollowPointTrading
🔴 Passed an E8 Futures challenge in UNDER 15 MINUTES. One clean read — sweep, FVG, golden pocket, size in, target hit, account green. Watch exactly how it happened. This is the same ICT / Smart Money process I trade and teach every single session: read the liquidity sweep, mark the fair value gap and golden pocket, wait for the regime to confirm, size…
S&P 500 9 COUNT BEARISH SIGNALS | SPACEX UNDER INVESTIGATION THIS COULD CHANGE EVERYTHING
🚨 Did you know SpaceX quietly cleaned up $17.5B in debt with the same banks now selling its IPO — and that the index rules were REWRITTEN weeks before the listing? A company losing ~$5 BILLION a year is about to become the largest IPO in history (~$1.8 TRILLION), and the market's plumbing got re-engineered to make sure someone is FORCED to buy it. This…
SQUEEZE ZONE: How We Caught the Bottom | COIN, JPM, QQQ, SPX, NQ & AAPL Recap | Hollow Point Trading
We caught the intraday bottom, marked the SQUEEZE ZONE before price ever arrived, and walked an Apple position from down nearly $585 all the way to +48.9% — live, tick for tick, on stream. Full dissection of every trade from the June 2 session: COIN puts, JPM calls, SPX 0DTE puts, NQ futures, and the AAPL 320C that defined the day. Nothing cherry-picked…
NASDAQ Hits All-Time High… But The MARKET IS Rotating (URGENT Full Breakdown)| Hollow Point Trading
NASDAQ printed a fresh all-time high on June 1 — and a bearish DeMark count kept stacking right underneath it. Both are true. In this brief I read the June 1 tape through one lens and three pillars: macro, fundamental, technical. Top-down — index, sector, stock — then we only act where the pillars line up. We cover the index fork (the 7,470/7,400…
SPY 0DTE Trading Incredible day | Hollow Point Trading 06/01/2026 Recap #tradingstrategy #daytrading
June 1, 2026 — full session recap. Called the bottom at 9:27 AM off a lower-case-H read, ran the morning 4/4 / 100%, then walked the chart down into the close for a 100% → 300% end-of-day lottery. Squeeze zones and algos flagged live, every entry timestamped, every result backed by a brokerage receipt. The whole room ate. Inside this recap: The 9:27 read…
ADBE/QBTS BIG WIN | Hollow Point Trading | Dull Entries Miss The Mark Hollow Point Always EXPAND
The internet chased Adobe for weeks. The level was already on the chart. This is the full breakdown of the ADBE $255C 0DTE callout from 5/29 — the squeeze zone drawn BEFORE price expanded, the $0.15 entry with risk defined to the tick, and the call walked up live: +100% → +200% → +400% → ITM → +1,000% → +1,300%. No hindsight charts. No fake fills. Six…
Wall Street is hiding this from you.... This is actually getting scary #stockmarketcrash
The Shiller CAPE just hit ~42x — a level we've only seen ONCE before in market history (the dot-com peak). At the same time, three of the largest transactions ever recorded just printed in MSFT, MU and BTC. This move could create or destroy generational wealth — here's the full macro, fundamental and technical read. ⚠️ Not financial advice. 🎯 Dull…
He Lost $600K on Silver… From "I Need Help" to $51K | Hollow Point Trading Results MAYDAY Edition
8:07 | He Lost $600K on Silver… From "I Need Help" to $51K | Hollow Point Trading Results MAYDAY Edition | 10,000 to $51,000. Not one single losing trade. A few weeks ago, Roshan walked into Hollow Point Trading down $600K on silver and bleeding money. Today he's the Member of the Month with a five-figure account that's only gone one direction — up. In…
The Bull Case, The Risk Shelf & The Reversal Watch | Don't be the trader who misses the move AGAIN
The S&P is at all-time highs and three different reads on the same chart are all correct at once. In this breakdown I run the full three-pillar method — macro, fundamental, technical — on the current tape: the bull case under the hood, the macro risk shelf, and the reversal watch. Then I show you how they fit into ONE decision tree for a binary week, and…
The META (Facebook) Morning Star Nobody Saw +100,000 | Hollow Point Trading #tradingeducation
At 3:48 AM on 5/20 — while the whole timeline was asleep and everybody was overlooking META — I posted the full TradingView idea: “Meta Morning Star reversal,” grabbing the 630c 6/18 with the stop marked right in the notes. I called it before it happened. The chart wasn’t decoration, it was a set of rules: blue lines = pivot points laddered to 794, red =…
How I Knew SMCI Was the Play of the Year — Before It Moved
I called SMCI the play of the year on 5/14. Loaded 15 of the $40 calls at $0.54 on 5/20 — while the position was RED, down 14.81%, with SMCI sitting at $31.30. Everybody scrolled past it. Those same calls printed +563%. This isn't a screenshot after the fact. The level was drawn weeks early. The stop was named to the cent (30.16) and it held. The…
Snowflake the biggest LIE TOLD | I Fact-Checked the $6B and Found a Fraud Lawsuit
Snowflake jumped 34% after hours tonight on a "$6B data center" commitment. Except it's not data centers — it's $6 billion in AWS rent over 5 years. Meanwhile the company has -$1.33B in GAAP losses, $1.6B/year in stock-based comp, an active securities fraud class action, and $1.15B in convertible notes due NEXT YEAR. Tonight I fact-check the entire…
Wall Street Just Made Their Move — And Retail Has No Idea
Micron just got the single most important upgrade of 2026 — and the implications go way beyond one stock. UBS is rerating MU from a 5x PE to a 15x PE based on long-term agreement stability, and the numbers are staggering: 51% of S&P 500 EPS growth, 297% YoY revenue growth, 83% gross margins, $400B in cumulative free cash flow through 2029. But that's…
IRAN DEAL DEAD ON ARRIVAL — Ceasefire Collapse, Oil Shock & The 2000 Top Analog | HPT Hollow Report
The Iran deal is dead. Trump rejected it as "garbage," gave Tehran a 2-3 day deadline, and the strike window opens this Friday through Sunday — right into Memorial Day weekend with markets closed Monday. Wall Street is pricing in a deal that doesn't exist. The complacency is off the charts. This report breaks down everything you need to know before the…
Why Options Trading DESTROYS Futures for Prop Firms | Strix Options Full Guide
Discount code: ost prop firms are built for futures. You're forced to flatten before close, you have unlimited downside risk, and the ONLY way to make money is being right on direction. That's ONE dimension. One shot. Options give you THREE dimensions — direction, time, and volatility. You can profit when the market goes up, down, OR sideways. Your risk…
NVIDIA Earnings BEAT Everything — And Still Dropped 3% | Here's Why Smart Money Is Selling
NVIDIA just reported Q1 FY2027 earnings — and beat on literally every single metric. Revenue $81.6B (vs $79.2B est), EPS $1.87 (vs $1.78), Data Center $75.2B (+92% YoY), guidance raised to $91 BILLION (vs $86.8B Street), $80B buyback added, dividend hiked 2,400%. Gross margins at 75%. And the stock dropped 3% on the release. In this full market…
Best Broker for Trading — Robinhood vs Webull vs Schwab vs Fidelity vs IBKR (Honest Review)
Watch Best Broker for Trading — Robinhood vs Webull vs Schwab vs Fidelity vs IBKR (Honest Review) from Hollow Point Trading. General trading education and market commentary.
Trading for Beginners — EVERYTHING You Need to Know to Start Trading (Complete Guide)
The most complete beginner's guide to trading on YouTube. If you're starting from zero, this is your roadmap. Every single thing you need to know before risking real money. WHAT IS TRADING: ◾ What trading is and how it works ◾ Trading vs investing — the key differences ◾ Trading styles: scalping, day trading, swing trading, position trading ◾ Markets you…
What Is Futures Trading? COMPLETE Breakdown — History, Contracts, Margin, Leverage & How to Trade
Everything you need to understand futures trading from the ground up — from ancient grain markets to NQ futures on CME Globex. This is the most complete futures breakdown on YouTube. Period. What's covered: ◾ What futures contracts are and how they work ◾ The full history — Mesopotamia, Dojima Rice Exchange, CBOT, CME Group, E-minis, Micros ◾ Contract…
Chart Patterns EXPLAINED — Head & Shoulders, Triangles, Flags, Wedges, Cup & Handle (Complete Guide)
Every chart pattern a trader needs to know — fully explained with visual diagrams, identification rules, measured move targets, entries, stop losses, and reliability rankings. This is CHART patterns, not candlestick patterns — these are the geometric price structures that define market direction. 15+ patterns covered in full detail: REVERSAL PATTERNS: ◾…
Risk Management & Trading Psychology — The COMPLETE Guide to Surviving the Markets
90% of traders fail. Not because of bad strategy — because of bad risk management and uncontrolled emotions. This is the guide that fixes that. This covers EVERYTHING you need to protect your capital and master your mind: ◾ Why most traders fail — the math of account destruction ◾ The 1-2% rule — your survival mechanism explained with examples ◾ Position…
Title: Prop Firms EXPLAINED — How They Work, How to Pass, and How to Get PAID (Apex, TopStep, MFFU)
The complete guide to prop firm trading. How evaluations work, how to pass them, how to get funded, and how to get paid — with full breakdowns of the top firms. What's covered: ◾ What prop firms are and the business model behind them ◾ Who prop firms are for (and who they're NOT for) ◾ How prop firms make money — the reality check ◾ Types of evaluations…
S&P 7,353 | NASDAQ 28,924 | BREADTH IMPROVING BUT BONDS ARE SCREAMING | DONT MISS MY NEXT SIGNAL
Full market intelligence recap for May 19, 2026. Every index closed red. S&P 500 down 0.67% to 7,353. NASDAQ 100 down 0.84% to 28,924. Dow down 322 points. Russell down over 1%. VIX up 1.35%. Breadth is actually improving across all three timeframes — 5-day lifting, 20-day climbing toward 50%, and the 50-day reclaimed the critical line. That's…
Candlestick Patterns EXPLAINED — The ONLY Guide You Need (Beginner to Advanced)
Every candlestick pattern a trader needs to know — broken down with visuals, identification rules, reliability rankings, and exact trade setups with entries, stop losses, and targets. This guide covers 18+ patterns from single-candle formations to multi-candle continuation setups: ◾ Doji (Standard, Long-Legged, Dragonfly, Gravestone) ◾ Hammer & Hanging…
The Signs Are SCREAMING — MACD Cross, Samsung Strike, & Pres TRUMP IS DAY TRADING WTF? | WATCH NOW
DESCRIPTION: The MACD just got a bearish cross on the S&P 500. Divergences are on EVERY indicator — RSI, MACD, stochastic, money flow, histogram. The NASDAQ already has an RSI divergence. The Russell broke down from its rising wedge. And nobody is paying attention. Samsung's strike talks resumed Monday morning with a completely different tone — new…
05/18/2026 | +$20,000 Day Trading Options — Don't Miss My Next Signal.
My student Roshan Lynch joined the Hollow Point Trading mentorship and went from $12,408 to $21,474 in one week — up over $12,000 since he started. No signals. No copy trading. He learned the methodology and executes it himself. That's the difference. Meanwhile on 5/18/2026 we called the bearish drop overnight, puts printed across SPX, QQQ, and NDX, then…
Institutions Are Piling Into Bonds. This Risk-Off Signal Is Screaming — Are You Listening
This signal has an 87.5% crash rate. It's fired 8 times since 2000. Seven of those were followed by a 20%+ crash. It just fired again. This is 2007 all over again — and most people have no idea. I've been warning about this for months. In this video I break down the exact signal, show every time it's fired across 26 years of data, and explain why January…
EXTREMELY URGENT MARKET UPDATE | SAMSUNG STRIKE DEADLINE NO ONE IS TALKING ABOUT
Watch EXTREMELY URGENT MARKET UPDATE | SAMSUNG STRIKE DEADLINE NO ONE IS TALKING ABOUT from Hollow Point Trading. General trading education and market commentary.
AAPL earnings preview ( AVOID it trades flat and typically IV CRUSHES!)
Watch AAPL earnings preview ( AVOID it trades flat and typically IV CRUSHES!) from Hollow Point Trading. General trading education and market commentary.
The market is giving us a clear signal. NQ just printed a textbook Falling Three Methods pattern on the weekly timeframe - and if you know what you're looking at, this is the setup institutions use to trap retail before rotating out. In this video, I'm breaking down: → The exact Falling Three structure and why it confirms distribution → Where smart money…
🔴 LIVE Asia Session $50K Funded Tradeify | MFFU | AF | Topstep Learn My Strategy
Welcome to our LIVE NYSE trading session! Watch real-time analysis of SPX and NQ Futures with professional trading strategies. 🎓 FREE TRAINING MODULES: 📚 Join Hollow Point Trading Academy for comprehensive trading education Free Daily news Letter: 📊 What We Cover: • Real-time SPX & NQ Futures analysis • Price action and market structure • Gamma exposure…
The Biggest Stock Market Crash ever is coming by 2/28 North Korea Invasion, Iran Regime Falling..
Nobody is talking about this. Everyone is focused on NFP numbers, rate cuts, and AI earnings — meanwhile the biggest financial time bomb since 2008 is ticking underneath the entire market. The yen carry trade — the $4-6 TRILLION leveraged bet that has silently fueled the greatest bull market in history — is unwinding. Japan's 10-year bond yields just hit…
Tradeify $50K Evaluation PASSED | Live NQ Futures Trading Strategy That Actually Works
I passed the Lucid 50K funded account evaluation in 9 minutes trading NQ futures LIVE using ICT market structure concepts. Full breakdown — no edits, no cuts, real-time execution. Most traders spend weeks grinding an eval. I did it live, on stream, in under 10 minutes. This is what happens when you trade structure, not emotions. In this video you'll see:…
25K FUNDED IN 9 MINUTES | Lucid Evaluation PASSED Live Most traders spend weeks grinding an eval. I did it live, on stream, in under 10 minutes. This isn't luck. This is what happens when you trade structure, not emotions. In this video, you'll see: → The exact entry and execution that passed my 50K Lucid evaluation → Real-time decision making with no…
This FVG Setup Paid Me $1,500 in 20 Minutes | Funded Account Live Scalp
25K FUNDED IN 9 MINUTES | Lucid Evaluation PASSED Live Most traders spend weeks grinding an eval. I did it live, on stream, in under 10 minutes. This isn't luck. This is what happens when you trade structure, not emotions. In this video, you'll see: → The exact entry and execution that passed my 50K Lucid evaluation → Real-time decision making with no…
I passed my 25K Lucid Account | Become a Funded Trader with HPT Trading
25K FUNDED IN 9 MINUTES | Lucid Evaluation PASSED Live Most traders spend weeks grinding an eval. I did it live, on stream, in under 10 minutes. This isn't luck. This is what happens when you trade structure, not emotions. In this video, you'll see: → The exact entry and execution that passed my 50K Lucid evaluation → Real-time decision making with no edits,
I Passed a 50K Lucid Eval in 9 Minutes( Raw No Edits) | Join My Discord and turn your trading around
50K FUNDED IN 9 MINUTES | Lucid Evaluation PASSED Live Most traders spend weeks grinding an eval. I did it live, on stream, in under 10 minutes. This isn't luck. This is what happens when you trade structure, not emotions. In this video, you'll see: → The exact entry and execution that passed my 50K Lucid evaluation → Real-time decision making with no edits,
LINK: Live Charting Chart Levels Live Discord Analysis Day trading SPY options (SPDR S&P 500 ETF) can open the door to real, steady profits — even for traders starting with less than $1,000. With the right structure and discipline, hitting $100+ days isn’t a fantasy; it’s absolutely achievable. If you want deeper guidance and community support, you’re welcom
Stock Market CRASH: You KEEP listening to people WHO KEEP getting it wrong #trading
The market is giving us a clear signal. NQ just printed a textbook Falling Three Methods pattern on the weekly timeframe - and if you know what you're looking at, this is the setup institutions use to trap retail before rotating out. In this video, I'm breaking down: → The exact Falling Three structure and why it confirms distribution → Where smart money is
$3,000 profit on my Apex Trader funded account using ICT methodology. #ICT #Fundedtrader
In this video, I break down the exact setup that led to this win — Fair Value Gaps, Order Blocks, liquidity sweeps, and precision entries based on Inner Circle Trader concepts. Welcome to Hollow Point trading. Today I was live in front of my discord walking down a new indicator I made specifically for ICT 🎓 FREE TRAINING MODULES: 📚 Join Hollow Point Trading
How to Make $1,000/Day on a Funded Account (Simple NQ Strategy)#tradingstrategy #futures #nq #forex
EASIEST $10,000 DAY EVER? Proof that simple structure + the right tools = massive profits. While the rest of the market was getting chopped up and panicking, I was live on stream calling the exact moves on Nasdaq Futures (NQ). This isn't hindsight; watch me identify the setups in real-time. In this 3-hour live trading session, I break down exactly how I navi
LINK: Live Charting Chart Levels Live Discord Analysis Day trading SPY options (SPDR S&P 500 ETF) can open the door to real, steady profits — even for traders starting with less than $1,000. With the right structure and discipline, hitting $100+ days isn’t a fantasy; it’s absolutely achievable. If you want deeper guidance and community support, you’re welcom
I made 5,000 in 5 minute's trading NQ | One Simple Strategy #tradingforbeginners #futurestrading #nq
Jump into a straight-up, real-time futures trading session focused on Nasdaq (NQ). No hype, no long explanations — just clean reads, quick scalps, and the exact logic behind every move. You’ll see how I break down rotation, react to VWAP, spot liquidity grabs, and manage each trade with disciplined risk. Whether you’re trading your own account, grinding thro
STOCK MARKET CRASH I WARNED YOU FIRST ? Don't cry when you miss the signals. #tradingforbeginners
LINK: Live Charting Chart Levels Live Discord Analysis Day trading SPY options (SPDR S&P 500 ETF) can open the door to real, steady profits — even for traders starting with less than $1,000. With the right structure and discipline, hitting $100+ days isn’t a fantasy; it’s absolutely achievable. If you want deeper guidance and community support, you’re welcom
Options Explained in 60 Seconds! #shorts #daytrading #tradingforbeginners
LINK: Live Charting Chart Levels Live Discord Analysis Day trading SPY options (SPDR S&P 500 ETF) can open the door to real, steady profits — even for traders starting with less than $1,000. With the right structure and discipline, hitting $100+ days isn’t a fantasy; it’s absolutely achievable. If you want deeper guidance and community support, you’re welcom
Trading Psychology 101: CHANGE THIS IMMEDIATELY #tradingstrategy #trading #stockmarket
LINK: Live Charting Chart Levels Live Discord Analysis Day trading SPY options (SPDR S&P 500 ETF) can open the door to real, steady profits — even for traders starting with less than $1,000. With the right structure and discipline, hitting $100+ days isn’t a fantasy; it’s absolutely achievable. If you want deeper guidance and community support, you’re welcom
Understanding Support and Resistance in Trading #tradingforbeginners
LINK: Live Charting Chart Levels Live Discord Analysis Day trading SPY options (SPDR S&P 500 ETF) can open the door to real, steady profits — even for traders starting with less than $1,000. With the right structure and discipline, hitting $100+ days isn’t a fantasy; it’s absolutely achievable. If you want deeper guidance and community support, you’re welcom
Introduction to Options & Stock Market Terminology #tradingforbeginners
LINK: Live Charting Chart Levels Live Discord Analysis Day trading SPY options (SPDR S&P 500 ETF) can open the door to real, steady profits — even for traders starting with less than $1,000. With the right structure and discipline, hitting $100+ days isn’t a fantasy; it’s absolutely achievable. If you want deeper guidance and community support, you’re welcom
LINK: Live Charting Chart Levels Live Discord Analysis Day trading SPY options (SPDR S&P 500 ETF) can open the door to real, steady profits — even for traders starting with less than $1,000. With the right structure and discipline, hitting $100+ days isn’t a fantasy; it’s absolutely achievable. If you want deeper guidance and community support, you’re welcom
Beware of Alpha Futures they are trying to hide the truth #alphafutures #shorts #bailout
I’ve called them out multiple times. Then all of a sudden after sending this message my account was fixed. Then as soon as I mentioned a payout they talked about “high frequency” trading so they would be deducting over 6,000$ in realized profits due to this. Fuck yall, Ben you should be ashamed of a garbage firm you lead
The Ultimate Chart Patterns Trading Course (Expert In 1 Hour)#tradingstrategy #daytrading #bitcoin
LINK: Live Charting Chart Levels Live Discord Analysis Day trading SPY options (SPDR S&P 500 ETF) can open the door to real, steady profits — even for traders starting with less than $1,000. With the right structure and discipline, hitting $100+ days isn’t a fantasy; it’s absolutely achievable. If you want deeper guidance and community support, you’re welcom
This Indicator will help you FIND perfect entries. #tradingstrategy #daytrading #wallstreet #topstep
LINK: Live Charting Chart Levels Live Discord Analysis Day trading SPY options (SPDR S&P 500 ETF) can open the door to real, steady profits — even for traders starting with less than $1,000. With the right structure and discipline, hitting $100+ days isn’t a fantasy; it’s absolutely achievable. If you want deeper guidance and community support, you’re welcom
Options Trading for Beginners: Total Guide with Examples #trading #tradingforbeginners #forex #btc
LINK: Live Charting Chart Levels Live Discord Analysis Day trading SPY options (SPDR S&P 500 ETF) can open the door to real, steady profits — even for traders starting with less than $1,000. With the right structure and discipline, hitting $100+ days isn’t a fantasy; it’s absolutely achievable. If you want deeper guidance and community support, you’re welcom
LINK: Live Charting Chart Levels Live Discord Analysis Day trading SPY options (SPDR S&P 500 ETF) can open the door to real, steady profits — even for traders starting with less than $1,000. With the right structure and discipline, hitting $100+ days isn’t a fantasy; it’s absolutely achievable. If you want deeper guidance and community support, you’re welcom
Tried Everything… Until I Put God First✝️ 🔒#shorts #motivation #gymmotivation #runningmotivation
Join our amazing community no subscriptions. Ignore Patreon it’s for the algorithms. LINK: Live Charting Chart Levels Live Discord Analysis Day trading SPY options (SPDR S&P 500 ETF) can open the door to real, steady profits — even for traders starting with less than $1,000. With the right structure and discipline, hitting $100+ days isn’t a fantasy; it’s ab
POV: Homeless but you had to lock in 🔒 #shorts #daytrader #bitcoin #bitcoin #forex #motivation
Join our amazing community no subscriptions. Ignore Patreon it’s for the algorithms. LINK: Live Charting Chart Levels Live Discord Analysis Day trading SPY options (SPDR S&P 500 ETF) can open the door to real, steady profits — even for traders starting with less than $1,000. With the right structure and discipline, hitting $100+ days isn’t a fantasy; it’s ab
+9,000$ in 1 hour trading NQ #shorts #tradingstrategy #tjr #viral #motivation My funded futures❄️
Join our amazing community no subscriptions. Ignore Patreon it’s for the algorithms. LINK: Live Charting Chart Levels Live Discord Analysis Day trading SPY options (SPDR S&P 500 ETF) can open the door to real, steady profits — even for traders starting with less than $1,000. With the right structure and discipline, hitting $100+ days isn’t a fantasy; it’s ab
99% Will Skip & Regret – Passed MyFundedFutures in 2 Days → $5k+ Days #tradingstrategy #trading
LINK: Live Charting Chart Levels Live Discord Analysis Day trading SPY options (SPDR S&P 500 ETF) can open the door to real, steady profits — even for traders starting with less than $1,000. With the right structure and discipline, hitting $100+ days isn’t a fantasy; it’s absolutely achievable. If you want deeper guidance and community support, you’re welcom
I made 150,000 in 10 minutes across 15 accounts #daytrading #daytrading #tradingstrategy #nasdaq
Join our amazing community no subscriptions. Ignore Patreon it’s for the algorithms. LINK: / discord / nqgod Live Charting Chart Levels Live Discord Analysis Day trading SPY options (SPDR S&P 500 ETF) can open the door to real, steady profits — even for traders starting with less than $1,000. With the right structure and discipline, hitting $100+ days isn’t
My Funded Futures and Topstep banned me 🤷🏽♂️ #trading #tradingstrategy #topstep #nasdaq #shorts
Join our amazing community no subscriptions. Ignore Patreon it’s for the algorithms. LINK: Live Charting Chart Levels Live Discord Analysis Day trading SPY options (SPDR S&P 500 ETF) can open the door to real, steady profits — even for traders starting with less than $1,000. With the right structure and discipline, hitting $100+ days isn’t a fantasy; it’s ab
I made 15,000$ in 45 seconds day trading #shorts #fypシ゚viral #viral #trending #daytrading #daytrader
Join our amazing community no subscriptions. Ignore Patreon it’s for the algorithms. LINK: Live Charting Chart Levels Live Discord Analysis Day trading SPY options (SPDR S&P 500 ETF) can open the door to real, steady profits — even for traders starting with less than $1,000. With the right structure and discipline, hitting $100+ days isn’t a fantasy; it’s ab
I made 6,000 in 60 seconds using one simple strategy💥 #shorts #tradingstrategy#topstep #trending
Join our amazing community no subscriptions. Ignore Patreon it’s for the algorithms. LINK: Live Charting Chart Levels Live Discord Analysis Day trading SPY options (SPDR S&P 500 ETF) can open the door to real, steady profits — even for traders starting with less than $1,000. With the right structure and discipline, hitting $100+ days isn’t a fantasy; it’s ab
Join our amazing community no subscriptions. Ignore Patreon it’s for the algorithms. LINK: Live Charting Chart Levels Live Discord Analysis Day trading SPY options (SPDR S&P 500 ETF) can open the door to real, steady profits — even for traders starting with less than $1,000. With the right structure and discipline, hitting $100+ days isn’t a fantasy; it’s ab
Passed & Funded in 20 Minutes | The Futures Strategy They Hid From You That Most Traders Never Learn
Join our amazing community no subscriptions. Ignore Patreon it’s for the algorithms. LINK: Live Charting Chart Levels Live Discord Analysis Day trading SPY options (SPDR S&P 500 ETF) can open the door to real, steady profits — even for traders starting with less than $1,000. With the right structure and discipline, hitting $100+ days isn’t a fantasy; it’s ab
POV: Your Day Trading group is winning, Wall Street who?🤑#shorts #topstep #motivation
Join our amazing community no subscriptions. Ignore Patreon it’s for the algorithms. LINK: Live Charting Chart Levels Live Discord Analysis Day trading SPY options (SPDR S&P 500 ETF) can open the door to real, steady profits — even for traders starting with less than $1,000. With the right structure and discipline, hitting $100+ days isn’t a fantasy; it’s ab
I made 1,200$ in 45 seconds trading futures🤑 #shorts #daytrading #options #forex #foryou
Join our amazing community no subscriptions. Ignore Patreon it’s for the algorithms. LINK: Live Charting Chart Levels Live Discord Analysis Day trading SPY options (SPDR S&P 500 ETF) can open the door to real, steady profits — even for traders starting with less than $1,000. With the right structure and discipline, hitting $100+ days isn’t a fantasy; it’s ab
🔴 Pro Trader WALKS DOWN Wallsteet LIVE for 25k! #tradingstrategy
Join our amazing community no subscriptions. Ignore Patreon it’s for the algorithms. LINK: Live Charting Chart Levels Live Discord Analysis Day trading SPY options (SPDR S&P 500 ETF) can open the door to real, steady profits — even for traders starting with less than $1,000. With the right structure and discipline, hitting $100+ days isn’t a fantasy; it’s ab
Which one are you picking?🥶❄️ #shorts #daytrading #foryou #gold #diamonds #roblox #daytrades
Join our amazing community no subscriptions. Ignore Patreon it’s for the algorithms. LINK: Live Charting Chart Levels Live Discord Analysis Day trading SPY options (SPDR S&P 500 ETF) can open the door to real, steady profits — even for traders starting with less than $1,000. With the right structure and discipline, hitting $100+ days isn’t a fantasy; it’s ab
POV: You were homeless and locked in🔒 #shorts #motivation #homeless
-456 in my bank account, living in a van, homeless. Nobody cares about the story. Nobody asks how I refused to quit, how I clawed my way out. They just see the lifestyle now and assume I’ve always had it like that. But every win has a backstory—most just aren’t willing to hear it.