
Most traders buy an option, watch the stock go their way, and then stare at the screen wondering why their call barely moved — or worse, why it lost money on a green day. That confusion has a name, and it's spelled with five Greek letters.
The Greeks are not academic decoration. They are the live readout of exactly how your option will behave when price moves, when time passes, and when fear enters or leaves the market. Learn to read them and an option stops being a lottery ticket and becomes an instrument you can actually steer. At Hollow Point we don't trade what we can't measure. The Greeks are the measurement.
This is the definitive walk-through. We'll take each Greek one at a time — what it measures, the intuition, the real numbers — then show how they gang up on you near expiration, how earnings blow up in your face through IV crush, how they behave in trending versus chopping versus high-volatility markets, how they read across timeframes, and how they stack when you build spreads and combine them with the rest of your toolkit. Worked examples the whole way, with real numbers you can follow line by line. A long section on the mistakes that drain accounts. A breakdown of how professionals hold the Greeks differently than beginners do. A FAQ. And a cheat-sheet you can pin. By the end you'll look at an option chain and see the machine.
Let's get to work.
The One Idea Behind All Five
An option's price is not one number pretending to be simple. It's a bundle of separate bets that all live inside the same contract:
- A bet on direction (does the stock move, and which way)
- A bet on speed (how fast that directional exposure changes)
- A bet on time (how many days you have left)
- A bet on fear (how much the market is paying for uncertainty)
- A bet on interest rates (usually a rounding error)
Each Greek isolates one of those bets and tells you how many dollars your option gains or loses when that one thing changes and everything else holds still. That "everything else held still" part is the key — the Greeks are partial derivatives, which is a fancy way of saying "change one dial, freeze the rest, watch the price."
Real markets move every dial at once. That's why a green day can still cost you money: your delta made $40, but theta and a vega drop took $65. The Greeks let you pull that mess apart into pieces you can plan around. When you can attribute your P&L to specific Greeks — "I lost on vega, I made on delta, theta was a wash" — you stop trading on vibes and start trading on evidence. That attribution is the difference between a gambler and a risk manager.
First-order and second-order — why some Greeks feel "faster"
There's a hidden hierarchy here worth naming early. Delta, theta, vega, and rho are first-order Greeks — they measure the option's sensitivity directly to one input (price, time, volatility, rates). Gamma is a second-order Greek — it measures how another Greek (delta) changes. That's why gamma feels like it sneaks up on people: it's the rate of change of a rate of change, and second-order effects are always the ones that surprise you at the extremes.
There are deeper second-order Greeks too — vanna (how delta moves when IV moves), charm (how delta decays as time passes), vomma (how vega changes as IV changes) — and while you don't need to trade off them as a retail trader, knowing they exist explains a lot of "wait, why did that happen" moments. When an ATM option's delta drifts overnight even though price didn't move, that's charm. When IV spikes and suddenly your OTM call has more delta than you expected, that's vanna. We'll flag these where they bite, but the five core Greeks carry 95% of the load.
Three definitions before we start
So I only say them once. ITM (in-the-money) means the option has intrinsic value — a call whose strike is below the stock price, a put whose strike is above. ATM (at-the-money) means the strike sits right at the current price. OTM (out-of-the-money) means it has no intrinsic value yet, only hope and time. And remember every listed equity option controls 100 shares, so a quoted price of $2.00 costs you $200. That multiplier matters for every dollar figure below — a "$0.05 theta" is $5 a day walking out the door, and if you're holding ten contracts it's $50 a day.
One more frame: at any instant an option's price splits into intrinsic value (how deep ITM it is, which is pure and doesn't decay) and extrinsic value (time premium plus volatility premium — the "hope" portion). Almost everything the Greeks describe is a story about how that extrinsic portion is born, grows, and dies. Keep that split in your head and half the confusion evaporates.
Delta — Your Directional Speedometer
What it measures: how much the option's price changes for a $1 move in the underlying stock.
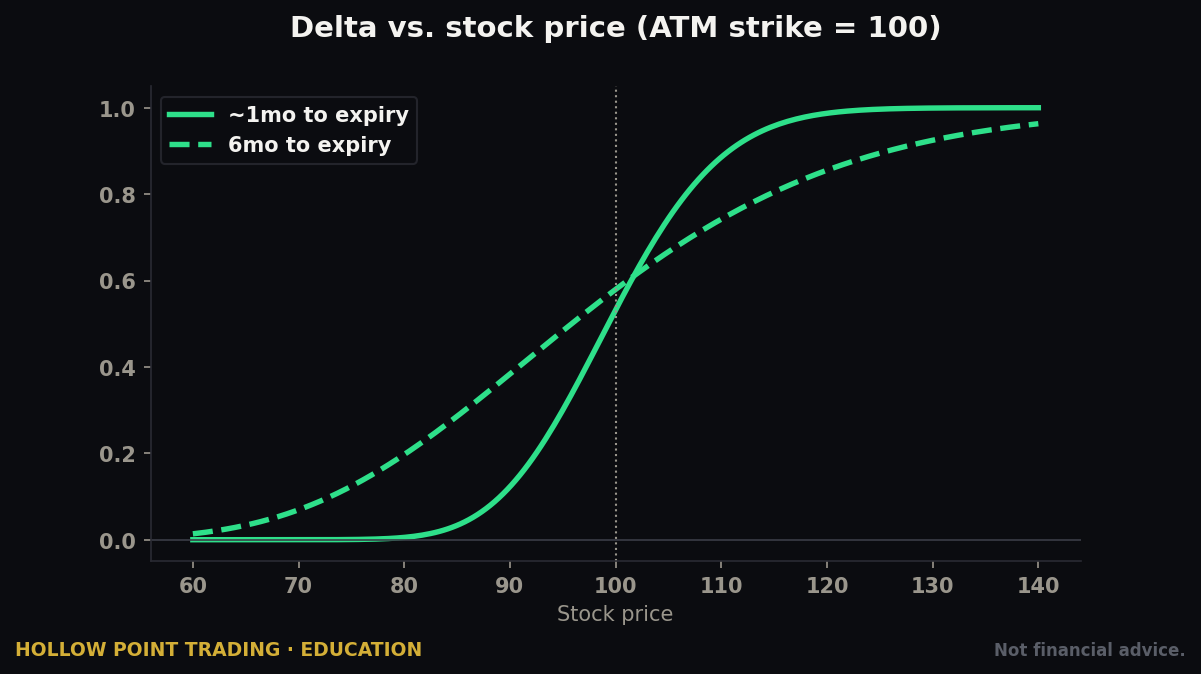
The intuition: delta is how much stock you're really holding. A call with 0.50 delta behaves — for the next dollar of movement — like owning 50 shares. That's why traders call it "delta." It's your effective share count in disguise.
Delta runs from 0 to 1.00 for calls and 0 to –1.00 for puts (puts are negative because they gain when the stock falls). People usually drop the decimal and say "30 delta" instead of 0.30.
The three things delta tells you at once
A 0.30 delta call means three things at once, and all are true:
- Price sensitivity: for every $1 the stock rises, the call gains about $0.30 — that's $30 on the contract.
- Rough probability: delta is a back-of-the-envelope estimate of the odds the option finishes ITM. A 0.30 delta ≈ ~30% chance of expiring in-the-money.
- Hedge ratio: to neutralize the directional risk of one 0.30 delta call you'd short 30 shares. This is how market makers stay flat while collecting the spread.
That second meaning is a working approximation, not gospel — it's cleanest for near-dated options and drifts from true probability the further out you go, and it ignores the small "drift" adjustment from rates and dividends — but as a gut check for "how likely is this to pay off," it's gold.
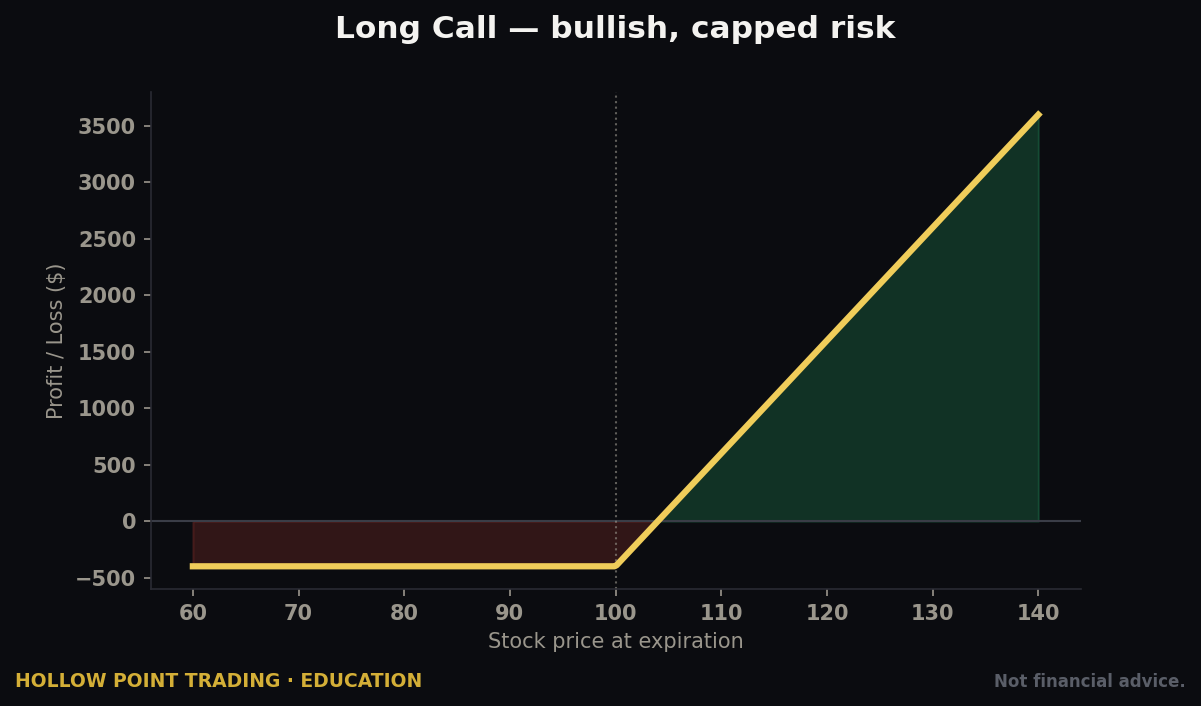
Worked example. Stock XYZ trades at $100. You buy the $100 call (ATM, so roughly 0.50 delta) for $3.00 — that's $300.
- Stock rises to $101. Your call gains ~$0.50 → now worth ~$3.50. You made $50.
- Stock rises to $102. But here's the catch: as it climbed, delta itself rose — say from 0.50 to 0.58. So the second dollar earned you more than the first. That acceleration is the next Greek.
A second worked example — the OTM lotto trap in numbers
Same stock at $100. This time you buy the $110 call, 20 days out, for $0.40 — a 0.12 delta. It looks cheap: $40 a contract, buy ten for $400.
- Stock rallies hard to $105 over three days — a huge, real 5% move. Your call's delta climbs toward ~0.25 and it might be worth ~$1.10. On ten contracts that's $1,100 on a $400 outlay. Feels like genius.
- But now play the more common tape: stock grinds to $103 over eight days and stalls. Delta barely budged, theta has been eating the position, and your $0.40 call is worth ~$0.35. You were right on direction and you're down. The delta told you up front this was a low-probability bet — you just chose to hear "cheap" instead of "12% odds."
How real traders use delta
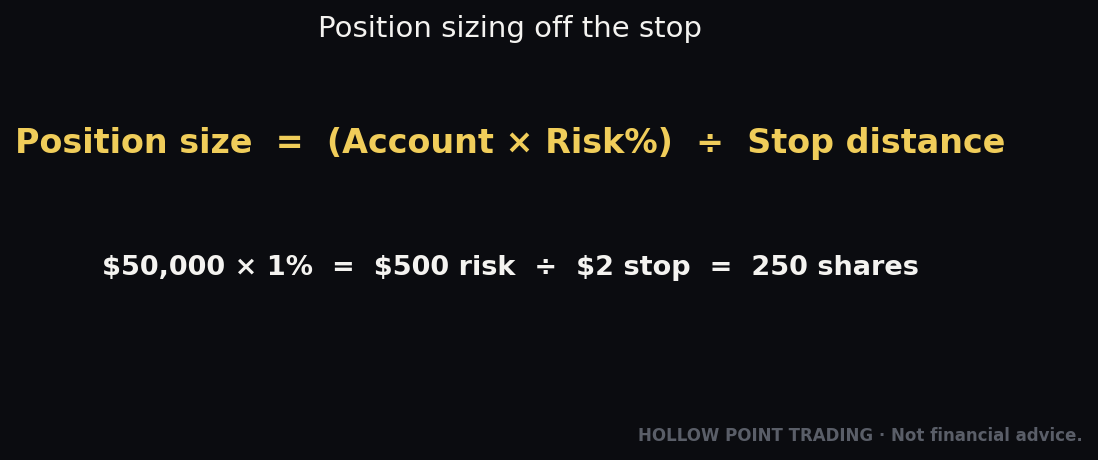
- Position sizing by exposure, not by contract count. Ten 0.20 delta calls = 200 deltas = the directional punch of 200 shares. One 0.80 delta call is nearly 80 shares. "How many contracts" is the wrong question. "How many deltas am I carrying" is the right one. When Hollow Point talks about weighting risk by conviction, this is the mechanism — you dial deltas, not contracts.
- Choosing strikes to match conviction. High conviction, want it to move dollar-for-dollar with the stock? Buy a deep ITM 0.80 delta call — it barely cares about time decay and tracks the stock closely. Cheap directional lotto with defined small risk? A 0.15 delta OTM call. You're paying for the delta you buy, and the price reflects the odds.
- Delta-neutral thinking. Sell a covered call against 100 shares (+100 deltas) and a –0.30 delta short call trims you to +70 net deltas. You've dialed down directional risk without selling stock. Scale that idea and it's how entire desks stay market-neutral.
The mistake people make
Treating a 0.15 delta OTM call as "cheap." It's cheap because it probably expires worthless — that's what 15% odds means. Cheap and likely-to-lose are the same sentence. And forgetting delta is a snapshot: it's only accurate for the very next dollar of movement, because delta is always changing. What changes it? Gamma.
Gamma — The Accelerator Behind Delta
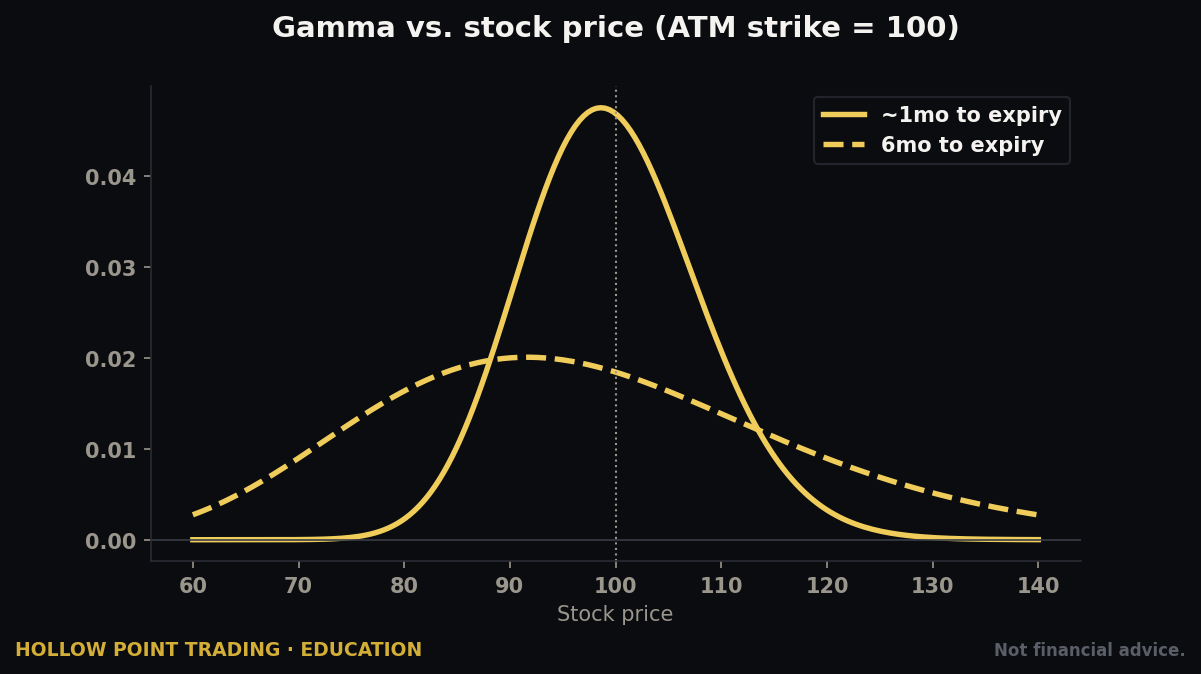
What it measures: how much delta changes for a $1 move in the stock. Gamma is the delta of your delta — the rate of change of the speedometer itself.
The intuition: delta tells you your current speed; gamma tells you how hard you're accelerating. High gamma means your directional exposure shifts fast as the stock moves — great when you're right, brutal when you're wrong, because the position turns against you faster and faster.
Where gamma lives
It's highest at-the-money and highest close to expiration. An ATM option on expiration day has explosive gamma — its delta can rip from 0.50 to 0.90 or collapse to 0.10 on a small move, because the option is deciding, right now, whether it's worth something or nothing. Deep ITM and far OTM options have low gamma; their fate is more settled, so their delta is stable.
Worked example. Back to XYZ at $100, your $100 call at 0.50 delta, gamma of 0.05.
- Stock → $101: new delta ≈ 0.50 + 0.05 = 0.55.
- Stock → $102: delta ≈ 0.55 + 0.05 = 0.60 (roughly — gamma shifts too, but this is the mechanism).
- Stock → $103: delta ≈ 0.65.
Notice the profit curve steepening. From $100→$101 you made ~$50. From $102→$103 you make ~$63, because you're now holding 63 effective shares instead of 50. Long options have positive gamma — your winners accelerate and your losers decelerate. That convexity is the whole reason people pay for options. When you're long gamma, being wrong slows your bleed (delta shrinks toward zero as it goes against you) and being right speeds your gains. You are structurally leaning into the move.
Now flip it — being short gamma
Sell that call instead of buying it and you are short gamma. As the stock rises against you, your negative delta grows — you lose faster the further it goes. Short gamma is picking up nickels in front of a steamroller: fine on quiet days, catastrophic on a gap. Every option seller is short gamma, and that is the risk they're being paid to carry.
Here's the short-gamma pain in numbers. You sold that $100 call, so you're –0.50 delta, gamma –0.05.
- Stock gaps to $103 overnight on news. Your delta didn't glide from –0.50 to –0.65 through the intervening prices where you might have hedged — it jumped. You're now effectively short ~63 shares at a price $3 higher, having had no chance to adjust. That gap is exactly where short-gamma accounts blow up: the losses are non-linear and they arrive all at once.
The dealer-gamma dimension — why "gamma walls" move markets
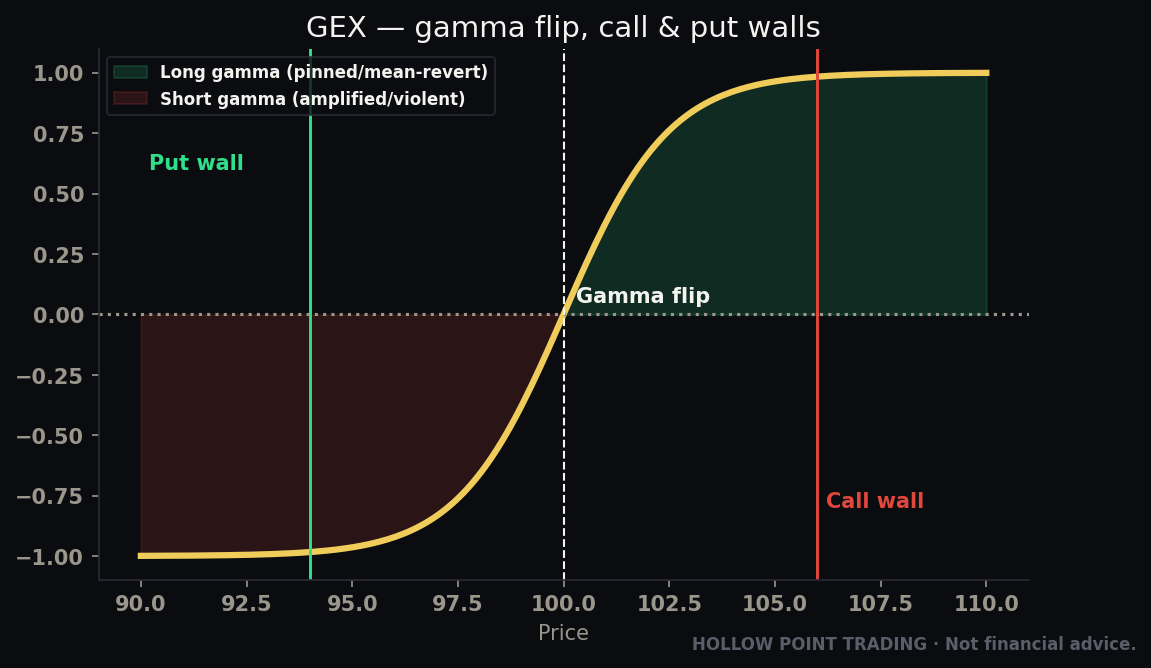
There's a market-structure layer here that Hollow Point traders live by. The dealers and market makers who sit on the other side of retail's option flow have to hedge their gamma, and how they hedge depends on whether they're net long or short gamma at a given price.
- When dealers are long gamma, they hedge by selling into rallies and buying into dips — this dampens volatility and creates the "pinning" you see around big open-interest strikes near expiration.
- When dealers are short gamma, they hedge by buying into rallies and selling into dips — this amplifies moves and is why some down-days accelerate into air.
The price where dealer positioning flips is the gamma flip level, and the big strikes are call walls (resistance/magnets above) and put walls (support below). This is why a GEX terminal earns its place next to the chart: gamma isn't just a property of your option, it's a force on the tape itself.
How real traders use gamma
- Buyers want gamma when they expect a fast, large move — a breakout, a catalyst — because gamma is what makes a directional bet pay off convexly instead of linearly.
- Sellers respect gamma as their blow-up risk. The premium you collect selling options is compensation for being short gamma. Size for it or it eventually finds you.
- Read the dealer gamma map before you trade the level. A breakout into a big call wall in a long-gamma regime often stalls and pins; the same breakout in a short-gamma regime can go vertical. Same chart pattern, opposite outcome, and gamma positioning is the tell.
The mistake people make
Buying short-dated ATM options for the cheap premium without respecting that the same high gamma cuts both ways. It giveth on the right move and taketh viciously on the wrong one — plus those options bleed time value fastest of anything on the board. Which brings us to the tax you pay for holding all this.
Theta — The Rent You Pay to Hold Time
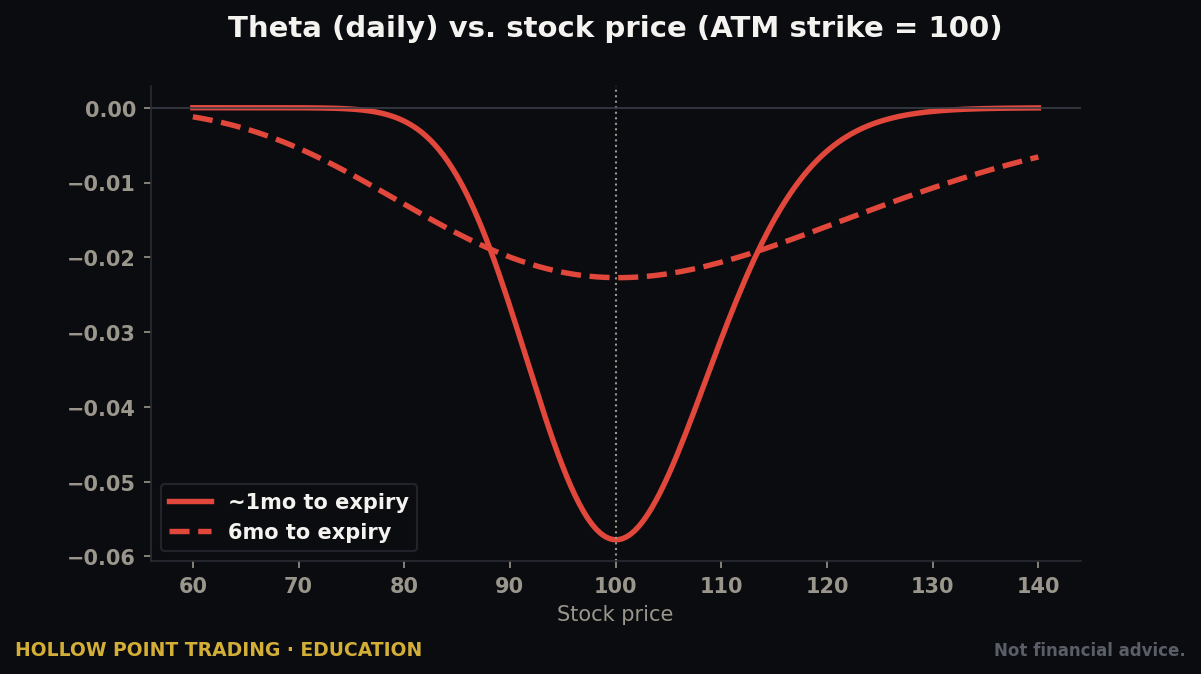
What it measures: how much value the option loses for each day that passes, holding everything else constant. Theta is almost always quoted as a negative number for buyers — it's what you bleed just from the calendar flipping.
The intuition: an option is a wasting asset. Part of its price is intrinsic value (real, ITM value) and part is extrinsic value — time and volatility premium, the "hope" portion. Theta is the daily erosion of that extrinsic hope. Every morning you wake up, some of it is gone whether the stock moved or not.
The numbers. A theta of –0.05 means the option loses about $5 per contract per day, all else equal. But theta is not constant — and how it behaves depends entirely on whether the option is at-the-money.
The single most important theta fact
ATM options decay fastest into expiration, and that decay accelerates as expiry approaches. The classic picture is a curve that slopes gently for a far-dated option and then falls off a cliff in the final couple of weeks. An ATM option loses time value roughly in proportion to the square root of time remaining — meaning the last 10 days shed value far faster per day than the 10 days before them. A 60-day option isn't losing twice what a 30-day option loses — the relationship is curved, and the curve steepens right when most retail traders are hoping their weekly "still has time to work."
Worked example. XYZ at $100, the $100 ATM call, 30 days out, worth $3.00 (all extrinsic — it's ATM, so zero intrinsic).
- With ~30 days left, theta might be –$0.05/day. Sit for a week with the stock pinned at $100 and you lose ~$0.35 → call now ~$2.65.
- With ~5 days left, that same ATM call's theta might be –$0.15/day and climbing. The final days torch value three times faster than the early ones.
- On expiration morning, an ATM option is almost pure theta — it either converts to intrinsic value on a move or evaporates to zero by the close.
The weekend theta detail beginners miss
Theta doesn't take Saturdays off. Options price in calendar days, not trading days, so the decay for the weekend is largely priced out on Friday afternoon. This is why a Monday-morning option often opens looking "cheaper" than Friday's close even with the stock flat — you paid the weekend's rent on Friday. Short-premium sellers love carrying positions over a weekend for exactly this reason: three days of decay, zero trading-hours gamma risk (until the Monday open, anyway). Long-premium buyers holding a weekly over the weekend are handing that same rent away.
Contrast with a deep ITM option
A 0.90 delta ITM call is mostly intrinsic value, which doesn't decay — only its thin extrinsic sliver bleeds. That's why ITM options are the tool when you want direction without paying a heavy time-decay tax. If your thesis is "this stock is going up over the next month," a 0.80–0.90 delta ITM call gives you most of the stock's move with far less theta drag than an ATM weekly, at the cost of more capital up front. That trade-off — capital for time-safety — is one you should make on purpose every time.
How real traders use theta
- Sellers harvest theta. Selling premium — credit spreads, iron condors, covered calls — puts theta on your side of the table. You wake up richer if nothing happens. But remember: positive theta comes bundled with negative gamma. You are always paid to take one risk in exchange for the other. There's no free lunch — collecting theta means you're short the fast move.
- Buyers fight theta. If you're long options, time is your enemy and you need to be right soon. Buying a weekly and "giving it time to work" is a contradiction — the weekly's theta is eating you alive while you wait.
- Match your holding period to the decay curve. Swing traders lean toward 30–60 DTE where daily theta is gentler and the decay curve is still flat-ish. Same-day scalpers accept vicious theta because they're in and out before the day's decay lands. The cardinal sin is holding a short-dated option over a medium-term horizon — you get the worst of both worlds.
The mistake people make
Buying near-dated OTM options and holding them for days hoping for a move. You've stacked the two worst decay properties — high theta and low delta — and the clock beats you even when you're eventually right about direction. Discipline means buying enough time, or not buying the option at all.
Vega — Your Exposure to Fear
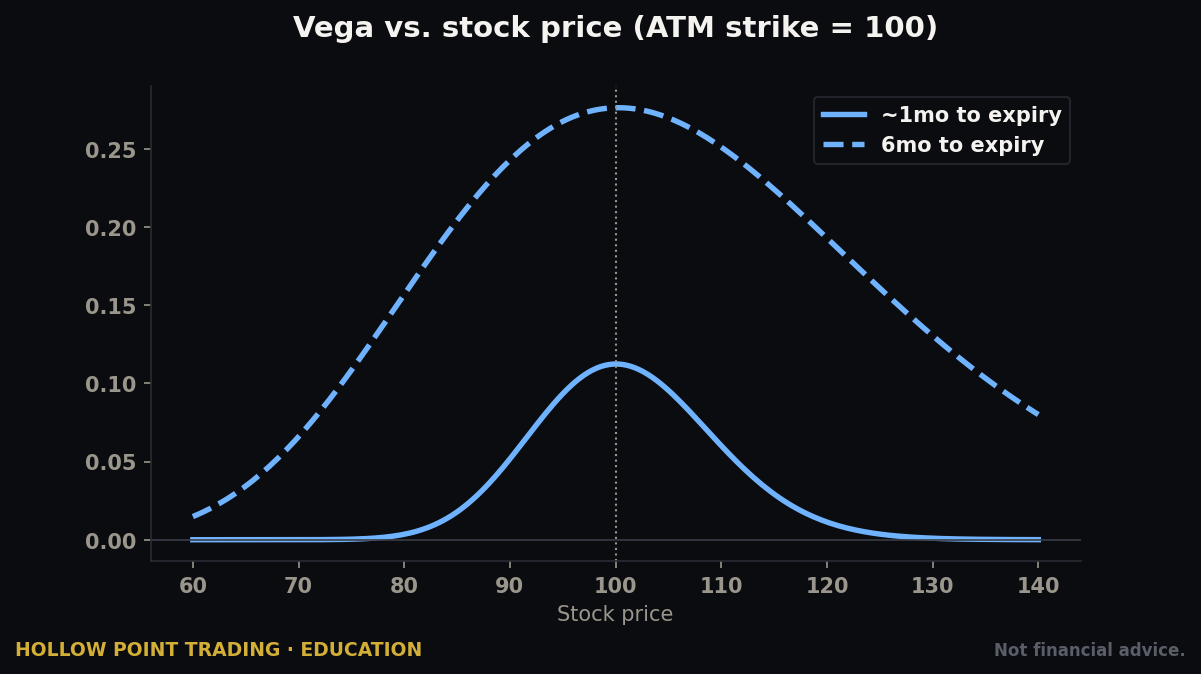
What it measures: how much the option's price changes for a 1-point move in implied volatility (IV). Vega isn't a real Greek letter, but it earns its seat because it's often the difference between a good trade and a blindside.
Define it once: implied volatility is the market's forward-looking guess at how much the stock will move, backed out of the option's price. High IV = options are expensive because the market expects big swings (fear, uncertainty, upcoming events). Low IV = cheap, calm, complacent. IV is quoted as an annualized percentage. Vega measures your sensitivity to it changing.
The numbers. A vega of 0.10 means for every 1-point rise in IV (say from 30% to 31%), the option gains ~$0.10 → $10 per contract. If IV drops a point, you lose that $10. Long options are long vega — you profit when fear rises. Short options are short vega — you profit when fear drains out.
Where vega lives
Vega is largest for at-the-money options and for longer-dated options. A LEAPS (year-plus) contract is dominated by vega — a shift in IV moves it far more than a day of theta does. A 0DTE option has almost no vega left; there's no future time for volatility to act on. This is the mirror image of theta and gamma, which dominate the short end. Far-dated and high-IV = vega's kingdom. Short-dated = gamma and theta's kingdom.
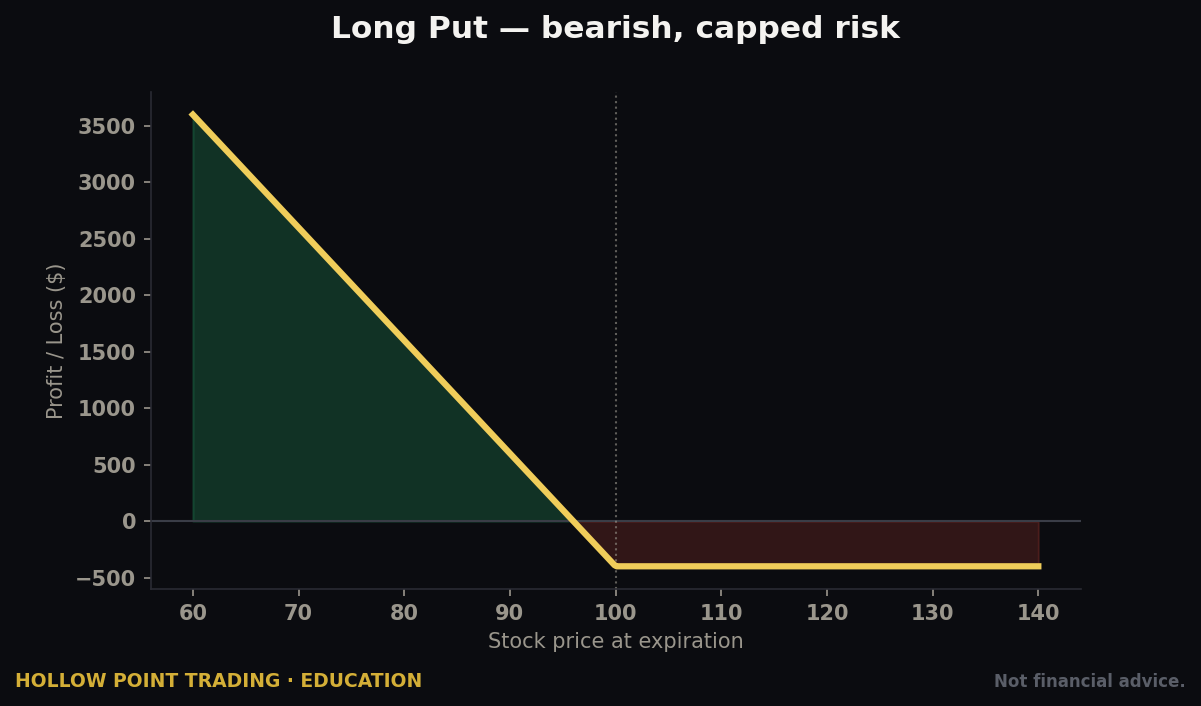
Worked example. XYZ at $100, you buy the $100 call 45 days out for $3.00 with IV at 30% and vega of 0.12.
- News stress hits, IV jumps to 40% (+10 points). Even with the stock still sitting at $100, your call gains 10 × $0.12 = $1.20 → now worth $4.20. You made $120 and the stock never moved. That's pure vega.
- The reverse is the trap. Buy when IV is at 40% and it settles back to 30%, and you lose that $120 even if the stock drifts your way. You were right on direction and wrong on fear — and fear was the bigger position.
IV rank vs IV percentile — the two numbers to check before every buy
"IV is 40%" is meaningless on its own — 40% is cheap for a biotech and expensive for a utility. You need context, and there are two standard context tools:
- IV Rank answers: where is current IV between its 52-week low and high? If IV ranged 20%–60% this year and sits at 40%, IV Rank = 50%. It's a simple linear placement.
- IV Percentile answers: what fraction of the last year's days had IV below today's level? If IV was lower than today on 80% of days, IV Percentile = 80%. It's more robust to a single spike skewing the range.
Rule of thumb: buy premium when IV Rank is low (roughly under 30), sell premium when it's high (roughly over 50). A great directional idea at a terrible IV level is a losing trade. This single check would save more retail accounts than any indicator on a chart.
The volatility skew and term structure
Two more textures worth knowing. Skew is the fact that different strikes carry different IV — in equity indices, downside puts almost always carry higher IV than upside calls because people pay up for crash protection. That's why your OTM put "feels expensive" relative to the equidistant call; it is, and the skew is telling you where the market's fear lives.
Term structure is IV across expirations. Normally it slopes up (further-out options carry higher IV) — that's contango. When near-term IV spikes above far-term IV — backwardation — the market is pricing acute near-term stress (an event, a crash scare). A calendar spread is literally a bet on term structure, and reading whether the front month is bid relative to the back tells you whether the market is panicking now or worried later.
How real traders use vega
- Buy options when IV is low, sell when IV is high. You want to own cheap volatility and sell expensive volatility. Check IV Rank before you buy, every time.
- Long-dated plays are volatility plays whether you meant them to be or not. If you buy LEAPS calls, understand you've taken a big long-vega position. A market-wide volatility collapse can dent you even in an uptrend.
- Track the index vol gauge. For equity and index traders, the VIX is the market's aggregate vega weather report. Buying calls into a falling VIX is swimming with the vega current; buying them into a VIX you expect to keep falling means your vega is a headwind even when your delta is a tailwind.
The mistake people make
Buying options right before earnings because "a big move is coming" — without checking that IV has already ballooned to price that move in. You buy inflated premium, the move happens, and you still lose. That specific trap has a name.
IV Crush and the Earnings Trap
Before a known event — earnings, an FDA decision, a Fed meeting — implied volatility ramps up. The market knows a move is coming, so it bids up option premium to price the uncertainty. IV can climb for days into the print.
The instant the news drops, that uncertainty is gone. The event is known. IV collapses — often violently, 30, 40, 50 points in a heartbeat. This is IV crush, and it's the single most common way retail traders get gutted on earnings.
Worked example. ABC trades $100 the day before earnings. The ATM $100 call, 2 days out, costs $5.00 — because IV is jacked to 80% pricing an expected ~5% move. Vega is 0.06.
The stock reports and jumps 4% to $104. You were right. But:
- Your intrinsic value is now $4.00 (the $100 call with stock at $104).
- IV crushes from 80% to 35% — a 45-point drop. Vega hit: 45 × $0.06 = $2.70 of premium gone.
- Your $5.00 call is now worth roughly $4.10 — barely above what you paid. You called the direction and the size and made almost nothing.
And if the stock had moved only 2%? You'd be sitting on a $2-ish call, down 60%, on a day the stock went your way. The expected move was already baked into that $5.00 price. To profit buying premium into earnings, the stock has to move more than the market already paid for — a high bar, working against a vega headwind.
How to read the expected move before you trade earnings
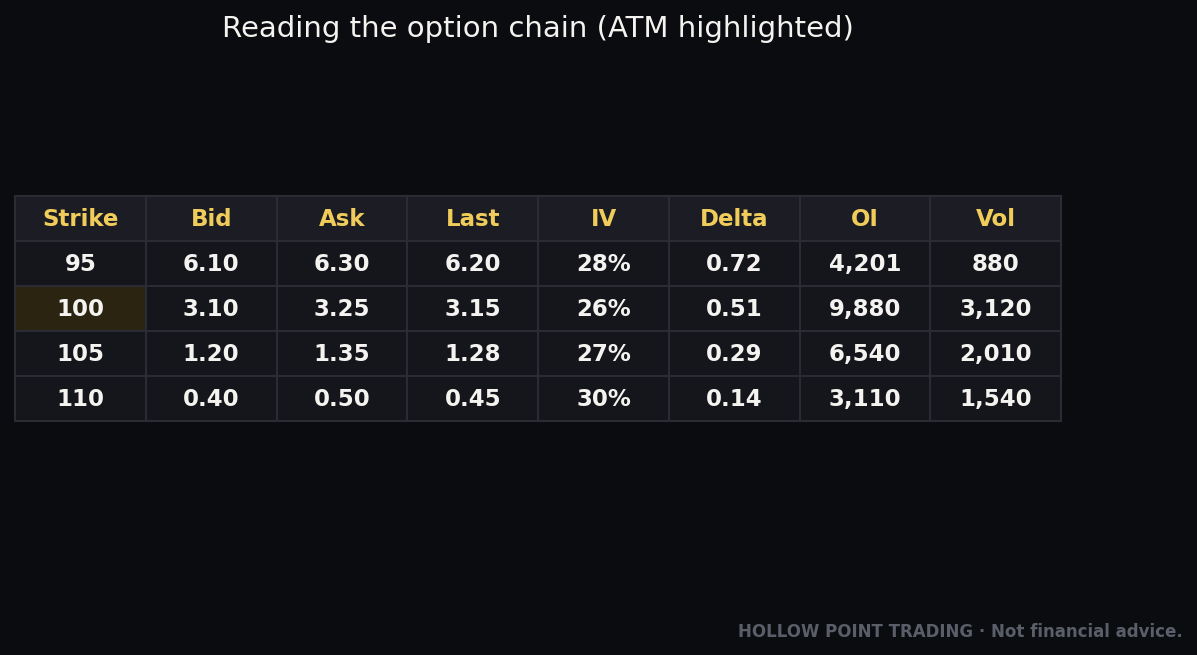
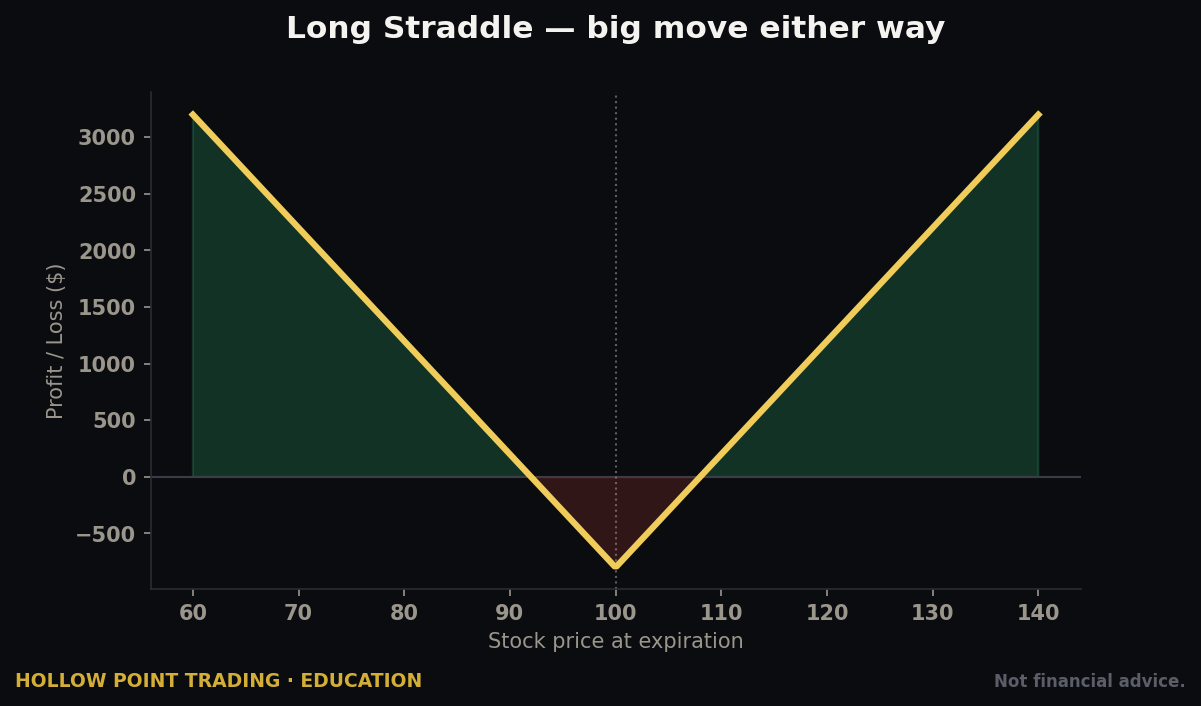
You don't have to guess how much is priced in — the option chain tells you. The quick approximation: the price of the ATM straddle (ATM call + ATM put) for the expiration just after the event ≈ the market's expected move in dollars by that expiration. ABC's $100 call at $5.00 plus its $100 put at ~$4.80 = a ~$9.80 straddle, so the market is pricing roughly a ±$9–10 (≈9–10%) move. If your thesis isn't "it moves more than that," you have no business buying that straddle or either leg naked. This one calculation reframes every earnings trade from "which way" to "more or less than what's priced."
How disciplined traders handle earnings
- Sell the inflated premium instead of buying it, with defined risk — iron condors, credit spreads — so IV crush works for you. You're short vega into the event; the crush is your profit engine. But you're also short gamma into a potential gap, so size small and define the risk with long wings.
- If you must be long, buy further out in time where a single event's IV crush is a smaller fraction of the option's value, or use a spread that partially neutralizes vega — a diagonal or vertical rather than a naked long.
- Or simply stand aside. "Not trading the earnings binary" is a position. Bound by rules.
The 0DTE Gamma-Theta Knife-Fight
Zero-days-to-expiration options — contracts that expire the same day — are where the Greeks turn feral. Two forces are at war, and understanding the fight is the whole game.
On the final day, an ATM option is almost pure extrinsic value with hours to live. That means:
- Theta is savage. The entire remaining time value has to decay to zero by the close. Hold an ATM 0DTE that isn't moving and it melts in front of you, dollar by dollar, all day. On the final day theta stops being a smooth daily number and becomes an hourly — even a per-minute — bleed.
- Gamma is explosive. Delta whipsaws from 0.50 toward 1.00 or toward 0 on tiny moves, because the option is deciding this instant whether it finishes ITM or worthless. A 0.20% move in the underlying can double or halve your option.
So the 0DTE buyer lives in a knife-fight: gamma can hand you a triple in twenty minutes, while theta guarantees you go to zero if you're wrong or even if you're just early. There's no middle ground and no waiting it out — the position resolves to intrinsic-or-zero by the bell.
Worked feel for it. SPX-style index at 5000, the 5000 call expiring today, two hours left, trading $4.00 (pure extrinsic). Gamma is enormous.
- Index ticks up 0.3% to ~5015. That call might rip to $16 — a near-quadruple — as delta rockets toward 1.0.
- Index instead drifts flat or fades. Theta and the collapsing gamma drain it toward $1, then zero, in the same two hours.
The three ways 0DTE actually kills accounts
- Holding through chop. You buy the move, it stalls, you hold "to get back to breakeven," and theta strip-mines you to zero by the close. The instrument does not forgive patience.
- Selling naked into a trend day. You sold the 0DTE call for "easy theta," the index grinds one direction all afternoon, and your short gamma turns a $50 credit into a $600 loss with no natural stop.
- Chasing after the move already happened. You buy once the option is already up 200% — now you're long an option that's mostly delta with the gamma pop behind it, and any pullback craters it.
Who trades 0DTE well: disciplined scalpers with hard stops, small size, and a fast finger — in and out on the move, never marrying the position. Sellers of 0DTE are harvesting that brutal theta, but they're short the vicious gamma, so a single fast move can hand back a week of premium in minutes. This is not a hold-and-hope instrument on either side. It's the purest expression of the gamma-vs-theta trade-off in the market, and it demands the most discipline of anything retail can touch.
Rho — The Greek You Can Mostly Ignore (Until You Can't)
What it measures: how much the option's price changes for a 1% change in interest rates.
The intuition: owning a call is a leveraged, lower-capital substitute for owning the stock — you've effectively deferred paying for the shares, and higher rates make that deferral more valuable. So higher rates nudge calls up and puts down, slightly.
The numbers. A rho of 0.05 means a 1% rate change moves the option ~$0.05. For most short-dated retail trades this is a rounding error swamped by delta, theta, and vega. Rates don't move 1% in a day.
When rho actually matters: long-dated options — LEAPS. A year-plus contract carries meaningful rho, and in a regime where rates swing (as they have in recent years), the cost of carry embedded in long-dated calls and puts genuinely shifts their pricing. There's a related quiet cost too: dividends. Big upcoming dividends push call prices down and put prices up, and they're the usual reason a deep-ITM American call gets assigned early (someone exercises to capture the dividend). If you trade LEAPS or short ITM calls across an ex-dividend date, keep half an eye on both rho and the dividend calendar. For a weekly scalp, forget rho exists. That honest ranking — knowing which Greek to watch and which to ignore for the trade in front of you — is itself part of the edge.
The Greeks Across Market Regimes
The same option behaves like a different animal depending on the weather. Reading the regime first, then the Greeks, is what separates traders who "know the definitions" from traders who make money.
Trending markets — delta and gamma are your friends
In a clean trend, directional exposure pays and it pays convexly. This is the environment where being long gamma shines: your delta grows in your favor as the trend extends, so a modest starting position becomes a large one exactly when you want it to. Buyers of slightly-OTM calls (0.35–0.45 delta) in an uptrend with low or falling IV have the wind at their back on delta, gamma, and vega all at once — the dream setup. The danger in a trend is complacency about theta on the inevitable consolidation days; a trend that pauses for a week can still bleed a weekly to death.
Chop / range-bound markets — theta is king, gamma is the enemy for buyers
Sideways tape is where option buyers go to die and sellers feast. There's no sustained delta move to capture, so every day you hold a long option, theta wins and nothing offsets it. This is the regime for premium selling — iron condors, credit spreads, covered calls — where you're net short gamma and long theta, and the market's refusal to move is precisely your edge. The catch: chop ends without warning, and the day it does, your short gamma bites. Sellers in a range must respect their stops and their strike distance because the regime change is the risk.
High-volatility markets — vega dominates and everything is amplified
When IV is elevated (post-crash, mid-crisis, deep in an event cycle), vega becomes the biggest number on your ticket, and IV mean-reverts hard. Buying options here means paying up for volatility that is statistically likely to fall — a vega headwind that can overwhelm a correct delta call. This is the regime where premium selling has the fattest edge (high IV Rank = expensive options to sell) but also the fattest tail risk (high vol means big gaps, and you're short gamma). Position size in high-vol regimes should shrink, not grow, even though the premiums are tempting. The pros' rule: size down when vol is up. The dollar swings per contract are larger, so fewer contracts hold your risk constant.
The regime-shift edge case: vol-of-vol
The nastiest trap is the transition itself. A quiet low-IV grind (buyers frustrated, sellers comfortable) can flip to a high-IV crash in a single session. If you were short premium and short gamma into that flip, you eat the gamma loss and the vega loss simultaneously — the two combine, they don't offset. This is why blowups cluster: the same positioning that prints money for months in a calm regime is the positioning that detonates on the regime change. Reading IV Rank and the dealer gamma map is your early-warning system for when the regime is stretched.
The Greeks Across Timeframes
Hollow Point runs the full ladder on charts for a reason, and options carry the same multi-timeframe logic — but the "timeframe" for an option is its days-to-expiration, and it changes which Greek is driving.
- 0–2 DTE (scalp): gamma and theta own the trade. Vega is nearly dead, rho is irrelevant. You are trading pure speed vs. pure decay. Match this to intraday chart signals only.
- 1–2 weeks (short swing): gamma still matters, theta is meaningful and accelerating, vega is a real factor into any event. Match this to daily-chart structure.
- 30–60 DTE (swing): the sweet spot for most directional buyers — theta is still gentle, delta is clean, vega is present but not overwhelming. Match this to daily/weekly structure and the trend.
- 90+ DTE / LEAPS (position): vega and rho dominate, theta is a slow drip. You are effectively taking a leveraged, volatility-sensitive stock position. Match this to weekly/monthly structure and macro.
The discipline: align the option's DTE with the chart timeframe your thesis lives on. A daily-chart breakout thesis expressed in a 0DTE option is a timeframe mismatch — the option can expire worthless before the daily thesis has time to play out. This is the single most common structural error in retail options: right chart, wrong expiration.
Position Greeks — Reading Spreads Like One Machine
Everything above is for a single option. The real power comes when you realize Greeks add up across a position. Every leg contributes its Greeks, longs positive and shorts flipped, and the net is what you actually carry. This is how you engineer a trade to have the exposures you want and cancel the ones you don't.
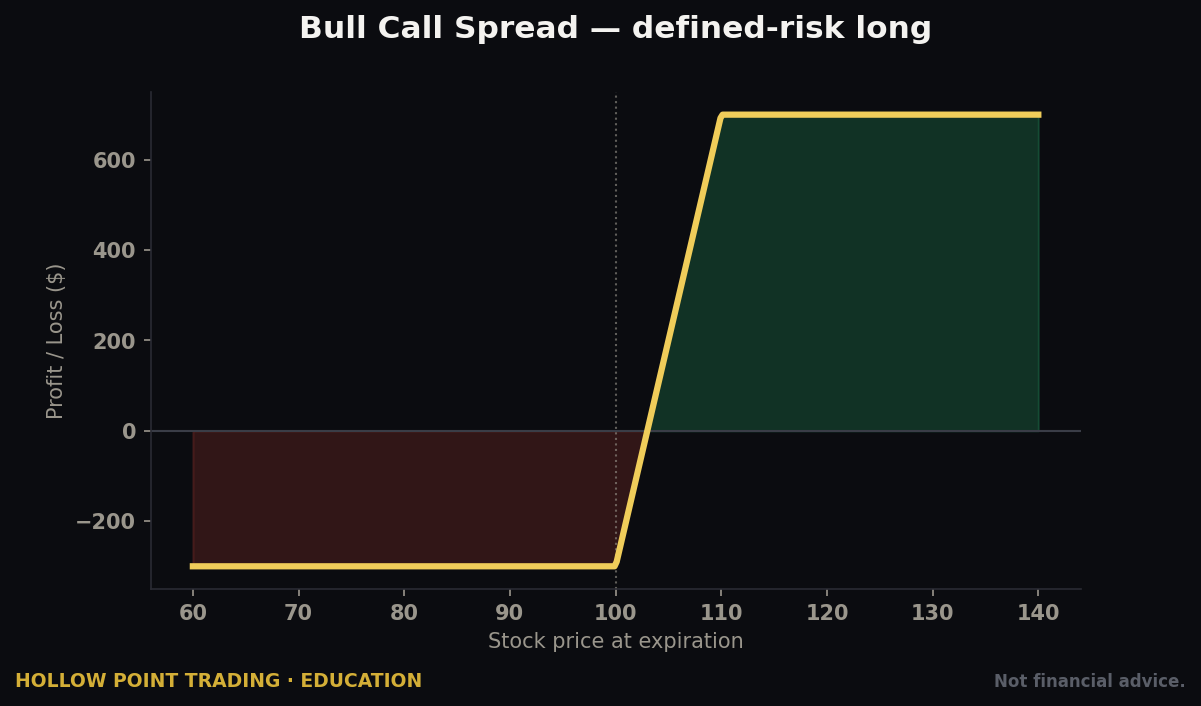
Worked example — a bull call (debit) spread. XYZ at $100. You:
- Buy the $100 call: delta +0.50, theta –$0.05, vega +0.12
- Sell the $105 call: delta 0.35 → flips to –0.35 because you're short, theta +$0.04, vega –0.09
Net position Greeks:
- Net delta: +0.15 — still bullish, but far less directional exposure than the naked call. You've capped your upside at $105 in exchange for a cheaper, tamer position.
- Net theta: –$0.01 — the short call's positive theta nearly cancels the long call's decay. Time barely hurts you now. That's the point of a spread.
- Net vega: +0.03 — you've slashed volatility exposure to almost nothing. IV crush can't gut this the way it'd gut the naked call. This is why spreads are the disciplined way to trade earnings.
Look at what happened: by adding a short leg you converted a high-theta, high-vega directional bet into a cheaper position that mostly cares about direction between two strikes and shrugs off time and volatility. That's not luck — you chose those net Greeks by picking the legs.
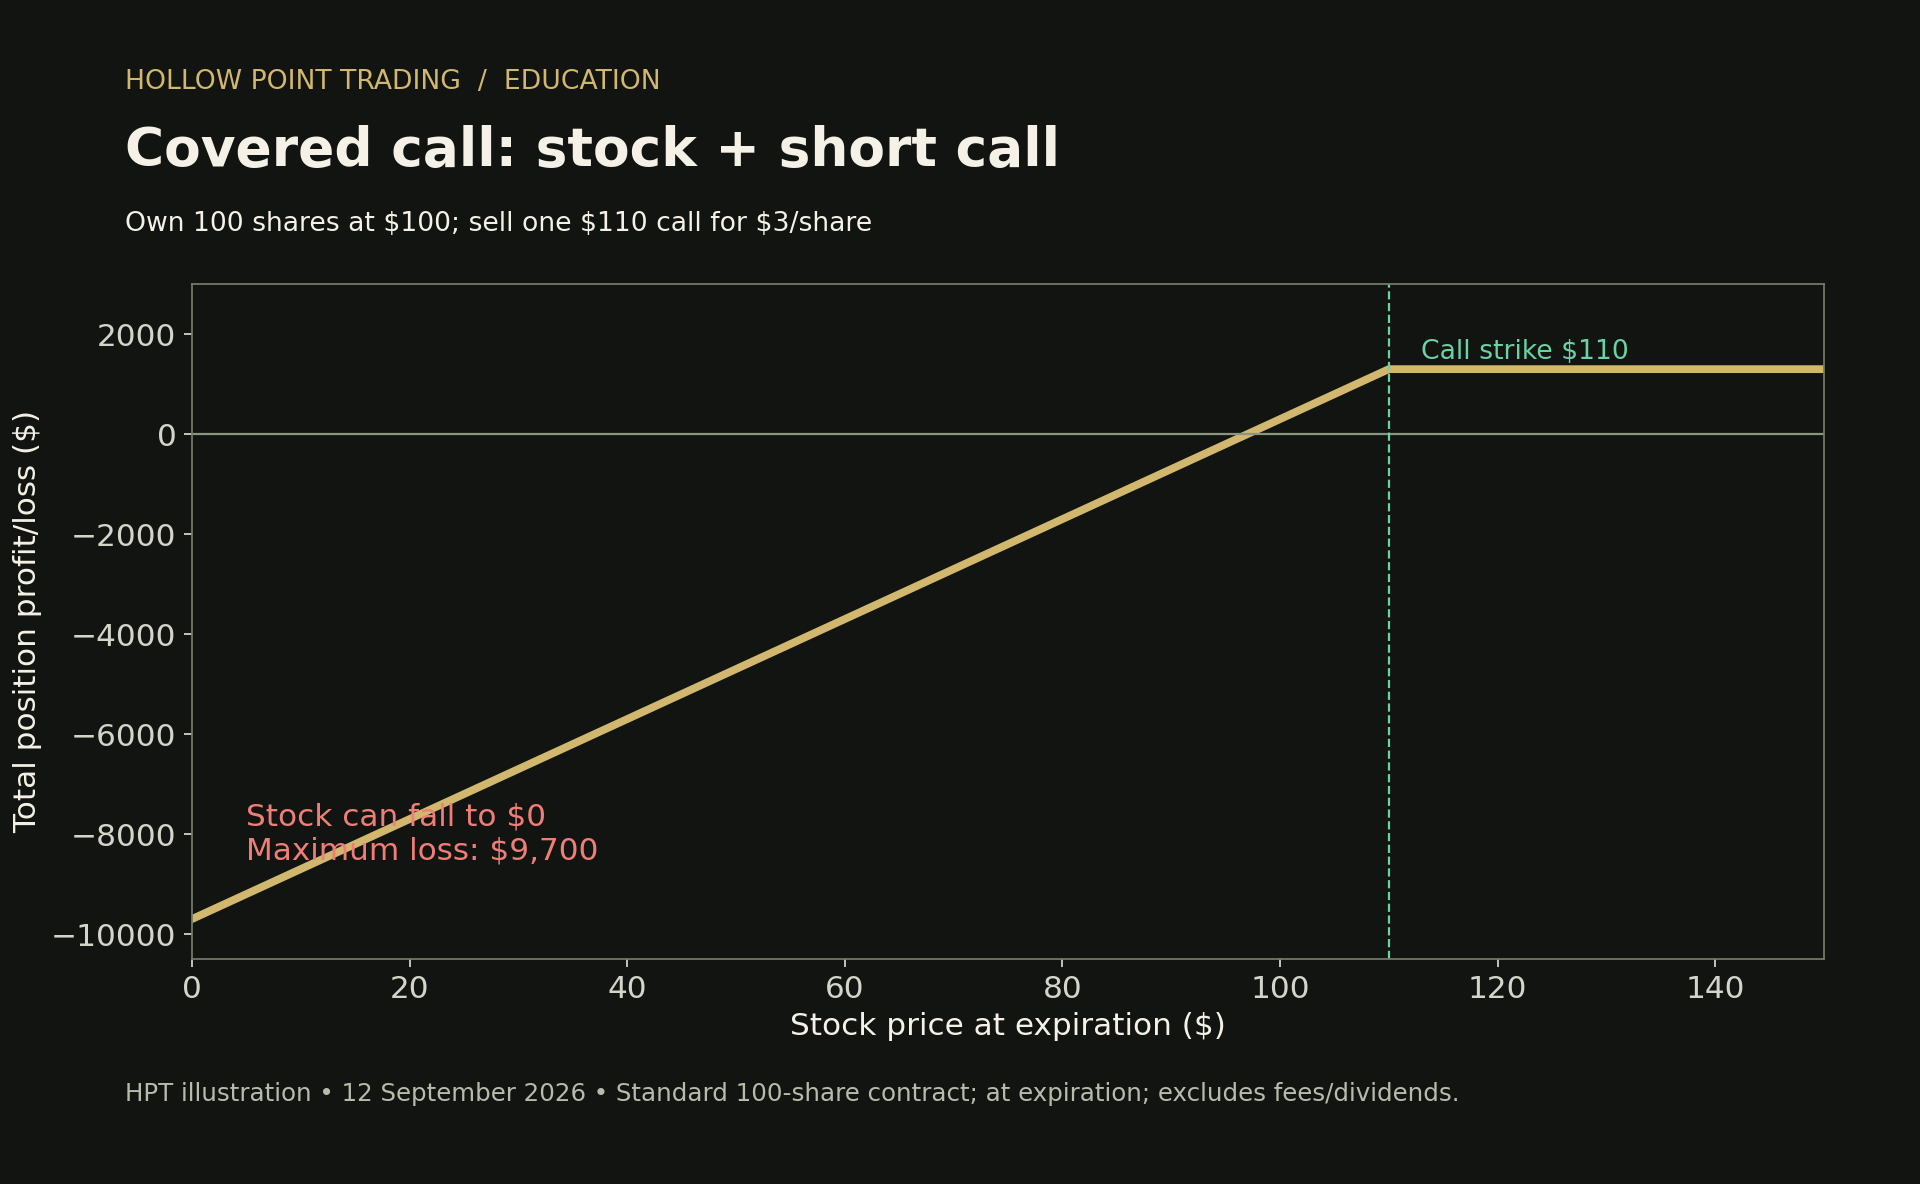
Credit spreads flip the signs. Sell the $95 put / buy the $90 put under a stock at $100 and you're net positive delta (bullish), net positive theta (time pays you), and net short vega (falling IV helps you). You've built a position that profits from the stock holding up, time passing, and fear draining — three tailwinds — with defined risk from the long wing. That's a thesis expressed in Greeks.
The iron condor — a pure vega/theta machine
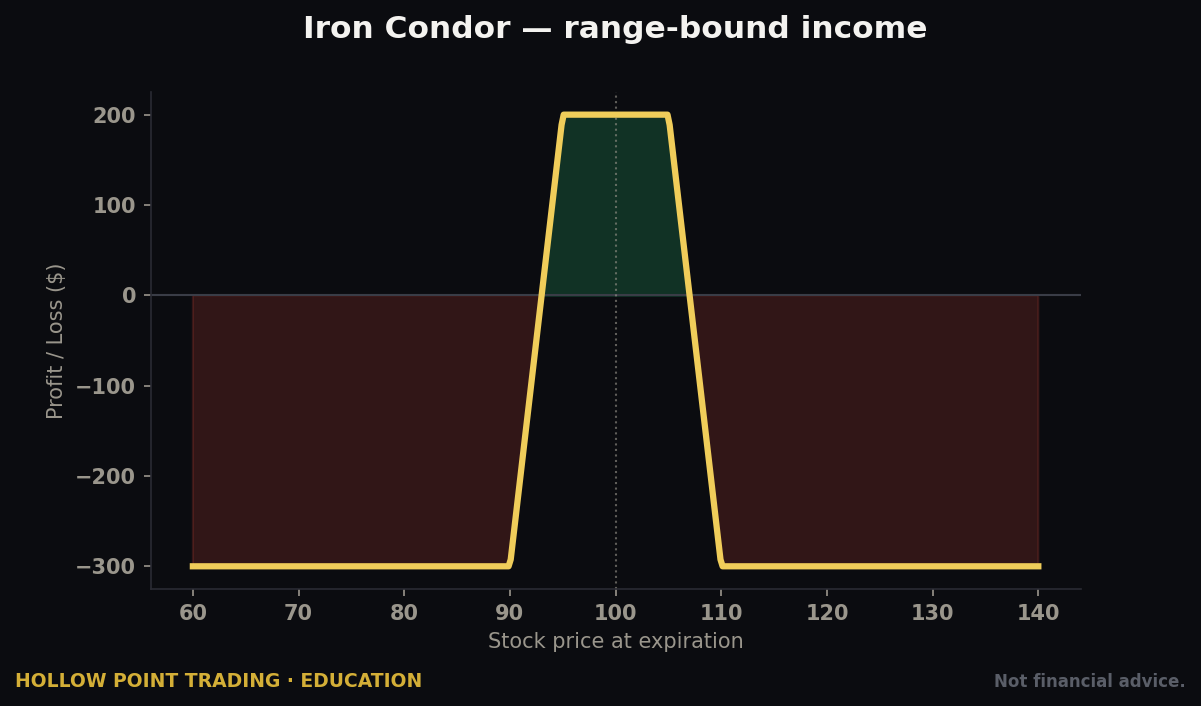
Stack a call credit spread above and a put credit spread below a range-bound stock and you get an iron condor: net delta near zero, net theta strongly positive, net vega negative. You're saying "the stock stays in this box, time passes, and IV falls." It's the canonical chop-regime, high-IV-Rank trade — and its risk is exactly the regime-shift scenario above, where a breakout turns your short gamma against you on both the delta and vega dimensions at once.
How pros use position Greeks
They don't think in "I bought a spread." They think "I'm carrying +150 net deltas, +$40 daily theta, and I'm short $200 of vega across the book." The Greeks let you see your entire portfolio as one position and know precisely what market conditions make you money and which ones hurt — then hedge the exposures you didn't mean to take. If the book is accidentally +600 deltas because five separate bullish trades stacked up, one index put or a few short shares brings it back to the risk you actually intended. That top-down, weighted view of risk is exactly the HPT approach applied to options: know your exposure before the market tells you.
Combining the Greeks With the Rest of the Toolkit — Confluence
The Greeks tell you how your instrument behaves. The chart tells you what price is likely to do. Neither is complete alone. Here's how they braid together into a real trade.
Confluence 1: Greeks + the EMA trend framework (12/22/55)
Hollow Point's trend read leans on the 12/22/55 EMA stack, with the daily 55 as the bias tell. Use that to choose your delta and DTE, not just your direction:
- Price above a rising daily 55-EMA with the 12/22 stacked bullish = clean uptrend = justify a higher-delta, longer-DTED call (0.60 delta, 45 DTE) because the trend gives your delta time and room to work.
- Price chopping around a flat 55-EMA = no trend = don't buy premium at all; sell it or stand aside. The EMA read is telling you the regime, and the regime tells you whether to be long or short vega/theta.
A directional option bought against the daily 55-EMA bias is fighting both the chart and, usually, the odds baked into its own delta.
Confluence 2: Greeks + Fibonacci golden pocket
When price pulls back into the 0.618–0.65 golden pocket of an impulse leg and your other signals line up for a reclaim, that's a high-conviction entry location — which is exactly when the convexity of long gamma is worth paying for. You want maximum gamma right at the spot where you expect the fast move to launch. Buy the pocket, and if the reclaim fires, positive gamma turns a clean technical entry into an accelerating winner. The chart picks the spot; gamma sizes the payoff.
Confluence 3: Greeks + dealer gamma / GEX levels
This is the tightest braid of all because gamma appears on both sides. Your option has gamma; the dealers have gamma; and the price levels where dealer gamma flips are magnets and walls on the very chart you're trading. A breakout setup that also sits below a large call wall in a long-gamma regime is a fade or pin risk — dealers sell into it. The same breakout above the gamma flip into short-gamma territory is a go — dealers chase it. Reading your Greeks and the dealer Greeks together is the difference between buying calls into a wall and buying them into open air.
The Hollow Point method — macro to sector to technical to behavioral, weighted by timeframe — is a confluence engine. The Greeks are simply the confluence engine applied to your instrument. Stack the chart read, the volatility read, and the positioning read, and only trade where they agree.
Common Mistakes — The Long List
These are the ways the Greeks quietly drain accounts. Each one is a lesson somebody paid for.
1. Buying "cheap" OTM options. Cheap means low delta means low probability. The price is honest; the trader isn't listening. A $0.20 call isn't a bargain, it's a coin the market has weighted heavily against you.
2. Ignoring IV before a buy. Buying a great directional idea when IV Rank is 85 means you're paying top dollar for volatility that's likely to fall. You can be right on direction and lose on vega. Always check IV Rank first.
3. Buying premium into earnings without doing the expected-move math. The move is already priced. Unless the stock beats the straddle-implied move, IV crush eats you. This is the single most predictable retail loss on the calendar.
4. Holding weeklies "to give them time." Time is the enemy of a long weekly. Its theta accelerates exactly as you wait. Buying short-dated and holding medium-term stacks the two worst decay properties against you.
5. Sizing by contract count instead of deltas. "I only bought ten contracts" means nothing if they're 0.90 delta — that's 900 deltas, the punch of 900 shares. Size by exposure or the exposure sizes you.
6. Selling premium without respecting short gamma. The credit feels free until the gap. Every seller is short gamma; the premium is the pay for that risk. Undersized-for-gamma sellers eventually meet the steamroller.
7. Timeframe mismatch. Expressing a daily-chart thesis in a 0DTE option. The option can die before the thesis resolves. Match DTE to the chart timeframe your idea lives on.
8. Marrying a 0DTE position. These resolve to intrinsic-or-zero. There is no "wait it out." No stop, no exit plan, no business being in the trade.
9. Forgetting the 100x multiplier. A "$0.08 theta" sounds like nothing until you realize it's $8 per contract per day, $80 on ten contracts, $560 over a week the stock did nothing.
10. Chasing an option that already popped. After the gamma-driven pop, you're buying mostly delta with the convexity behind you. Any pullback craters it. The time to own gamma is before the move.
11. Ignoring dealer positioning at key levels. Buying calls straight into a massive call wall in a long-gamma regime is buying into a pin. The chart level and the gamma map have to agree.
12. Treating the Greeks as static. Delta changes (gamma), theta accelerates, vega shifts with IV. A snapshot at entry is not the trade. The Greeks you have at expiration week are not the Greeks you bought.
13. Oversizing in high-vol regimes. Fat premiums tempt bigger positions exactly when per-contract dollar swings are largest. Size down when vol is up to hold your risk constant.
14. Getting assigned by surprise across a dividend. Short an ITM call across an ex-dividend date and you can be assigned early by someone capturing the dividend. Know the dividend calendar on any short-call position.
How the Pros Use the Greeks Differently From Beginners
Beginners think in price. Pros think in Greeks. A beginner says "I bought the $105 call because I think it goes up." A pro says "I put on +40 deltas, +8 gamma, –$12 theta, +$30 vega, and here's the regime that makes each of those pay." Same trade, two entirely different levels of awareness.
Beginners see one contract. Pros see a book. The professional aggregates every position into one net Greek profile and manages that. They know their whole account is, say, +300 deltas and short $400 of vega, and they hedge the exposures they didn't intend. A retail trader with five separate "bets" is usually carrying a large accidental net exposure they've never measured.
Beginners pick direction and hope. Pros pick which Greek they want to be paid for. Sometimes the trade is a pure vega play (own cheap vol before an expansion). Sometimes it's pure theta (sell a range in high IV). Sometimes it's delta with gamma convexity (buy the breakout). The pro chooses the source of edge first and then builds the structure that isolates it — that's what a spread, condor, calendar, or diagonal is for.
Beginners fear the Greeks as math. Pros use them as a control panel. Every structure is a deliberate choice of net Greeks. Want direction without vega risk into earnings? Vertical spread. Want theta without unlimited gamma risk? Defined-risk condor. Want long stock exposure with less theta drag? Deep-ITM LEAPS call. The Greeks aren't obstacles to work around — they're the dials you set.
Beginners react to P&L. Pros attribute it. When a pro's position moves, they know why — delta made this, vega gave that back, theta was the drip. That attribution feeds the next decision. A beginner just sees red or green and guesses. Attribution is how you actually learn from a trade instead of collecting anecdotes.
Beginners size by dollars risked. Pros size by Greek exposure and regime. The professional shrinks size when vol is up, leans into gamma when a catalyst is near, and keeps net delta inside a band that matches conviction. Position size becomes an output of the Greeks and the regime, not a fixed habit.
FAQ
Do I need the math to trade options well? No. You need the intuition and the directional signs, plus your platform showing you the live Greek values. Every broker's option chain displays delta, gamma, theta, and vega per contract. Your job is to read them and understand which one owns the trade — not to compute Black-Scholes by hand.
Where do I see the Greeks? On the option chain and the position screen of any real options broker. Add the Greek columns if they're hidden. Look at them before you enter, not after you're underwater.
Which Greek matters most? It depends on the trade, and knowing which is itself the skill. Weekly scalp: gamma and theta. Earnings play: vega (IV crush). LEAPS: vega and rho. Range-selling: theta and gamma. There is no single "most important" — there's the one that owns this trade.
Why did my call lose money when the stock went up? Almost always vega (IV fell — classic after an event) or theta (time passed and the move was too small to offset decay), and sometimes both overwhelming a small positive delta. Attribute it: the Greeks will show you exactly which one did it.
Is buying or selling options "better"? Neither — they're opposite bets on the same trade-offs. Buyers are long gamma/vega and short theta (pay rent, own convexity, need a move). Sellers are the reverse (collect rent, short the fast move, need calm). The right side is the one that matches the regime and your read.
What DTE should I trade? Match it to the chart timeframe your thesis lives on. Intraday idea: 0–2 DTE. Daily-chart swing: 30–60 DTE. Position/macro: LEAPS. Mismatching DTE to timeframe is a top structural error.
How do I avoid IV crush? Check IV Rank before buying. Don't buy inflated premium into a known event. If you want to trade the event, sell the premium with defined risk, buy further out in time, or use a spread that neutralizes vega — or stand aside.
Are the Greeks accurate? They're accurate locally — for a small change, right now. They're first- and second-order estimates, so for a large or sudden move (a gap), the actual result differs from the linear Greek prediction. That gap between the estimate and reality is gamma's territory, which is why gamma is the one that surprises people.
What's the fastest way to get better at this? Attribute every trade's P&L to specific Greeks afterward, and log it. Over a few dozen trades you'll see your own patterns — you'll learn you keep losing to vega on earnings, or to theta on held weeklies — and the leaks close themselves once you can name them.
The Cheat-Sheet
Pin this.
| Greek | Measures | Long option | Peaks when | One-line intuition |
|---|---|---|---|---|
| Delta | $ change per $1 stock move | + calls, – puts | Deep ITM (→1.0) | Your effective share count / rough ITM odds |
| Gamma | Change in delta per $1 move | Positive | ATM + near expiry | The accelerator — convexity that cuts both ways |
| Theta | $ lost per day | Negative | ATM + near expiry | The rent you pay to hold time |
| Vega | $ change per 1-pt IV move | Positive | ATM + far-dated | Your exposure to fear / volatility |
| Rho | $ change per 1% rate move | + calls, – puts | Far-dated (LEAPS) | Cost of carry — ignore it unless you trade LEAPS |
Where each Greek dominates:
| Horizon | Driving Greeks | Nearly dead |
|---|---|---|
| 0–2 DTE | Gamma, Theta | Vega, Rho |
| 1–2 weeks | Gamma, Theta, some Vega | Rho |
| 30–60 DTE | Delta, Vega, moderate Theta | Rho |
| LEAPS (1yr+) | Vega, Rho, Delta | Gamma, Theta |
Regime playbook:
| Regime | Be | Favored structure | Watch out for |
|---|---|---|---|
| Trend | Long delta + gamma | OTM/ATM long calls or puts, low IV | Theta on consolidation days |
| Chop / range | Long theta, short gamma | Iron condors, credit spreads | The breakout that ends the range |
| High vol | Short vega, small size | Defined-risk premium selling | Gaps (short gamma), size down |
| Regime shift | Flat / hedged | Reduce, hedge net Greeks | Vega + gamma losses stacking |
The interactions that actually matter:
- Gamma accelerates delta, and both go vertical at-the-money near expiration.
- Theta bleeds fastest ATM into expiration, and accelerates in the final days — including weekends, priced out on Friday.
- Vega dominates far-dated and high-IV options; it's nearly dead in 0DTE.
- You cannot separate theta and gamma. Positive theta always comes with negative gamma and vice versa. Collecting decay means being short the fast move — that trade-off is the entire premium-selling business.
- Vega and gamma losses combine on a regime shift — they don't offset. That's why blowups cluster at the transition.
The rules that keep you alive:
- A cheap OTM option is cheap because it usually expires worthless. Delta is telling you the odds. Believe it.
- If you're long options, be right soon. Theta is a countdown, not a suggestion.
- Check IV Rank before every buy. Don't pay inflated premium into a known event and call it a directional trade.
- Earnings = IV crush. Do the expected-move math. Right on direction can still lose. Sell the premium or stand aside.
- 0DTE is a scalp, never a hold. Gamma is the reward, theta is the guaranteed punishment for waiting.
- Trade net position Greeks, not contracts. Build the exposures you want; cancel the ones you don't. Spreads exist to shape Greeks — use them on purpose.
- Know which Greek owns your trade. Weekly scalp? Gamma and theta. LEAPS? Vega and rho. Read the one that matters.
- Match DTE to your chart timeframe. The most common structural error is right chart, wrong expiration.
- Size by exposure and regime. Down when vol is up. Deltas, not contract counts.
- Attribute every P&L to a Greek. That's how the leaks close.
The Greeks aren't a test you pass once. They're the running diagnostic on every position you hold — the difference between "I hope this works" and "I know exactly what makes this work, what breaks it, and what I'm being paid to risk." That's the whole game. Measure your exposure, respect the trade-offs, size for the risk you're actually short, read the regime, align the timeframe, and let the discipline do the heavy lifting.
Bound by rules, feared by trade.