
Most traders learn options backwards. They learn long calls first because it's the closest thing to buying a lottery ticket, lose money for a year, and conclude "options are gambling." They never learned the actual craft, which is this: an option strategy is a sentence. It states a direction, a magnitude, a timeframe, and a bet on volatility, all at once. Pick the wrong strategy for your thesis and you can be right about the stock and still lose.
That last sentence is the entire reason this guide exists. A stock trader has one decision — long or short — and a stop. An options trader has four decisions stacked on top of each other, and three of them are invisible to someone who only watches price. You can buy the right direction and lose to time. You can time it perfectly and lose to a volatility collapse. You can be flat-out correct and watch the trade bleed because you chose a structure that only pays if the move is violent, and the move was merely nice. Options don't punish being wrong. They punish being imprecise.
This is the whole playbook, organized the only way that matters — by what you're trying to say. Directional. Income. Neutral. Volatility. Plus the two workhorses every serious premium seller eventually runs: ratio spreads and the wheel. For each one you get the setup, max gain, max loss, breakevens, the ideal volatility regime, and the exact thesis it expresses — with worked numbers you can check on a napkin. Then we go past the recipes into the parts that separate a technician from a tourist: how each structure behaves in a trend versus a chop versus a high-vol panic, how to read it across timeframes, how to stack it with the chart tools you already trust, and the dozen mistakes that quietly drain accounts.
Read it top-down, the HPT way: macro sets the regime, the regime sets whether you buy or sell premium, and the thesis picks the structure. Everything else is bookkeeping.
First: the two dials every option trade turns
Before any strategy, internalize the two variables that decide everything. Get these two right and mediocre execution still makes money. Get them wrong and flawless execution still loses. They are not equally weighted with the strategy choice — they precede it.
Dial 1 — Direction and magnitude. Where's it going, and how far? "Up" is not a thesis. "Up 8% into earnings in three weeks, then stalls" is a thesis. The second one tells you strikes and expiration; the first one tells you nothing. Every serious options ticket should be reducible to a single spoken sentence with four parts: direction, size of move, by when, and what happens to volatility. If you can't say all four out loud, you don't have a trade — you have a feeling wearing a costume.
Dial 2 — Volatility (IV). Every option's price contains implied volatility — the market's guess at how much the stock will move, annualized. High IV = expensive options. Low IV = cheap options. You do not trade IV in a vacuum; you trade it relative to itself using IV Rank (IVR): where today's IV sits between its 52-week low (0) and high (100). IVR 80 means options are pricier than they've been 80% of the past year. IVR 15 means they're cheap.
A quick but important refinement: IV Rank and IV Percentile are cousins, not twins. IVR measures where current IV sits on the range between the year's high and low. IV Percentile measures what fraction of days over the year had lower IV than today. In a stock that spent eleven months asleep and one month terrified, IVR can read 40 while IV Percentile reads 90 — because a single fear spike stretched the range. When they disagree, trust IV Percentile for premium selling decisions; it's harder to fool with one outlier. But for the napkin-math in this guide, IVR is the workhorse and it's what most platforms show first.
The single most important rule in this entire guide:
Buy premium when IV is cheap (IVR under ~30). Sell premium when IV is rich (IVR over ~50).
Why? Because IV is mean-reverting. Buy a call at IVR 15 and even a flat stock can pay you as IV expands. Sell a put at IVR 70 and time + IV collapse both work for you. Trade against this and you're swimming upstream — right on direction, drowning on vega.
Now meet the machinery behind that rule, because "vega" and "theta" aren't jargon — they're the actual forces moving your P&L when price sits still. These are the Greeks, and you only need four to run this entire playbook.
- Delta — how much the option gains per $1 the stock moves, and a rough proxy for the probability the option finishes in-the-money. A 30-delta call gains ~$0.30 per $1 up and has ~30% odds of expiring ITM. Delta is your direction dial made numeric.
- Theta — daily time decay. It bleeds buyers and feeds sellers, and it accelerates as expiration nears. This is why the last two weeks of an option's life are a cliff, not a slope.
- Vega — how much the option's price moves per one-point change in IV. Long options are long vega (helped by rising IV); short options are short vega. Vega is largest in longer-dated, at-the-money options.
- Gamma — how fast delta itself changes. High near expiration and near the strike, it's the reason a "safe" short option can turn into a live grenade in the final days. Gamma is the volatility of your directional exposure.
Now define the last few terms once. Debit = you pay to open (you're a buyer). Credit = you get paid to open (you're a seller). Breakeven = the price where the trade nets zero at expiration. Max loss / max gain are always quoted per share — multiply by 100 for one contract. The wing width of any spread is the distance between its two strikes. Extrinsic value is the part of the premium that is not intrinsic — pure time and volatility, and it's the part that decays to zero. Sellers harvest extrinsic value; buyers race to make intrinsic value outrun it.
One more concept that governs nearly every choice below: the expected move. The options market itself tells you how far it thinks the stock travels by a given date, roughly equal to the price of the at-the-money straddle. Stock at $100, the 30-day ATM straddle costs $8 — the market is pricing a ±$8 (±8%) one-standard-deviation move by expiration. Every strategy in this guide is, at bottom, a bet for or against the expected move. Directional and long-vol trades bet the real move exceeds it. Income and neutral trades bet it falls short. Learn to glance at the straddle price and you're reading the market's own forecast before you place a single leg.
Everything below is built from those pieces.
DIRECTIONAL — "I know which way, help me pay less to be right"
Long Call / Long Put — the pure directional bet
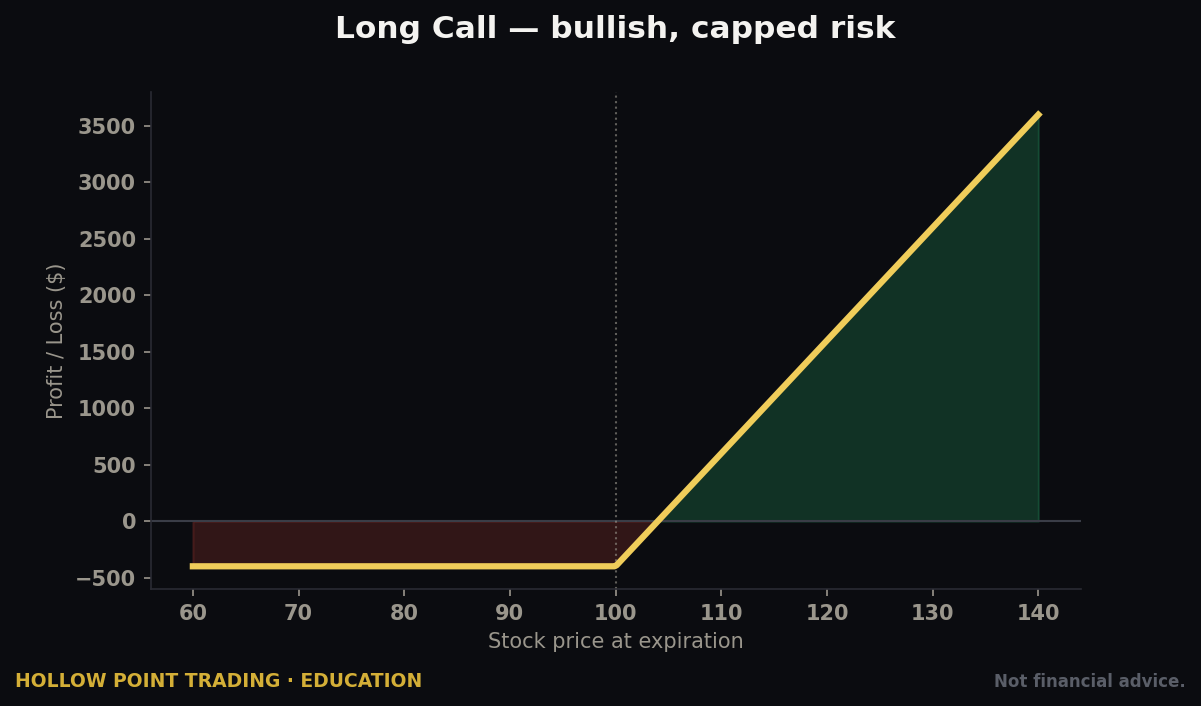
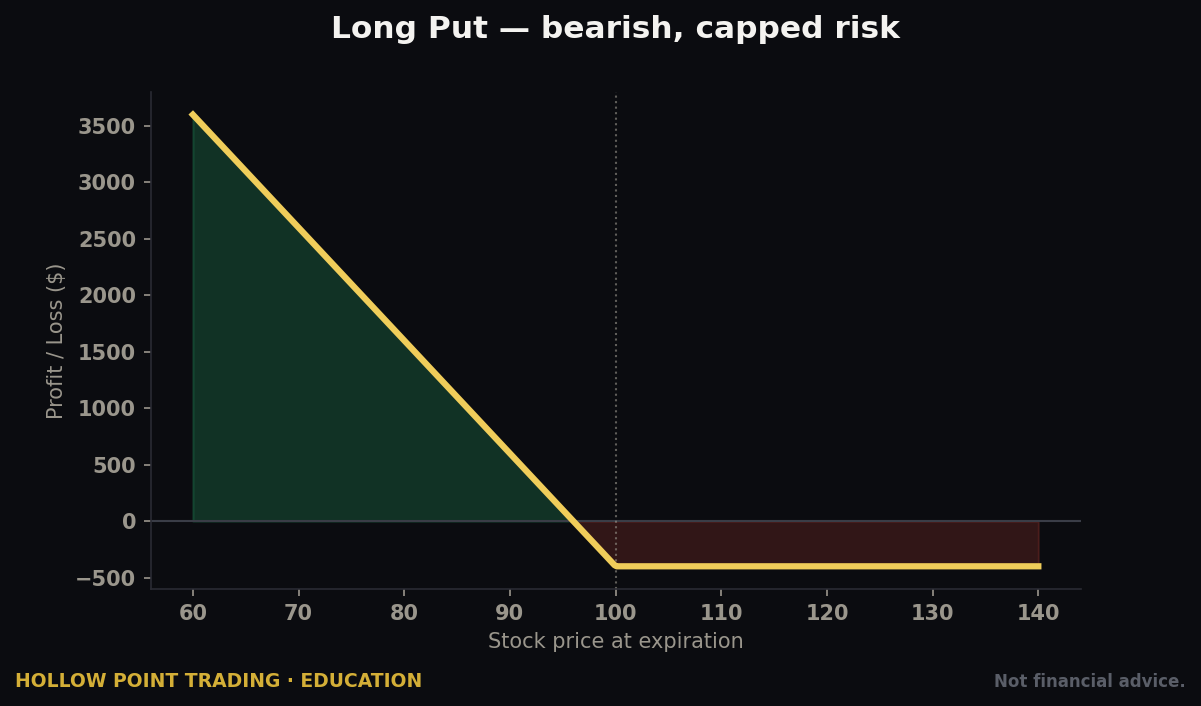
The core concept. Buy a call if you think it rips up; buy a put if you think it craters. You pay a debit, and that debit is the entire risk. Upside is huge (calls, theoretically unlimited) or very large (puts, down to zero).
The mechanism. A call gives you the right to buy 100 shares at the strike. If the stock blows past the strike, the call gains close to dollar-for-dollar with the stock (delta approaching 1.0) but cost you a fraction of the shares. That's leverage. The catch: every day you hold, theta bleeds the premium, and if IV drops, vega bleeds it too. You are fighting a two-front war — you need the stock to move and to move before the clock and the volatility drain the value out from under you.
Worked example. Stock at $100. You buy the 45-day $105 call for $3.00 ($300).
- Max loss: $300 (the debit). Full stop.
- Max gain: unlimited.
- Breakeven: strike + debit = $108. The stock has to clear the strike and pay back your premium.
- At $115 at expiration: intrinsic value $10, minus $3 cost = +$7.00 ($700), a 233% return. The same $700 of stock bought you 7 shares; the call controlled 100.
Choosing the strike — the decision beginners skip. There are three families of long call, and they are not interchangeable:
- Deep ITM (70–80 delta): behaves almost like stock, low theta, low leverage, high cost. Use it when you want a stock-replacement with defined risk and don't want to sweat time decay. This is the "poor man's stock."
- ATM (~50 delta): the balanced choice — meaningful leverage, meaningful theta. The default when you have a clean directional read over a few weeks.
- OTM (20–30 delta): cheap, explosive, mostly extrinsic value, and the graveyard of retail accounts. It only pays on a big fast move; a small correct move can still lose because the whole premium was time value.
The rule of thumb: *the further OTM you go, the more you're betting on magnitude and speed, not just direction.* A 25-delta call isn't a cheaper version of a 50-delta call — it's a completely different thesis wearing the same ticker.
Ideal IV & regime. LOW IVR. You're buying vega, so buy it on sale. The best long-premium setup is a coiled, low-IV stock about to break a technical level — a compression, a base, a flag. HPT context: a daily 55-EMA reclaim on rising relative strength while IVR sits at 20 is a textbook long-call window. In a strong, established trend the long call is a legitimate workhorse — trends pay for the theta because the move keeps coming. In chop, the long call is a slow death: the stock oscillates around your strike and theta grinds you to powder. In high-vol panics, resist buying the obvious put after a 5% down day — IV is already screaming, and a bounce plus IV crush can lose you money on a further drop.
The thesis it expresses: "A specific, sizable move is coming soon, and options are currently cheap." Fast and directional. If you can't name the catalyst and the timeframe, you're just paying theta rent.
Mistakes people make. Buying way-OTM "cheap" calls that need a miracle. Buying the front-week (all theta, no time to be right). Buying into an earnings IV crush — you nail the direction, IV collapses the next morning, and the call still loses. And oversizing, because "it's only $300" turns into ten of them.
Debit Spreads — the disciplined directional trade
Long options are honest but expensive and theta-heavy. The fix is to finance your long option by selling a further option against it. That's a vertical debit spread. HPT lives here for directional plays because it's defined-risk and built for 1:3.
Bull Call Spread (buy the dip, cap the rip)
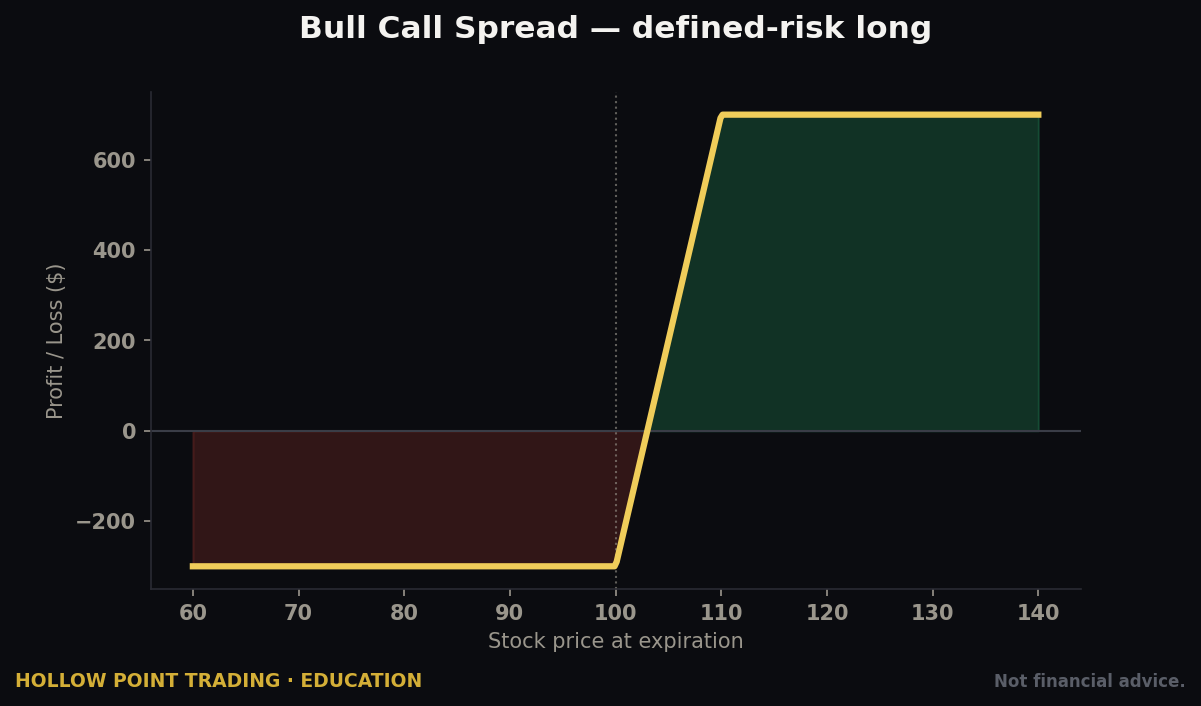
Setup: Buy a lower-strike call, sell a higher-strike call, same expiration. Net debit.
Worked example. Stock at $100. Buy the $100 call for $4.00, sell the $110 call for $1.50. Net debit $2.50 ($250).
- Max loss: the debit, $250.
- Max gain: wing width − debit = $10 − $2.50 = $7.50 ($750).
- Breakeven: lower strike + debit = $102.50.
- Reward:risk = 750:250 = 3:1. That's the HPT floor, on a napkin.
At $110+ you collect the full $750. Between $102.50 and $110 you make partial. Below $102.50 you lose, capped at $250.
Why the sold leg changes the physics. By selling the $110 call you don't just lower the cost — you neutralize most of the vega and cut the theta roughly in half. The short call's decay offsets the long call's decay. This is the quiet reason a debit spread beats a naked call when IV is merely middling instead of dirt cheap: you've stopped paying full freight on time and volatility, and you're expressing something much closer to pure direction. The cost is the ceiling — you've sold away everything above $110.
Ideal IV & regime: neutral-to-lowish IV, clear uptrend or bounce setup. Because you're both buying and selling a call, vega is largely neutralized. In a trend, place the short strike at the next measured-move target or resistance shelf and let the trend walk price into your max profit. In chop, tighten the wing and treat it as a swing trade between range boundaries. In high vol, the debit spread is far safer than a naked long because the collapsing IV hurts both legs, canceling out.
Thesis: "Up to roughly $110, but probably not to the moon, and I want a fixed cost with a clean 3:1." You give up the unlimited tail in exchange for a cheaper, higher-probability structure.
Bear Put Spread (the mirror)
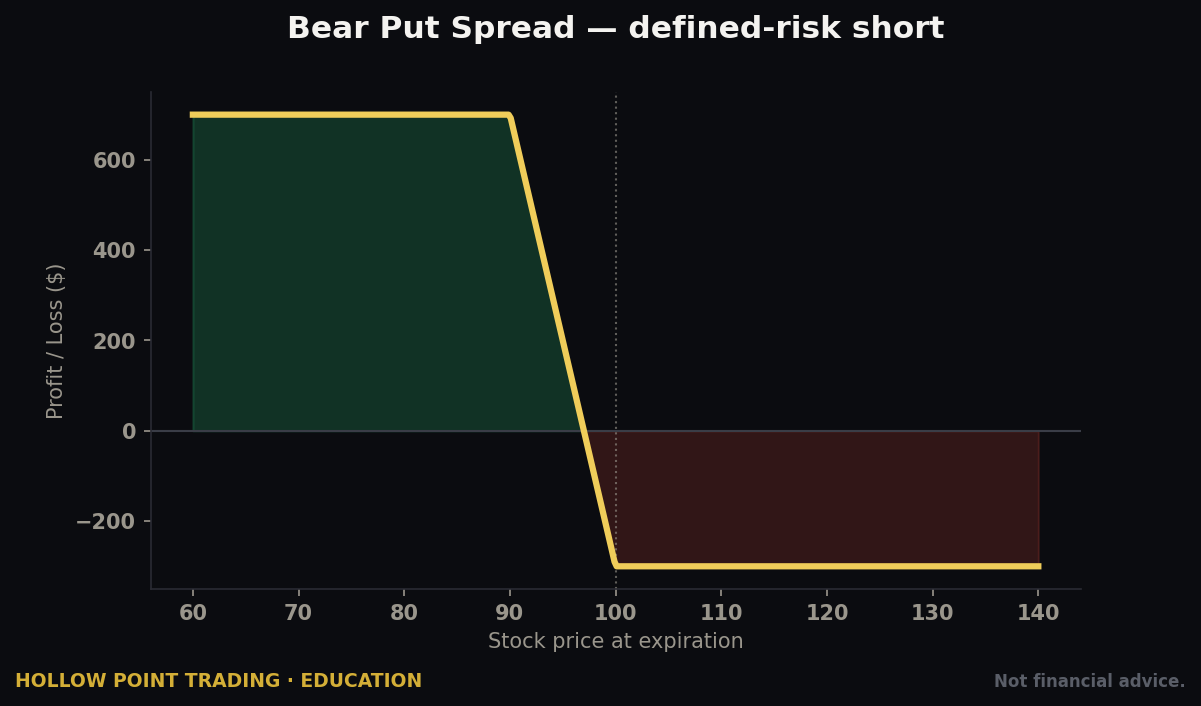
Setup: Buy a higher-strike put, sell a lower-strike put. Net debit. Same math, pointed down.
Worked example. Stock at $100. Buy the $100 put for $4.00, sell the $90 put for $1.50. Net debit $2.50.
- Max loss: $250. Max gain: $750. Breakeven: higher strike − debit = $97.50.
Thesis: "Down to about $90, defined risk, 3:1." The go-to bearish structure when you don't want the assignment and margin headaches of shorting stock. It also sidesteps the borrow costs and the theoretically-unlimited risk of a short share position.
Mistake on both: picking the short strike arbitrarily. The short strike should sit at a real level — the resistance you don't expect price to clear, the support you don't expect it to break. Let the chart place the wing, not a round number. A bull call spread with the short leg parked below a wall of overhead supply is a spread that will fight itself; place it at the wall where price naturally stalls, and the same debit buys you a far better probability.
INCOME / PREMIUM — "Pay me to wait"
Now flip sides. Instead of paying for a move, you sell the move to someone else and collect theta. These are the strategies that pay you for being patient and disciplined — the HPT bread and butter when IVR is elevated.
The mental shift here is enormous and most directional traders never make it. As a buyer, time is your enemy and you need to be right. As a seller, time is your ally and you only need to be not-catastrophically-wrong. A premium seller can be sloppy on direction, mediocre on timing, and still print — provided IV was rich and the stock didn't do anything violent. That's the trade-off: you swap the dream of a 300% winner for a business that grinds out 70% win rates. It's less exciting and far more bankable.
Covered Call — rent out shares you own
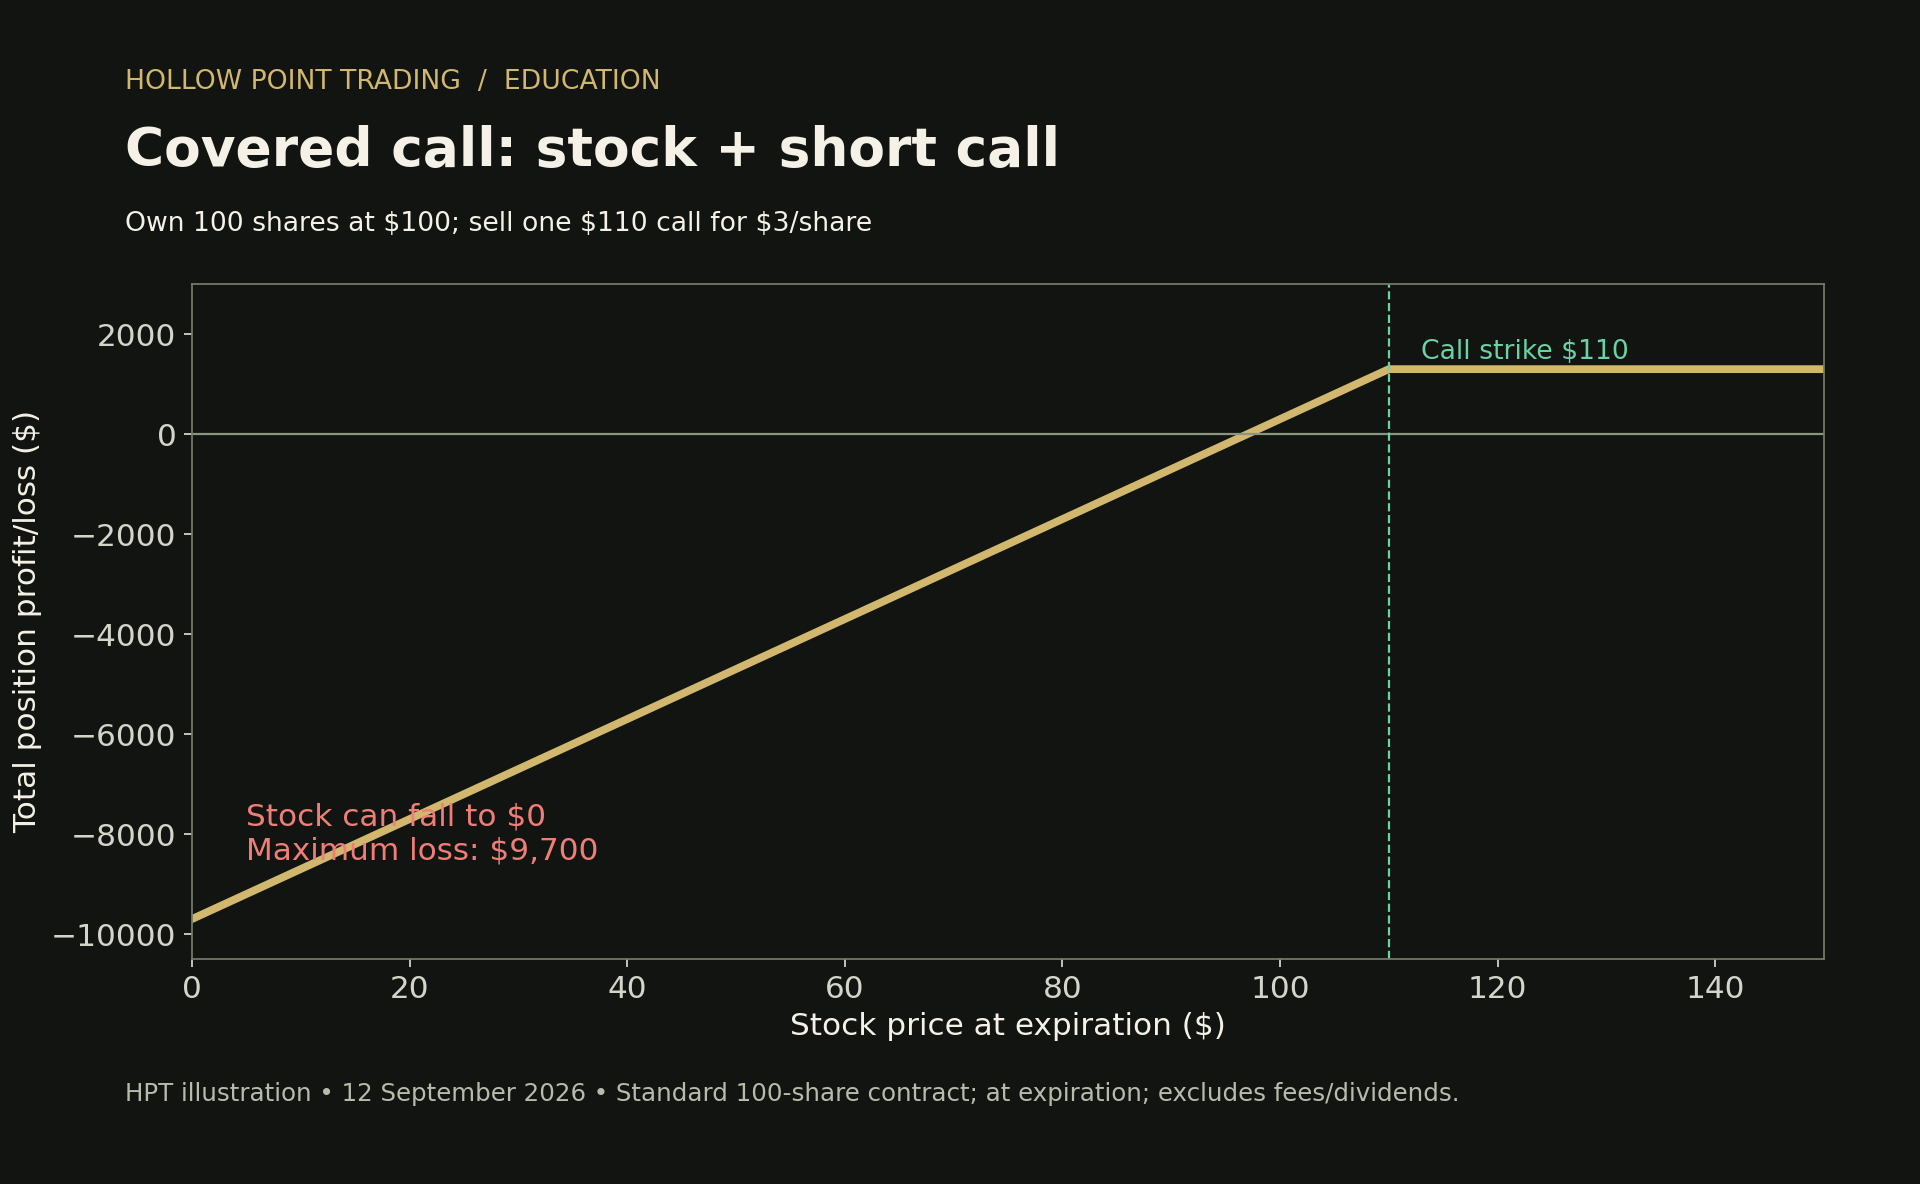
The core concept. You own 100 shares. You sell one call against them, collecting premium. If the stock stays below the strike, you keep the premium free and clear. If it rips above, your shares get called away at the strike — you sold your upside, but at a price you chose.
Worked example. You own 100 shares at $100. Sell the 30-day $105 call for $2.00 ($200).
- Max gain: premium + (strike − cost) = $200 + $500 = $700, realized if it closes above $105.
- Max loss: basically the stock's, minus the $200 cushion (you're long 100 shares — that's the real risk).
- Breakeven: cost − premium = $98.
- Effective yield: $200 on $10,000 in 30 days ≈ 2%/month if it works. Annualized, that's the engine.
The strike-selection dial. A covered call's personality is entirely set by the delta you sell:
- Sell a 30-delta call (further OTM): small premium, ~70% chance you keep the shares, more room to run. This is the "I mostly want to hold, just skim a little income" setting.
- Sell an ATM call (~50 delta): fat premium, roughly coin-flip assignment, maximum income but maximum upside surrender. The "I'm neutral and want the fattest yield" setting.
- Sell deep ITM: rare, but it turns the covered call into a near-guaranteed small return with a big downside cushion — a defensive posture on a stock you're lukewarm about.
Ideal IV & regime: high IVR, neutral-to-mildly-bullish. You want fat premium and a stock you're happy to hold or happy to sell. The covered call's kryptonite is a strong uptrend — you'll cap your gains right as the stock is running, and repeatedly selling calls that keep getting blown through is a recipe for underperforming a simple buy-and-hold. Sell covered calls on names you expect to drift or chop, not names you expect to sprint.
Thesis: "I'm long-term bullish or neutral, and I'll trade some upside for income while I wait." The classic yield overlay.
Mistakes: selling calls on a stock you love below where you'd actually sell it (then it gaps up and away). Selling for pennies at low IVR. And panicking when it rallies through your strike — that's the good outcome; you made max profit. Don't chase it up by rolling into a loss.
Cash-Secured Put — get paid to set your buy limit
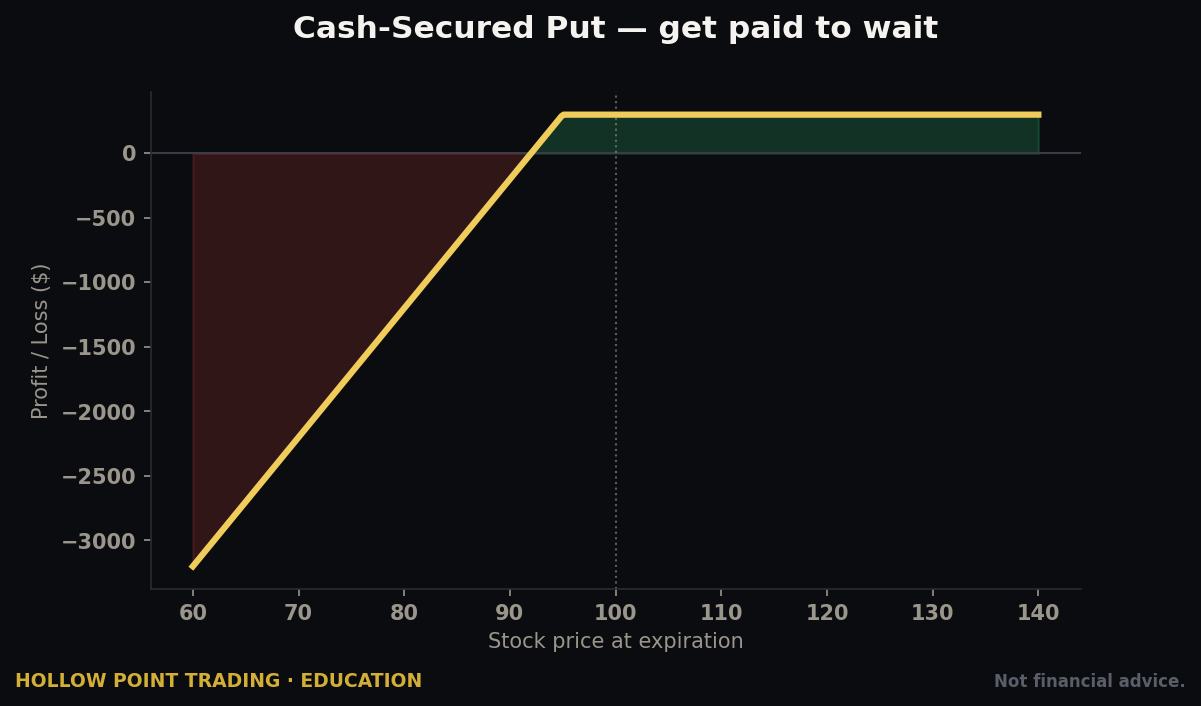
The core concept. The covered call's twin. You want to own a stock lower. Instead of a limit order, you sell a put at your target and get paid for the promise. Stock drops to the strike, you buy it (at a discount, thanks to the premium). Stock stays up, you keep the premium and repeat.
Worked example. Stock at $100, you'd love it at $95. Sell the 30-day $95 put for $1.50 ($150), setting aside $9,500 cash.
- Max gain: the premium, $150 (if it stays above $95).
- Max loss: strike − premium, down to zero = $93.50 × 100 = $9,350 worst case (stock to $0).
- Breakeven / effective buy price: $93.50. You either pocket $150 or buy the stock 6.5% below today.
Ideal IV & regime: high IVR, on a stock you genuinely want to own. Bullish-to-neutral. The cash-secured put is the single best tool for a patient bull in a high-vol market: elevated IV means you get paid handsomely to wait for the discount you already wanted. When the VIX spikes and everyone's panicking, the disciplined seller is quietly writing puts on great companies at strikes 10% below the last print and getting paid double the usual premium to do it.
Thesis: "I want in, but lower, and I'll get paid while I wait for my price."
Mistake: selling puts on garbage you don't want to own just for the premium. When it gets assigned — and it will — you're now bagholding. Only sell puts at prices where assignment is a win.
Credit Spreads — defined-risk premium selling
The naked put ties up buying power and carries big tail risk. Cap it by buying a cheap further-OTM option. Now you've got a credit spread — the premium seller's scalpel.
Bull Put Spread (I bet it stays above a level)
Setup: Sell a higher-strike put, buy a lower-strike put. Net credit.
Worked example. Stock at $100. Sell the $95 put for $1.50, buy the $90 put for $0.50. Net credit $1.00 ($100).
- Max gain: the credit, $100.
- Max loss: wing width − credit = $5 − $1 = $400.
- Breakeven: short strike − credit = $94.
Note the R:R here is inverted — risk $400 to make $100. That's normal for credit spreads; you win by being right most of the time (high probability), not by 3:1 per trade. You pick strikes so probability of profit runs ~70%+, and you manage winners early (take it off at ~50% of max credit).
Why the inverted R:R still works — the math beginners miss. A trade that risks $400 to make $100 sounds insane until you attach a probability. If your short strike is a 30-delta put, the trade wins roughly 70% of the time. Over ten trades: seven winners of $100 = +$700, three losers — managed, not held to full max — averaging maybe −$250 each = −$750. That's break-even-ish with sloppy loss management, and comfortably profitable with disciplined loss management (stopping at 2x credit turns those −$400 max losses into −$200 stops: three × −$200 = −$600, net +$100 per ten trades, every ten trades, forever). The edge isn't in the payoff ratio. It's in the win rate times disciplined loss size. Break either half and the strategy inverts on you.
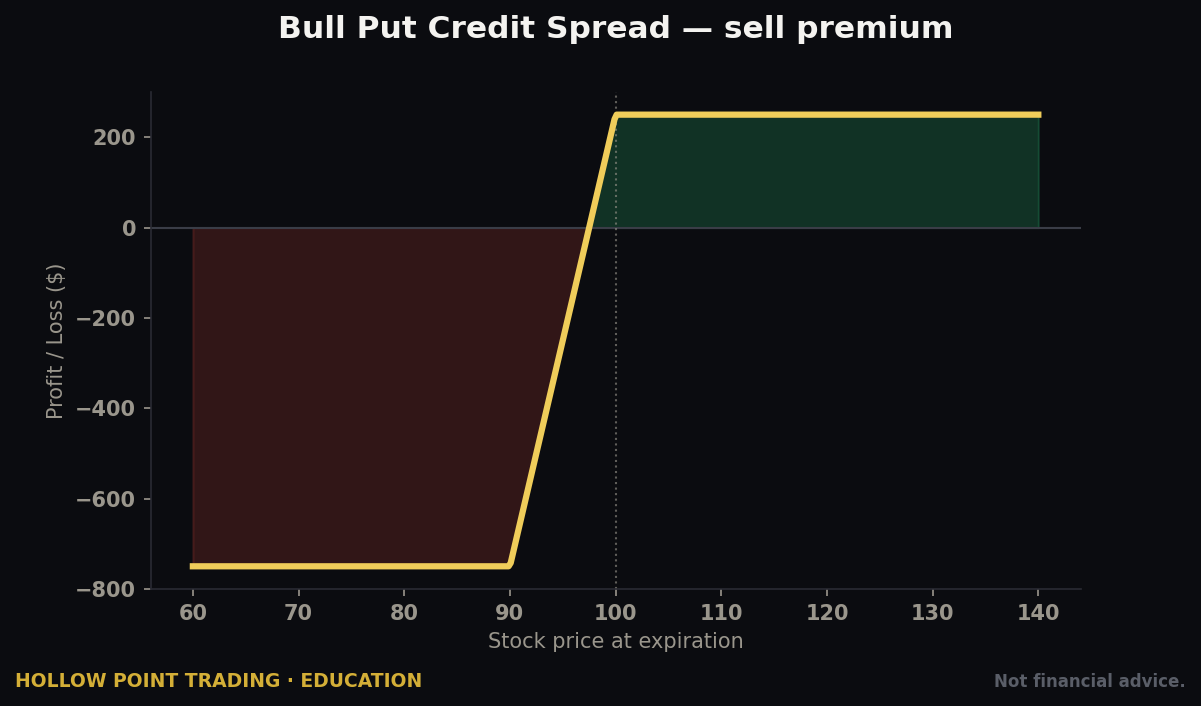
Ideal IV & regime: high IVR, bullish-to-neutral. Sell the $95 put below support you trust. In a grinding uptrend, bull put spreads are a money machine — you keep selling puts below rising support and collecting. In a range, sell them near the bottom of the range. Avoid them entirely when structure is breaking down; a support level that "always held" is worth nothing the day the regime flips.
Thesis: "It won't close below $94. I'll get paid for that."
Bear Call Spread (I bet it stays below a level)
Setup: Sell a lower-strike call, buy a higher-strike call. Net credit. The mirror.
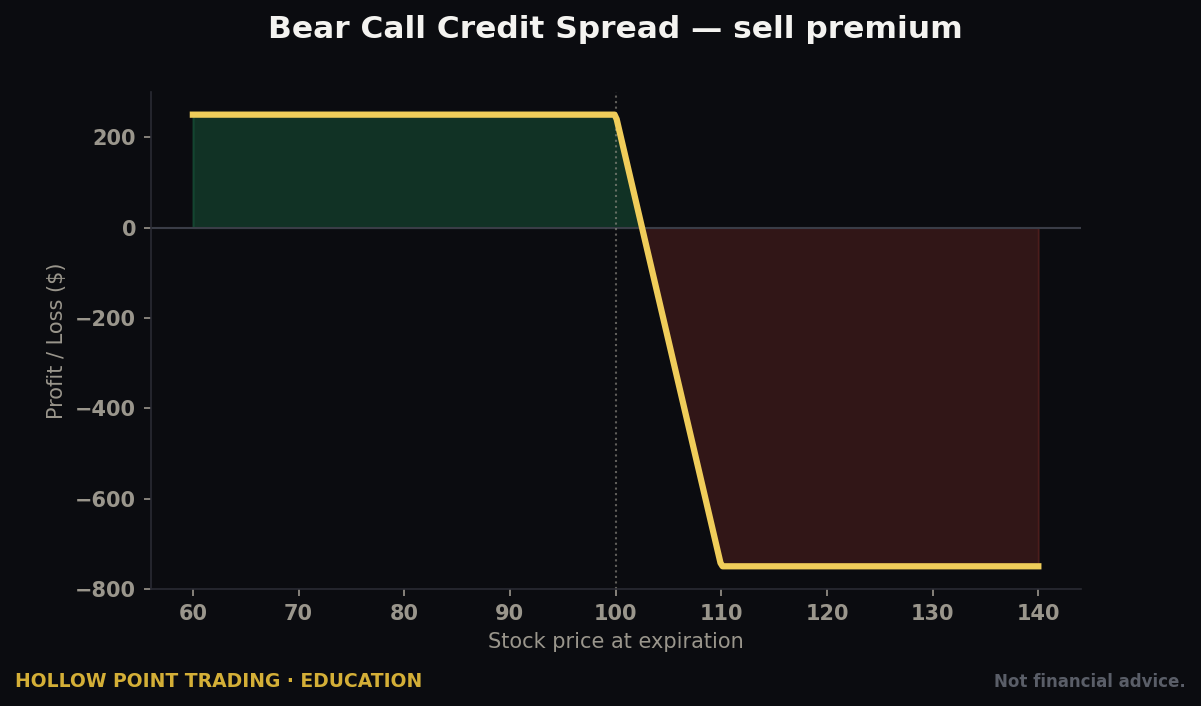
Worked example. Stock at $100. Sell the $105 call for $1.50, buy the $110 call for $0.50. Credit $1.00.
- Max gain: $100. Max loss: $400. Breakeven: short strike + credit = $106.
Thesis: "It won't reclaim $106." Sell it under the resistance you're confident holds. The bear call spread is the premium seller's favorite way to fade an overextended rally into a wall — defined risk, no borrow, and you profit even if the stock merely stalls rather than reverses.
Mistake on both: selling spreads too close to the money for a "fat" credit, then getting run over. And holding losers to expiration hoping — the pro move is a mechanical stop (e.g., exit at 2x credit received) and taking profits at 50%. Small consistent wins, ruthlessly cut losses. Discipline over prediction.
NEUTRAL / RANGE — "It goes nowhere, and I get paid for the boredom"
Directional trades need a move. Income trades lean one way. But markets chop most of the time. These structures monetize a stock that just sits there — the purest expression of "sell premium when IV is rich." Estimates vary, but markets spend the majority of their hours ranging rather than trending. If your entire toolkit is directional, you have no way to make money during the market's default state. These structures fix that.
Iron Condor — the range-bound cash machine
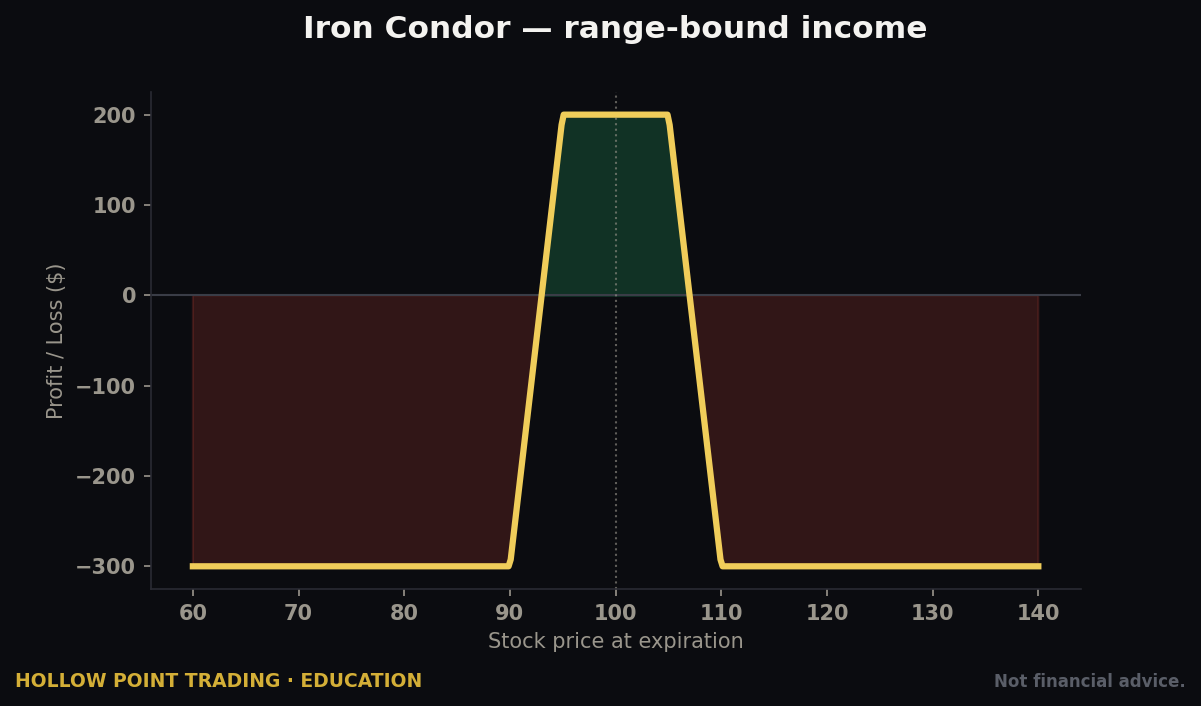
The core concept. Stack a bull put spread below the price and a bear call spread above it. You've boxed the stock into a range and collected credit from both sides. As long as it stays inside the box, theta pays you daily.
The mechanism. Four legs: sell an OTM put, buy a further OTM put (put wing), sell an OTM call, buy a further OTM call (call wing). Two credits, two defined-risk wings. Max profit if price finishes anywhere between the two short strikes. Crucially, because the stock can only breach one side at expiration, your capital requirement is the risk of a single wing, not both — the broker knows you can't lose on both ends at once.
Worked example. Stock at $100, IVR 65. Build the 45-day condor:
- Put side: sell $90 put ($1.20), buy $85 put ($0.50)
- Call side: sell $110 call ($1.20), buy $115 call ($0.50)
- Net credit: $1.20 − $0.50 + $1.20 − $0.50 = $1.40 ($140).
- Max gain: the credit, $140, if it lands between $90 and $110.
- Max loss: wing width − credit = $5 − $1.40 = $360 (one side; the two sides can't both lose).
- Breakevens: lower = short put − credit = $90 − $1.40 = $88.60; upper = short call + credit = $110 + $1.40 = $111.40.
So you profit anywhere in a nearly 23-point window and lose only if it breaks hard through either wing.
How to place the short strikes — the whole game. The single decision that makes or breaks a condor is where you set the two short strikes, and there are two schools:
- Delta-based: sell the ~16-delta put and ~16-delta call. That roughly brackets the one-standard-deviation expected move — the stock has about a 68% chance of finishing inside your box before any management. Clean, mechanical, and the tastytrade-style default.
- Chart-based (the HPT way): put the short put under real support and the short call under real resistance, then check that both are at least ~16 delta out. When a technical level and a statistical level line up, that strike is doubly defended. When the chart says the range is $92–$108 but the 16-delta strikes are $90 and $110, sell the tighter chart levels only if the extra credit justifies the tighter breakevens.
Ideal IV & regime: HIGH IVR (the higher the better — wider wings for the same risk), and a range-bound, low-momentum tape. Chop is your friend. A stock pinned between a call wall and a put wall on the gamma map is a condor begging to be sold. The condor's mortal enemy is the trend — a stock that quietly walks in one direction will stroll right out of your box and never look back. Before selling a condor, look at the daily: if it's making higher highs and higher lows, you are selling a range that does not exist.
Thesis: "This stays between $90 and $110 for the next six weeks, and IV is overpriced." You're short movement, short vol, long time decay.
Mistakes: putting on condors in a trending market (it walks right out one side). Wings too narrow (you get whipsawed constantly). And greed — holding for the last few dollars of credit when you should take it off at 50% and redeploy. Condors are a game of managing winners, not squeezing them.
Iron Butterfly — the condor's aggressive cousin
The core concept. Same idea, but the two short strikes are the same strike — you sell an at-the-money straddle and buy protective wings. Much bigger credit, much narrower profit zone. You're betting it pins a specific price.
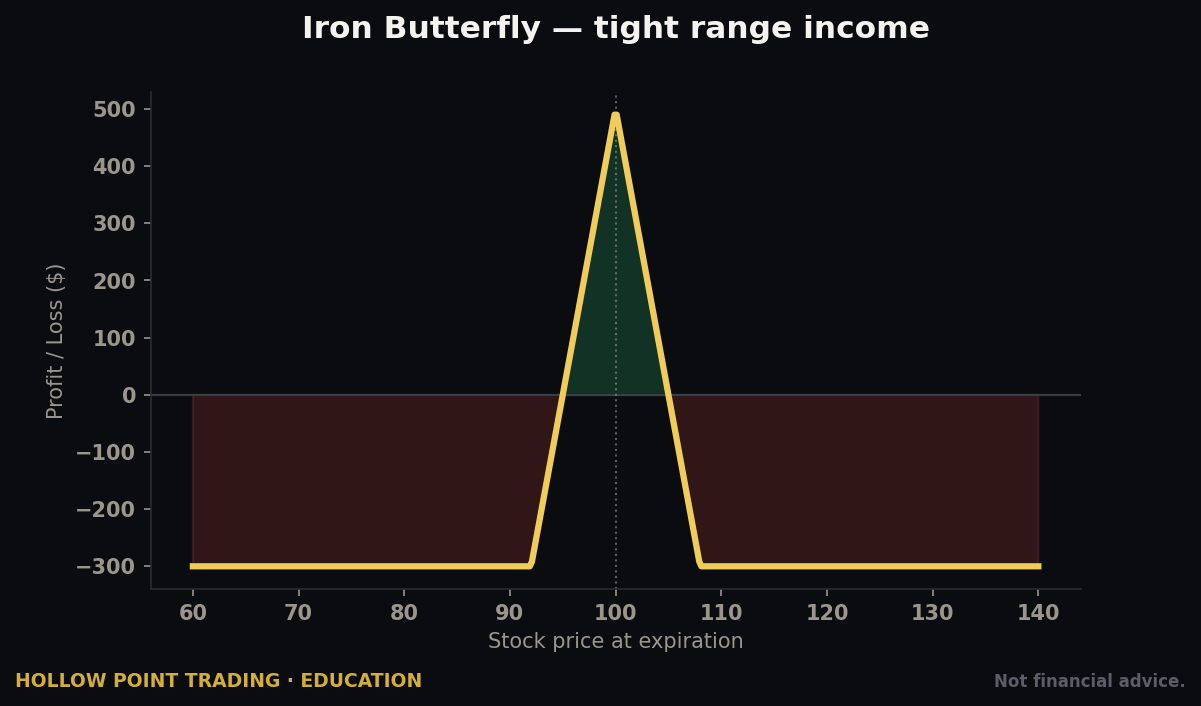
Worked example. Stock at $100, IVR 70. 45-day fly:
- Sell $100 put ($3.00), sell $100 call ($3.00) — the ATM short straddle, $6.00 in.
- Buy $90 put ($0.80), buy $110 call ($0.80) — the wings, $1.60 out.
- Net credit: $6.00 − $1.60 = $4.40 ($440).
- Max gain: $440, only if it pins exactly $100.
- Max loss: wing width − credit = $10 − $4.40 = $560.
- Breakevens: center ± credit = $95.60 and $104.40.
Bigger payday than the condor, tighter window. You need it to sit right here.
Condor vs. butterfly — how to choose. Same neutral thesis, different confidence about where. The condor says "somewhere in this room." The butterfly says "on this chair." Sell the fly when you have a strong reason to expect a specific price to act as a magnet — a max-pain strike, a heavy open-interest level, a monthly pivot that price keeps returning to. Sell the condor when you just believe the stock is going nowhere in particular. The fly pays more precisely because it demands more.
Ideal IV & regime: very high IVR, strong pin expectation — think a heavy options expiration where a big gamma strike acts as a magnet.
Thesis: "It parks near $100 into expiration." Higher conviction on the level, not just the range.
Mistake: trading a fly when you only have a vague range view — that's a condor. The fly demands a specific pin.
Calendars & Diagonals — selling time against time
The core concept. Sell a near-term option and buy a longer-term option at the same strike (calendar) or a different strike (diagonal). The front-month decays faster than the back-month, so you profit from the difference in theta — plus you're long vega, so you actually want IV to rise.
Worked example (call calendar). Stock at $100. Sell the 30-day $100 call for $2.00, buy the 60-day $100 call for $3.20. Net debit $1.20 ($120).
- Max loss: the debit, $120 (if it blows far from $100 either way).
- Max gain: variable, but roughly $200–$300 if it pins near $100 as the front-month expires worthless and you still hold a valuable back-month.
- Profit zone: a range around the strike; you want price at $100 at front-month expiry.
The double-engine that makes calendars special. A calendar makes money two ways at once, and this is why it's the most misunderstood structure in the book. Engine one: the near-term option you sold decays faster than the longer-term option you bought, so even if IV never moves, the theta differential pays you. Engine two: because you're net long a longer-dated option, you're long vega — a rise in IV inflates your back-month more than your front-month. This is the rare bird that is simultaneously neutral on price, long on time-decay differential, and long on volatility. It is the ideal structure for the specific setup of a sleepy, low-IV stock sitting on a level, that you expect to wake up soon.
Ideal IV & regime: LOW front-month IV relative to back — you want to buy the cheaper longer-dated vol and sell the richer or soon-to-decay near vol. Neutral price, and ideally IV about to expand. This is one of the few "neutral" trades that's long vega — it thrives when a sleepy low-IV stock is about to wake up.
Thesis (calendar): "It sits near $100 short-term, and volatility is cheap and likely to rise." Thesis (diagonal): same, but with a directional lean baked into the strike offset — essentially a "poor man's covered call" when you buy a deep long-dated call and sell near-term calls against it. The diagonal is where income and directional bias fuse: you get the theta harvest of a covered call without tying up $10,000 in shares, because the long-dated deep call is your stock stand-in.
Mistake: ignoring the vega. A calendar is a volatility trade wearing a neutral costume. Put one on at high front IVR and an IV crush guts it even if price behaves.
VOLATILITY — "I don't care which way, I care HOW MUCH"
Sometimes you have zero directional edge but a strong view on magnitude. These trades are pure vol bets — you take direction off the table entirely.
Long Straddle / Long Strangle — buy the explosion
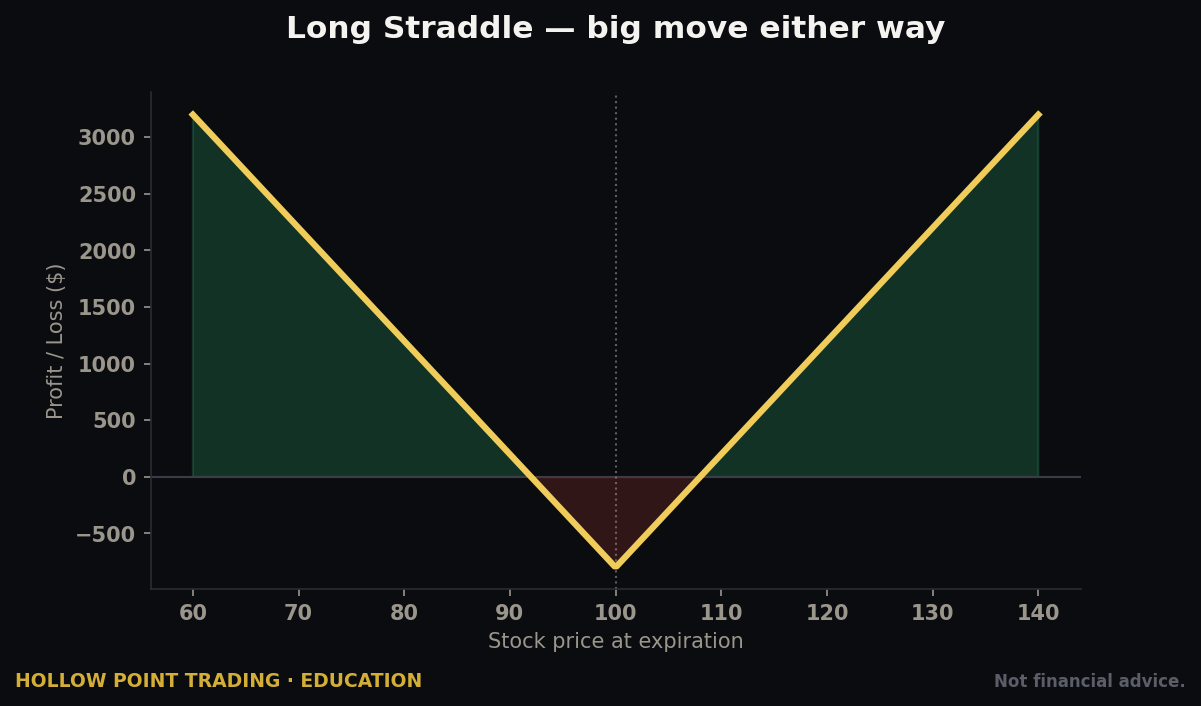
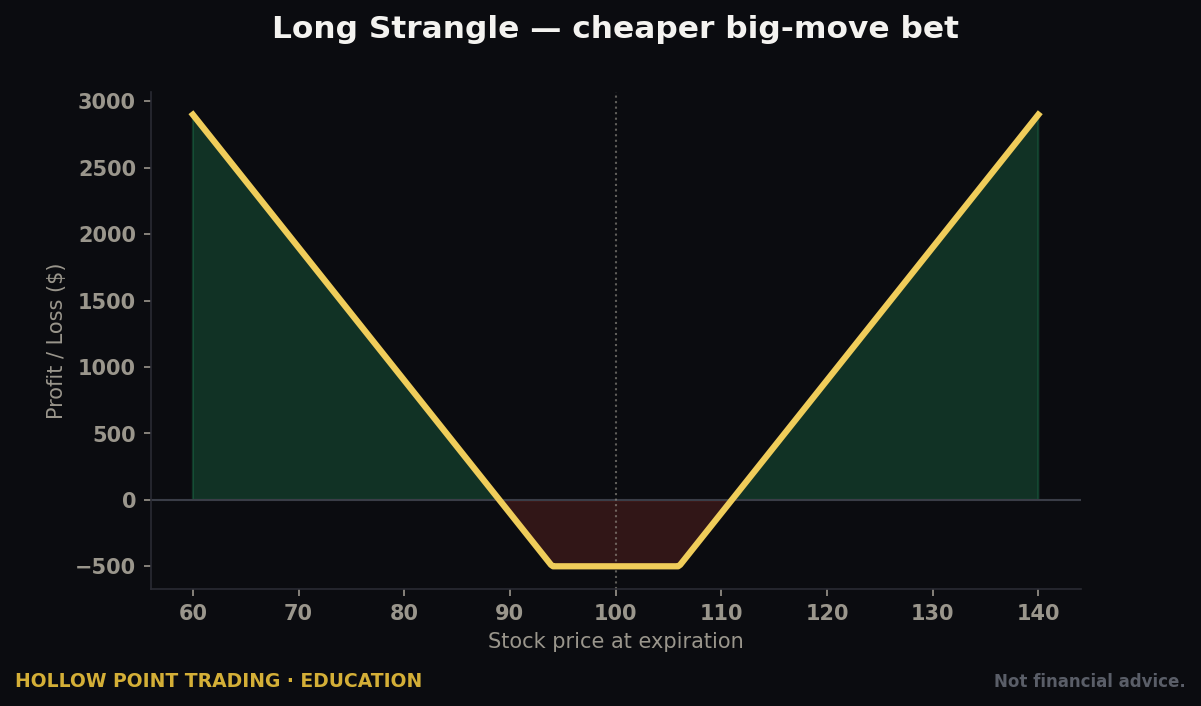
The core concept. Buy a call and a put. If the stock makes a big move either direction, one leg explodes in value and pays for both. Straddle: same strike (usually ATM). Strangle: OTM call + OTM put (cheaper, needs a bigger move).
Worked example (long strangle). Stock at $100, IVR 25, earnings in two weeks. Buy the $105 call ($2.00) and the $95 put ($2.00). Net debit $4.00 ($400).
- Max loss: the debit, $400, if it lands between the strikes and both expire worthless.
- Max gain: unlimited up (call), very large down (put).
- Breakevens: call strike + debit = $109; put strike − debit = $91. You need a move past either to profit.
The expected-move test — do this before every long-vol trade. The reason most straddle buyers lose is that they never check whether the move they need is bigger than the move the market already prices. Here the strangle costs $4.00 and needs a ~9% move to profit. Now look at the ATM straddle: if it's trading at $8 (an 8% expected move), the market already expects almost exactly what you need — you have no edge, you're just paying the going rate for a coin flip. But if the ATM straddle is $5 (a 5% expected move) while your read of the chart and the catalyst says 12% is coming, now you have an edge: you're buying a move the market is underpricing. Never buy volatility without first asking whether it's cheap relative to the move you actually expect.
Ideal IV & regime: LOW IVR, before a known catalyst that the market is underpricing. You want cheap options and an expected fireworks show — a binary event, a coiled multi-month base about to resolve, an FDA decision. Long straddles also shine in the transition from chop to trend: a multi-week Bollinger Band squeeze with IVR at historic lows is the classic "the calm before the storm" long-vol setup — you don't know which way it breaks, only that the coil must eventually release.
Thesis: "Something big happens, I don't know which way." Pure magnitude, long vega, long gamma.
Mistakes: the killer is buying straddles right before earnings when IVR is already 90. Everyone knows the event is coming, IV is jacked, and the "expected move" is baked in. The stock moves 6%, you needed 8% just to break even, and IV crush finishes the job. Buy vol when it's cheap and underpriced, not when the whole world already sees the catalyst.
Short Straddle / Short Strangle — sell the calm
The core concept. The exact inverse. Sell the call and the put, collect fat premium, and win if the stock goes nowhere. This is the highest-octane premium sale — undefined risk on both sides, so it's for experienced, well-capitalized traders only.
Worked example (short strangle). Stock at $100, IVR 80. Sell the $110 call ($2.00) and the $90 put ($2.00). Net credit $4.00 ($400).
- Max gain: the credit, $400, if it stays between $90 and $110.
- Max loss: effectively unlimited up, huge down. This is the naked risk.
- Breakevens: $114 and $86 — a 28-point cushion.
Ideal IV & regime: very high IVR, expecting contraction and chop. You're selling overpriced fear. The textbook window is the aftermath of a volatility spike — the panic day is over, the VIX is elevated but rolling over, and IV is pricing continued chaos that isn't coming. Selling premium into a falling IV from a high base is where the short strangle earns its keep.
Thesis: "It stays boxed and this elevated IV collapses." You're short vol, short gamma, long theta — the condor without training wheels.
Mistake: running it naked without a plan for the tail. One gap through your strike can erase months of credits. The disciplined version is the iron condor — same thesis, defined risk, you sleep at night. Most traders should trade the condor and leave naked strangles to the pros with margin to spare. The math that ruins undefined-risk sellers is asymmetric: you win small amounts frequently and lose enormous amounts rarely, so a single un-hedged tail event can wipe out a year of steady credits. Defined risk isn't timidity — it's the acknowledgment that markets gap, and you can't manage a position while it's 15% against you at the open.
RATIO SPREADS — the surgical add-on
The core concept. A vertical spread with uneven leg counts — classically buy 1, sell 2. Often structured for a net credit or near-zero cost, giving you a directional trade that pays even if you're wrong, with a sweet spot of maximum profit and one naked leg carrying real risk.
Worked example (1×2 call ratio spread). Stock at $100, mildly bullish, IVR elevated. Buy one $105 call ($2.00), sell two $110 calls ($1.00 each = $2.00). Net cost: $0.00 (a costless spread).
- Max gain: at exactly $110 — the long $105 call is worth $5.00, both short $110s expire worthless: +$500.
- Downside risk: if it stays below $105, everything expires worthless — with zero cost, you lose nothing.
- Upside risk: above $110 the extra short call is naked — losses grow past the upper breakeven ($115, i.e., $110 + the $5 max profit). This is the catch.
- Breakevens: lower ≈ $105 (with a debit); upper = $115.
Ideal IV & regime: high IVR (you're a net seller of two options), mildly directional. You expect a grind toward $110 but not a moonshot through it. The ratio spread is the connoisseur's answer to "I'm bullish but I think this particular level caps it." You get paid to be right, you lose nothing if it stalls, and you only get hurt if you were too right and it blew past your target.
Thesis: "Drifts up to about $110 and stalls. If I'm wrong and it goes nowhere, I pay nothing." An elegant way to fund a directional bet with the premium you're selling.
The backspread — the ratio flipped for the opposite thesis. When you want the explosive tail instead of fearing it, invert the ratio: buy 2, sell 1 (a call backspread). Now you're net long options, you have unlimited upside, and you've financed part of the cost by selling the near strike. The backspread is the trade for "I think a violent breakout is coming and I want to be long a lot of gamma, but I don't want to pay full price for two calls." It profits hugely on a big move, loses a defined amount in the "dead zone" between strikes, and is roughly free if the stock collapses. Ratio spread and backspread are the same tool pointed at opposite volatility expectations.
Mistakes: forgetting the naked leg. If the stock rockets past your upper breakeven, that extra short call has unlimited (calls) or large (puts) risk. Size for it, or define it by turning the ratio into a *ratio backspread*** when you actually want the explosive tail. Never put a ratio on and forget which leg is uncovered.
THE WHEEL — the premium-selling flywheel
The core concept. Not one trade — a cycle that chains cash-secured puts and covered calls into a continuous income machine on stocks you're happy to own. This is where the income section comes together into a repeatable system.
The mechanism, step by step:
- Sell a cash-secured put on a quality stock at a strike you'd happily buy. Collect premium.
- If it expires worthless: keep the premium, sell another put. Repeat. (You may never get assigned — that's fine, you're just collecting.)
- If you get assigned: you now own 100 shares at your target price, cost basis already lowered by every premium collected.
- Sell a covered call above your cost basis. Collect premium.
- If it expires worthless: keep it, sell another call. Repeat.
- If it's called away: you sell the shares at a profit, pocket all the premium, and start over at step 1.
Worked cycle. Stock at $100.
- Sell $95 put, collect $150. Expires worthless → repeat, collect another $150. Now +$300.
- Third put: assigned at $95. Cost basis = $95 − $3.00 collected = $92 effective.
- Sell $100 covered call, collect $200 → basis now $90.
- Called away at $100: capital gain from your $92 basis to $100 = $8/share ($800), plus all premiums already baked into that lowered basis. You booked the gain and every credit along the way, then reset.
The one rule that keeps the wheel from becoming a trap. The wheel only works if step 4 is always available — meaning you can always sell a covered call above your cost basis for a worthwhile premium. That breaks the day a stock craters far below your basis: now every call you could sell for real money is below what you paid, so writing it locks in a loss if assigned. This is the wheel's death spiral, and it has a name: getting stuck at the top of the wheel. The defense is entirely in stock selection. Wheel only names that (a) you'd hold through a 30% drawdown without flinching, and (b) have the balance sheet and business to actually recover. The wheel on a blue-chip is an income compounder. The wheel on a story stock is a slow-motion bag-holding machine with extra steps.
Ideal IV & regime: high IVR, on blue-chip or high-conviction names in a neutral-to-bullish market. The wheel is a marathon — it prints steadily in chop and mild uptrends, and its worst enemy is a name that craters and never recovers. In a raging bull market the wheel underperforms buy-and-hold, because you keep getting your winners called away at the strike while the stock runs. That's an acceptable trade — you signed up for steady income, not moonshots — but know that you're leaving upside on the table in exchange for consistency.
Thesis: "I want to accumulate quality stock at discounts and get paid at every step." It's the disciplined income compounder — the covered call and cash-secured put fused into a system.
Mistakes: wheeling meme stocks and biotechs for juicy premium, then eating a 40% gap-down you can't sell calls above without locking a loss. Only wheel names you'd hold through a drawdown. And don't wheel with money you can't tie up — every put needs its cash secured.
Multi-timeframe: reading the chart before you place the legs
An options structure is only as good as the read underneath it, and the read is never one timeframe. The HPT ladder — 1m through monthly — isn't just for scalps; it's how you decide the duration and strikes of an options trade. The principle: the higher timeframe sets the bias, the middle timeframe sets the structure, and the lower timeframe sets the entry.
Match your expiration to the timeframe of your thesis. A 1H flag that resolves in a day or two is a weekly-option or short-dated debit-spread trade. A daily 55-EMA reclaim that plays out over weeks wants 30–45 DTE. A monthly base breakout is a LEAPS or a multi-month diagonal. The single most common structural error is a timeframe mismatch: buying a weekly option on a monthly-chart thesis, then watching theta kill you two weeks before your idea was ever going to pay.
Use the higher timeframe to place the far strikes and the lower timeframe to place the near strikes. On an iron condor, let the weekly chart's range set your short strikes and the daily tell you whether the range is intact today. On a bull put spread, let the daily 55-EMA and prior support define where you sell the put; let the 1H tell you whether now is the moment or whether price is still knifing down. When the timeframes agree — daily bias up, 4H structure up, 1H entry trigger firing — you take a bigger size and a tighter strike. When they conflict — daily up but 4H rolling over — you either wait or you drop to a defined-risk structure and half size. Confluence across timeframes is the same discipline in options that it is in the tape: agreement earns size, conflict earns caution.
Confluence: stacking options structures on the chart tools you already trust
Options don't replace your technical read — they express it. Three combinations that turn a good chart into a good trade:
1. IVR + the Bollinger Band squeeze. A multi-week BB squeeze on the daily is a volatility-compression signal: the bands narrow because realized movement has died. Pair that with a low IVR and you have the highest-quality long-straddle setup that exists — both the statistical (IVR) and the mechanical (band width) measures of volatility agree that it's cheap and coiled. When the bands are pinched to a multi-month narrow and IVR is under 20, you buy the strangle and wait for the release. When the bands are wide open after a big move and IVR is over 70, you do the opposite — sell the condor or strangle into the exhaustion.
2. Support/resistance + credit spread strikes. This is the most direct chart-to-options translation in the book. A horizontal level that has rejected price three times is not a line on a chart — it's the strike where you sell your bear call spread. A demand zone that's held every retest is where you sell your bull put spread. The chart is the strike selector. When a level lines up with a high-open-interest options strike (a gamma wall), the confluence is doubly strong: both the technicals and the dealer positioning are defending that price.
3. The 55-EMA reclaim + long call or debit spread. The HPT signature. A daily 55-EMA reclaim on rising relative strength is a directional trigger. Overlay IVR: reclaim at low IVR → long call or bull call spread (buy the cheap vol on the way up). Reclaim at high IVR → bull put spread instead (sell the rich vol below the level you just reclaimed). Same chart signal, two different structures, and the IVR reading is what tells you which. This is the whole philosophy in one example: the chart picks the direction, the regime picks whether you buy or sell, and the two together pick the structure.
How the pros use these differently from beginners
The strategies are the same. The relationship to them is completely different, and the gap shows up in a handful of habits.
Beginners pick a strategy; pros pick a regime, then a strategy. A beginner wakes up wanting to "trade iron condors" and hunts for a stock to fit. A pro reads IVR first and lets the regime hand them the toolset — high IVR means the sell-premium menu, and then the direction picks the specific structure. The strategy is the last decision, not the first.
Beginners think in single trades; pros think in occurrence counts. A beginner puts on a credit spread and lives or dies by that one outcome, then swears off the strategy after two losses. A pro knows a 70%-win strategy loses three-out-of-ten by design and only judges it over dozens of occurrences. They size so that no single trade matters and let the law of large numbers do the work. This is the deepest divide: amateurs seek to be right, professionals seek to be profitable across a distribution.
Beginners hold for max profit; pros manage winners early. The last 20% of a credit spread's max profit takes disproportionately long to earn and exposes you to a reversal the whole time. Pros take profits at ~50% of max credit and redeploy the capital into a fresh, full-premium trade. Closing early at 50% and re-selling beats grinding one position to the bone — more occurrences, less tail exposure, faster capital velocity.
Beginners let losers run; pros stop mechanically. The single behavior that separates surviving premium sellers from blown-up ones is a pre-committed loss exit — 2x credit received, or the short strike being tested, whatever the rule is — executed without negotiation. Amateurs "give it room" because closing means admitting a loss. Pros closed it three days ago and moved on.
Beginners chase premium; pros respect the tail. A juicy credit on a biotech into an FDA decision is not free money — it's the market paying you appropriately for a real chance of a 40% gap. Pros know that outsized premium is a warning label, not a bargain. They'd rather sell a boring credit on a boring name a hundred times than reach for one fat premium that can end their year.
Beginners ignore vega; pros trade it on purpose. An amateur puts on a calendar for the theta and is baffled when an IV crush kills it. A pro knew the calendar was a long-vega trade going in and chose it because they expected IV to rise. Every structure has a volatility exposure; pros always know the sign of their vega before they click buy.
Beginners size by dollars; pros size by risk. "It's only $300" is how accounts die by a thousand cuts. Pros size every position as a percentage of account risk — commonly 1–5% of buying power at risk per trade — so that a string of losses is a drawdown, not a funeral. Defined-risk structures exist precisely so this math is knowable before entry.
Common mistakes — the full field guide
1. Fighting the volatility regime. Buying premium at IVR 80 or selling it at IVR 15. You can be dead right on direction and still lose to vega. This is mistake zero — every other mistake is downstream of ignoring the master switch. Check IVR before you think about anything else.
2. Buying earnings straddles at peak IV. The classic. The event everyone can see is already priced in; the expected move is baked into the premium, and the post-event IV crush guts both legs even when the stock moves. If the whole world knows the catalyst, the vol is not cheap.
3. Timeframe mismatch. A weekly option on a monthly-chart idea. The thesis was sound; the expiration killed it before the thesis could play out. Match DTE to the timeframe of the setup — always give the trade more time than the move needs, not less.
4. Arbitrary strikes. Selling a put at $95 because it's a round number instead of $94 where actual support sits. The chart places the strikes. A round number is a coincidence; a tested level is information.
5. Oversizing the "cheap" trade. "It's only $300" ten times is $3,000 of theta-bleeding lottery tickets. Size by risk-as-percent-of-account, not by the sticker price of one contract. Cheap-per-unit invites over-quantity.
6. Holding credit spreads to expiration. Chasing the last few dollars of a winner while exposed to a reversal, or holding a loser hoping it comes back. Take winners near 50%, stop losers mechanically. The last 20% of profit is the worst risk-adjusted money on the board.
7. Ignoring the naked leg on a ratio spread. Forgetting that the extra short call carries real, potentially unlimited risk if the stock rockets past the upper breakeven. Always know which leg is uncovered and size for the tail.
8. Selling condors in a trend. Boxing a stock that has no intention of staying in the box. A condor needs chop; a trend walks straight out one wing. Look at the daily structure before selling any range.
9. Wheeling stocks you don't want to own. Chasing fat premium on meme names, then getting assigned at the top and stuck unable to sell calls above your basis. Assignment must be a win. Only wheel names you'd hold through a 30% drawdown.
10. Legging into spreads and getting stuck. Buying the long leg first, planning to sell the short leg "on a bounce," and watching the bounce never come — now you own a naked long bleeding theta. Enter multi-leg trades as a single order at a net price unless you are deliberately and skillfully legging.
11. Confusing a fly with a condor. Selling an iron butterfly on a vague "it'll stay rangey" view. The fly demands a specific pin; without a magnet-level thesis you've taken a much tighter profit zone for no reason. Match the precision of the structure to the precision of your view.
12. Rolling losers into bigger losers. "Rolling out and down" a tested short put to collect more credit and buy time — over and over — until you've quadrupled your risk on a thesis that was wrong from the start. Rolling is a tool for managing a still-valid position, not a way to avoid admitting a bad one. If the reason you sold it is gone, close it; don't roll it.
13. Neglecting liquidity. Trading options on names with wide bid-ask spreads and thin open interest. You pay the spread to get in and to get out, and in a fast market you may not get out at all. Stick to liquid underlyings where the market is tight and you can always exit.
14. Assuming defined-risk means safe-to-ignore. A defined-risk max loss is still a full loss you must survive. Defined risk caps the number; it doesn't make the number small. Size so the defined max loss is a survivable fraction of the account.
FAQ
Which strategy should a beginner actually start with? Cash-secured puts and covered calls, on a blue-chip you'd own anyway, when IVR is elevated. They're the safest way to learn assignment mechanics with real money while the worst case is owning a good company at a discount or selling it at a profit. Master the wheel's two halves before you touch a four-leg condor.
How much capital do I need to run this playbook? Defined-risk spreads can be traded in a small account — a $5-wide credit spread risks a few hundred dollars. The wheel and cash-secured puts need enough to secure 100 shares (five figures for most quality names). Undefined-risk strategies (short strangles) need a large, margin-approved account and should be nowhere near a beginner. Start with defined risk; it's the only way to guarantee one trade can't end you.
What DTE (days to expiration) should I use? For premium selling, the 30–45 DTE window is the sweet spot: enough premium to be worth it, fast enough theta to pay you, and time to manage the trade. For directional debit trades, match DTE to your thesis and give it a cushion — if you think the move takes two weeks, buy 45 days so a delay doesn't kill you. Avoid selling anything under ~21 DTE unless you specifically want the gamma risk; that's where a small adverse move becomes a big loss fast.
When exactly do I take profit and cut losses? The mechanical defaults that keep sellers alive: take profit at 50% of max credit on spreads and condors, and stop out at 2x the credit received as a loss, or when your short strike is decisively breached. For debit trades, define a technical invalidation (the level that proves the thesis wrong) before entry and honor it. The specific numbers matter less than having them written down before the trade, not decided in the heat of a loss.
What actually happens when I get assigned? On a short put, you buy 100 shares per contract at the strike, cash leaves your account, shares appear. On a short call (covered), your 100 shares are sold at the strike. It's not a catastrophe — it's the mechanism. Early assignment is rare and usually only happens on short calls right before an ex-dividend date or on deep-ITM options. If you never want assignment, close short options before expiration or before they go deep ITM.
IV Rank vs. IV Percentile — which do I use? Use IVR as your quick daily read; use IV Percentile when the two disagree, because a single past fear-spike can inflate IVR's range and mislead you. For most decisions in this guide they'll agree, and IVR is the faster reference.
Can I make money if the stock does nothing? Yes — that's the entire point of the income, neutral, and calendar sections. Covered calls, cash-secured puts, iron condors, and calendars all pay you while the stock sits still, harvesting the theta that bleeds the option buyers on the other side of your trade. A directional trader has no answer for a flat market; a complete options trader has four.
What's the one habit that matters most? Position sizing. Every professional edge in this guide is worthless if a single trade can end your account. Size so that the max loss on any position is a survivable fraction of capital, and the strategy math — win rates, managed losers, mean-reverting vol — is allowed to play out over enough occurrences to work.
Cheat-Sheet — the whole playbook on one card
| Strategy | Intent | Debit/Credit | Max Gain | Max Loss | Breakeven(s) | Ideal IVR |
|---|---|---|---|---|---|---|
| Long Call | Bullish, big move | Debit | Unlimited | Debit | Strike + debit | Low |
| Long Put | Bearish, big move | Debit | Strike − debit | Debit | Strike − debit | Low |
| Bull Call Spread | Bullish, capped | Debit | Width − debit | Debit | Long strike + debit | Low–mid |
| Bear Put Spread | Bearish, capped | Debit | Width − debit | Debit | Long strike − debit | Low–mid |
| Covered Call | Neutral-bull income | Credit | Prem + (strike − cost) | Stock risk − prem | Cost − prem | High |
| Cash-Secured Put | Bull, buy lower | Credit | Premium | Strike − prem | Strike − prem | High |
| Bull Put Spread | Bull-neutral income | Credit | Credit | Width − credit | Short put − credit | High |
| Bear Call Spread | Bear-neutral income | Credit | Credit | Width − credit | Short call + credit | High |
| Iron Condor | Range-bound | Credit | Credit | Width − credit | Shorts ± credit | High |
| Iron Butterfly | Pins a price | Credit | Credit | Width − credit | Center ± credit | Very high |
| Calendar/Diagonal | Neutral + long vol | Debit | Variable | Debit | Range around strike | Low front |
| Long Straddle/Strangle | Big move, either way | Debit | Unlimited/large | Debit | Strikes ± debit | Low |
| Short Straddle/Strangle | Chop, sell vol | Credit | Credit | Unlimited/large | Strikes ± credit | Very high |
| Ratio Spread (1×2) | Drift to a target | Credit/flat | Width at short strike | Unlimited tail | Upper = short + max gain | High |
| Call Backspread (2×1) | Explosive breakout | Credit/flat | Unlimited | Defined mid-zone | Upper = short + net | Low–mid |
| The Wheel | Systematic income | Credit | Premiums + gains | Stock to zero | Effective basis | High |
Regime → toolset, at a glance:
| Regime | IVR | Vol behavior expected | Reach for |
|---|---|---|---|
| Coiled / pre-catalyst | Low (<30) | Expanding | Long calls/puts, debit spreads, straddles, strangles, calendars |
| Trending | Any | Directional continuation | Debit spreads, long calls, bull put spreads below rising support |
| Range-bound / chop | High (>50) | Contracting | Iron condors, credit spreads, short strangles, the wheel |
| Pin expected (OPEX/gamma) | Very high | Collapsing to a strike | Iron butterfly, ATM calendar |
| Post-panic | High, rolling over | Falling from a spike | Short strangles, condors, cash-secured puts on quality |
The Greeks in one line each: Delta = direction and rough ITM odds. Theta = time decay, bleeds buyers, feeds sellers. Vega = sensitivity to IV, long options love rising IV. Gamma = how fast delta changes, the grenade near expiration.
The five rules that make any of it work:
- Regime first. IVR over 50 → sell. Under 30 → buy. Don't fight the vol.
- Thesis before structure. Name the direction, magnitude, and timeframe first; the structure is just the sentence that says it.
- Let the chart place the strikes. Levels, not round numbers. Higher timeframe sets the far strikes, lower timeframe times the entry.
- Manage winners early, cut losers mechanically. Take credit trades off near 50%; stop out losers at a pre-set line. Discipline beats prediction every time.
- Never sell a put — or wheel a stock — you wouldn't be thrilled to own. Assignment should be a win, not a trap.
The pre-trade checklist — run it every single time:
- What is IVR? (Buy or sell premium?)
- What is my one-sentence thesis? (Direction, magnitude, timeframe, vol.)
- Does the expected move support this trade? (Glance at the ATM straddle.)
- Where does the chart put my strikes? (Levels, not round numbers.)
- Do my timeframes agree? (Bias, structure, trigger.)
- What is my max loss, in dollars and as a % of account? (Survivable?)
- What is my profit-take and my stop, written down now?
- Which leg, if any, is uncovered — and have I sized for its tail?
Master the two dials, match the structure to the sentence, and size so no single trade can end your season. That's the entire game.
Bound by rules, feared by trade.