
Walk into any serious trading room and you'll notice something. The screens aren't full of AAPL and TSLA. They're full of ticker symbols that start with a slash: /ES, /NQ, /CL, /GC. That's futures. It's where the institutional money hedges, where the fastest speculators play, and where a retail trader with a small account and real discipline can finally trade the index itself instead of a proxy for it.
Futures scare people, and they should — used carelessly, leverage is a wood chipper. But the fear usually comes from not understanding the machine. So let's take the machine apart, bolt by bolt, until it's just a tool. By the end of this you'll understand what a futures contract actually is, how tick math turns price into dollars, why margin cuts both ways, how the pros size in a leveraged product, how the instrument behaves in trending versus choppy versus high-volatility regimes, how to stack it into a multi-timeframe read, and how Hollow Point trades /NQ levels-first.
This is the long version. If you read one guide on futures and never touch another, make it this one. Let's build it up from the concept.
The Core Concept: A Contract, Not a Share
When you buy a share of stock, you own a slice of a company. It's a thing you hold. It pays dividends, it has a book value, it exists on a balance sheet. If the company keeps existing, your share keeps existing. There's no clock on it.
A futures contract is not a thing you own. It's a standardized, legally binding agreement to buy or sell a specific asset, in a specific quantity, at a specific price, on a specific future date. That's the whole idea in one sentence. You're not buying the S&P 500. You're entering an agreement about the S&P 500's price at a point in the future.
Every futures contract has the same DNA:
- An underlying — what the contract is about (the Nasdaq-100 index, crude oil, gold, corn, the euro).
- A contract size / multiplier — how much underlying one contract controls. This is the number that turns index points into dollars, and it's the single most important spec to memorize.
- An expiration — the date the contract settles.
- A settlement method — cash or physical delivery.
The word that trips people up is obligation. If you hold a futures contract to expiration, you are obligated to fulfill it. Long a crude oil contract at expiry? You're technically on the hook to take delivery of 1,000 barrels of oil. This is where the famous "barrels of oil showing up at your house" jokes come from. In practice, no speculator ever gets there — you close the position before expiration, or you're trading a cash-settled product where no physical anything changes hands (more on that below). But the obligation is real, and it's why the exchange makes you post collateral. You're not paying for an asset. You're backing a promise.
Why "agreement" changes everything
Because a futures contract is an agreement and not an asset, two things follow that confuse newcomers.
First, there's a short side that's exactly as natural as the long side. With stock, shorting is an awkward bolt-on: you borrow shares, pay a locate, risk a buy-in. With futures, every contract that exists was created the instant a buyer and a seller agreed — for every long there is a short, by construction. Going short /NQ is not a special maneuver; it's just taking the other seat. This is why futures are the professional's tool for expressing a bearish or hedging view: it's frictionless in both directions.
Second, the number of contracts is not fixed. Shares outstanding are a fixed pie. Futures "open interest" is created and destroyed as traders open and close agreements. When you open a new long and someone opens a new short opposite you, open interest rises by one. When you both close, it falls by one. This matters because open interest and volume together tell you where the real liquidity is living — which contract month the market has actually migrated into, a fact you'll use every quarter at roll time.
The clearinghouse: the quiet genius
The reason futures work at all is standardization. Every /NQ contract is identical — same size, same tick, same expirations, same rules. That standardization is what lets them trade on an exchange (the CME — Chicago Mercantile Exchange — for the big index products) with deep liquidity and a central clearinghouse sitting between every buyer and seller guaranteeing the trade.
When you're long, you don't have to worry about who's short or whether they'll pay. The clearinghouse is your counterparty on every trade. It novates the contract — legally steps in the middle — so your credit risk is to the clearinghouse, not to some anonymous trader in another time zone. To protect itself, the clearinghouse marks every account to market every single day (in practice, continuously) and collects or pays the difference in cash. This daily settlement is why a futures loss shows up in your account immediately rather than as an unrealized paper number that surprises you later. It's a genuinely elegant piece of financial plumbing, and it's why futures are some of the most liquid, transparent markets on earth.
The Product Menu: The Index Futures You'll Actually Trade
Hollow Point trades index futures, so that's where we'll live. There are two tiers: the E-minis (the original, larger contracts) and the Micros (one-tenth the size, launched by CME in 2019 to let smaller accounts play). Same underlying, same price, same chart — just a different multiplier.
Here are the four index families and their specs. Burn this table into your memory:
| Product | Symbol | Underlying | Multiplier | Tick Size | Tick Value |
|---|---|---|---|---|---|
| E-mini S&P 500 | /ES | S&P 500 | $50 × index | 0.25 pt | $12.50 |
| Micro E-mini S&P | /MES | S&P 500 | $5 × index | 0.25 pt | $1.25 |
| E-mini Nasdaq-100 | /NQ | Nasdaq-100 | $20 × index | 0.25 pt | $5.00 |
| Micro E-mini Nasdaq | /MNQ | Nasdaq-100 | $2 × index | 0.25 pt | $0.50 |
| E-mini Dow | /YM | Dow Jones | $5 × index | 1 pt | $5.00 |
| Micro E-mini Dow | /MYM | Dow Jones | $0.50 × index | 1 pt | $0.50 |
| E-mini Russell 2000 | /RTY | Russell 2000 | $50 × index | 0.10 pt | $5.00 |
| Micro E-mini Russell | /M2K | Russell 2000 | $5 × index | 0.10 pt | $0.50 |
The Micro is exactly 1/10th of its E-mini sibling in every dimension. Ten /MNQ contracts equal one /NQ. This matters enormously for position sizing — the Micros let you size precisely instead of in giant jumps, and they're where nearly every new futures trader should start.
The multiplier is the magic number. When the Nasdaq-100 index moves 1.00 point, one /NQ contract makes or loses $20, and one /MNQ makes or loses $2. Everything downstream — tick value, margin, P&L — flows from that multiplier. Learn it and the rest is arithmetic.
The four indices have four personalities
Picking a product isn't only about size. Each index moves with a different character, and matching your temperament and account to the right one is an underrated decision.
- /ES (S&P 500) is the deepest, most liquid index future on the planet. Tightest spread (usually one tick), the most orderly tape, the friendliest place to learn how price behaves at a level. It's broad — 500 names across every sector — so it moves smoothly and respects levels cleanly. If you want the "textbook" behaves-like-the-book instrument, it's /ES.
- /NQ (Nasdaq-100) is the growth-and-tech animal. Roughly 100 names, heavily weighted toward mega-cap tech, so it's more volatile, ranges wider, and trends harder than /ES. It's the momentum trader's favorite and the level-trader's proving ground — the moves are bigger, the reactions at levels are more violent, and the dollars come faster in both directions. Hollow Point lives here.
- /YM (Dow) is 30 large-cap, price-weighted names. It quotes in whole points (a 1-point tick), which makes the mental math feel different, and it often lags the tech-driven tape. Some traders like it precisely because it's a little slower and less whippy than /NQ.
- /RTY (Russell 2000) is small caps — the domestic, rate-sensitive, higher-beta corner of the market. It can lead risk sentiment (small caps often turn first) but it's thinner and jumpier, with a wider spread. It's a specialist's instrument, not a beginner's.
A useful rule of thumb: the correlation between /ES and /NQ is high but not perfect, and the gap between them is information. When /NQ is ripping while /ES drags, tech is leading and risk appetite is narrow. When /RTY leads /ES higher, breadth is broadening and the rally has legs. You'll use these relationships later, in the confluence section.
Notional value: the size you're really holding
One more concept before we leave the menu. The notional value of a contract is the full dollar value of the underlying it controls — index level × multiplier. It's the number that tells you how big your position actually is, regardless of how little margin you posted to hold it.
- One /MNQ with the Nasdaq at 20,000 → 20,000 × $2 = $40,000 notional.
- One /NQ at the same level → 20,000 × $20 = $400,000 notional.
- One /MES with the S&P at 5,600 → 5,600 × $5 = $28,000 notional.
Say it out loud: holding a single /NQ contract means you are effectively long $400,000 of the Nasdaq-100. That is the number to keep in front of your face, because that — not the few hundred dollars of margin — is what's moving under you.
The Mechanism: Tick Size and Tick Value
Prices don't move in a smooth continuum. They move in minimum increments called ticks. The tick size is the smallest price change the exchange allows; the tick value is what that increment is worth in dollars.
Take /MNQ, the Micro Nasdaq — the on-ramp contract. Its tick size is 0.25 index points, and its multiplier is $2. So:
Tick value = tick size × multiplier = 0.25 × $2 = $0.50 per tick.
Every 0.25-point flicker on the /MNQ chart is 50 cents in your pocket, per contract. There are four ticks in every full index point (1.00 ÷ 0.25 = 4), so a full point is $2.00 on /MNQ — which is just the multiplier, as it should be.
Now scale it up. On /NQ, the E-mini, tick size is also 0.25 but the multiplier is $20, so each tick is $5.00 and each full point is $20. Same chart, same 0.25 flicker — but ten times the dollars.
Let's make it concrete with a worked example. Say you go long one /MNQ contract at 20,000.00 and the Nasdaq-100 rallies to 20,050.00.
- Points gained: 20,050.00 − 20,000.00 = 50.00 points
- In ticks: 50.00 ÷ 0.25 = 200 ticks
- Dollars: 200 ticks × $0.50 = $100 — or check it the fast way: 50 points × $2 multiplier = $100. ✔
Same move on one /NQ instead: 50 points × $20 = $1,000. Same chart, same trade idea, ten times the risk and reward. That's the entire relationship between the Micro and the E-mini in one comparison.
The fast mental math: dollars = points moved × multiplier. Memorize the multiplier for the product you trade, and you can compute any P&L in your head. On /MNQ it's ×2. On /MES it's ×5. On /NQ it's ×20. On /ES it's ×50. That's it.
A tick-math worked example for every product
Let's drill it so it's reflexive. Assume a 40-point favorable move on each index and compute the dollars per contract:
- /ES: 40 pts × $50 = $2,000. (In ticks: 40 ÷ 0.25 = 160 ticks × $12.50 = $2,000. ✔)
- /MES: 40 pts × $5 = $200.
- /NQ: 40 pts × $20 = $800.
- /MNQ: 40 pts × $2 = $80.
- /YM: a Dow move is quoted differently — say 300 Dow points × $5 = $1,500. (Note the 1-pt tick here: 300 ticks × $5 = $1,500. ✔)
- /RTY: 20 pts × $50 = $1,000. (Its tick is 0.10, so 20 ÷ 0.10 = 200 ticks × $5 = $1,000. ✔)
Notice /YM and /RTY have their own tick sizes — 1.0 and 0.10 — so "ticks per point" differs. But the master formula never changes: dollars = points × multiplier. Keep that one equation and you never need a P&L calculator again.
Why the spread is a tick, and why that's a cost
The bid-ask spread in a liquid future is usually one tick wide. On /ES that's $12.50 per contract; on /MNQ it's $0.50. Every time you cross the spread to get filled at market, you pay roughly that. It sounds trivial until you overtrade: 20 round-trips a day on /NQ, crossing the spread each way, is 40 × $5 = $200 of pure friction before commissions — every single day. This is the quiet math behind "the A-setups only" discipline. The spread is a tax on activity, and futures make activity dangerously easy.
Margin: Why the Leverage Cuts Both Ways
Here's the part that makes futures dangerous and powerful at the same time.
When you buy $10,000 of stock, you post $10,000 (or $5,000 on 2:1 stock margin). When you trade a futures contract, you don't pay for the underlying at all — you post a performance bond, a good-faith deposit that covers likely losses. The exchange calls it margin, but it's not a loan the way stock margin is. It's collateral against your obligation.
Two numbers matter:
- Initial margin — what you must have in the account to open one contract.
- Maintenance margin — the minimum equity you must keep to hold it. Drop below this and you get a margin call: add funds or the position gets liquidated, often automatically.
Exchanges set base margins; brokers often set higher ones. And for day trades (positions closed before the session's end), many brokers offer dramatically reduced day-trade margin — sometimes a few hundred dollars or less per Micro. Overnight, the full initial margin snaps back.
Rough, illustrative numbers (they float with volatility and vary by broker — always check yours):
- /MNQ (Micro Nasdaq): overnight initial margin often around $2,000–$2,500 per contract; intraday day-trade margin as low as ~$100–$500.
- /NQ (E-mini Nasdaq): overnight initial margin often around $20,000–$25,000 per contract; intraday far less.
Now watch the leverage appear. One /MNQ at an index level of 20,000 controls a notional position of:
20,000 × $2 multiplier = $40,000 of Nasdaq-100 exposure.
If your day-trade margin to hold that is $500, you're controlling $40,000 with $500 — 80:1 leverage. Even at the full overnight margin of ~$2,000, you're at roughly 20:1. Compare that to a stock trader capped at 2:1, or an unleveraged cash account at 1:1. This is why the pros use futures for capital efficiency: a small amount of collateral controls a large, liquid position.
And this is exactly why it cuts both ways. Leverage is a multiplier on the outcome, not a favor. Let's run both directions on one /MNQ from an entry of 20,000, holding on ~$500 of day-trade margin:
- It goes your way, +100 points to 20,100: 100 × $2 = +$200. On $500 of posted margin, that's a +40% return on collateral in one move.
- It goes against you, −100 points to 19,900: 100 × $2 = −$200. On $500 of posted margin, that's a −40% hit — and you're now near maintenance, staring at a margin call or an auto-liquidation.
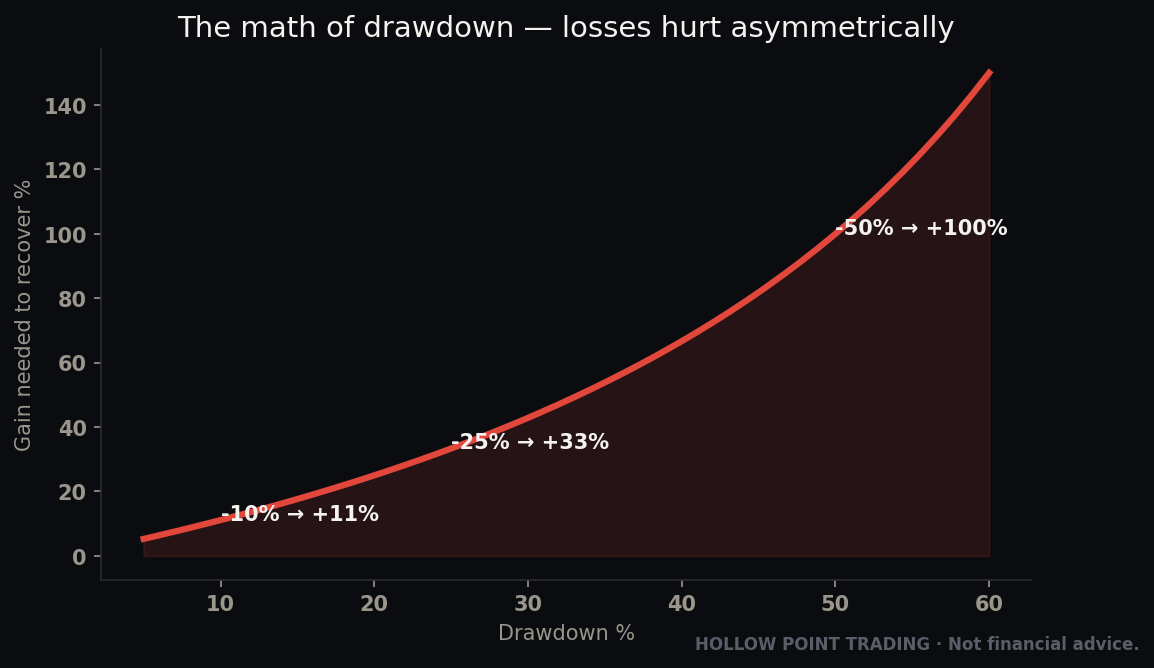
A 100-point move on the Nasdaq-100 is nothing — it can happen in minutes on a busy morning. The instrument doesn't care which way you're positioned. It amplifies your correct reads and your mistakes with perfect indifference. New traders hear "80:1 leverage" and think opportunity. Survivors hear it and think this is why I size small and set a stop before I click.
The margin is not your risk. Your stop is your risk. The margin just determines how many contracts the broker will let you hold. Confusing the two — sizing to your buying power instead of to your stop — is how accounts die. We'll fix that in the risk section.
The margin call, step by step
Abstractions kill; let's watch one happen. Account equity: $3,000. You hold two overnight /MNQ, each requiring, say, $2,200 initial and $2,000 maintenance — so $4,000 maintenance for the pair. Wait — you can't even hold two overnight on $3,000; the broker would block the second. So let's say you hold one, initial $2,200, maintenance $2,000.
You're long one /MNQ at 20,000 overnight. Bad Asian-session headline. Price drops 500 points to 19,500 while you sleep.
- Loss: 500 × $2 = −$1,000.
- New equity: $3,000 − $1,000 = $2,000.
- You're now exactly at maintenance. One more tick down and you're under it → margin call.
At this point the broker can, and in fast markets will, auto-liquidate — sell your contract at market, wherever the market is, to protect itself. You don't get a polite phone call and a day to wire funds; you get a fill. This is the overnight-gap risk the higher overnight margin exists to price. Now re-run it with a hard stop at 19,900: you're out for a 100-point, −$200 loss long before the account is ever threatened. The stop is what stands between a bad trade and a blown account.
Prop firms and evaluation accounts
Many newer futures traders don't trade their own capital at all — they trade a funded / evaluation account from a prop firm, where you pay a fee, pass a profit-target-and-drawdown test on a simulated account, and then trade the firm's capital for a payout split. The mechanics of tick math, margin, and sizing in this guide apply identically. But note the added constraint: these accounts enforce a hard trailing drawdown that ends your account the instant equity dips below a moving threshold. That makes the discipline in this guide not just advisable but existential — one oversized, no-stop trade fails the account outright. If you trade funded, treat the drawdown line as a second, unforgiving stop wrapped around your whole account.
Nearly 24 Hours: The Session
Stocks trade 9:30 a.m. to 4:00 p.m. ET and then go dark. Index futures trade nearly around the clock, Sunday evening through Friday afternoon. On CME Globex, the electronic session runs roughly Sunday 5:00 p.m. CT to Friday 4:00 p.m. CT, with a short daily maintenance halt each afternoon (around 4:00–5:00 p.m. CT).
This changes how you trade in three concrete ways:
- You can react to overnight news. A geopolitical shock at 2 a.m., an Asian session selloff, a European open — futures price it in immediately. Stock traders wake up to a gap; futures traders lived through it. This is also why futures are the premier hedging tool: if you're long a stock portfolio and something breaks after hours, you can short /ES right now instead of waiting for the bell.
- Sessions have personalities. The Asian session (evening CT) is typically thin and range-bound. London (early morning CT) brings the first real volume. The New York cash open (8:30 a.m. CT) is where the day's character usually gets set. Volume and volatility are not evenly distributed across those 23 hours, and where a level was tested — in thin overnight tape or heavy NY tape — changes how much it means.
- Overnight risk is real risk. Hold a position through the night and you're exposed to every headline while you sleep, with thinner liquidity meaning wider, faster moves. This is why many futures day traders are flat by the close — and why overnight margin is higher than day-trade margin. The exchange is pricing the gap risk you're taking on.
The three sessions in detail
Think of the 23-hour day as three acts, each with its own liquidity and its own trap.
- Asia (roughly 5:00 p.m.–2:00 a.m. CT). Thin. Ranges are narrow, and a "breakout" here often means almost nothing because so few contracts printed it. A level established in Asia is a soft level. The trap: mistaking a low-volume overnight push for real directional intent.
- London (roughly 2:00 a.m.–7:00 a.m. CT). The first heavy volume of the day arrives. European desks take positions, and the overnight range often gets resolved here. A move that London confirms with volume carries real weight into the New York open. The overnight high and low you'll draw on your chart usually get their meaning from this window.
- New York (8:30 a.m. cash open onward, CT). The main event. U.S. economic data drops at 7:30–9:00 a.m. CT, the cash equity market opens at 8:30 CT, and the day's true character is usually set in the first 60–90 minutes. The opening range — the high and low of roughly the first 15–30 minutes — becomes one of the most-watched intraday structures on the board. Most of the day's clean, high-conviction level reactions happen while New York volume is on.
The practical takeaway: weight a level by the volume that formed it. A prior-day high tested in heavy NY trade is a wall. The same nominal price tapped once at 3 a.m. on a handful of contracts is a whisper. Two levels at the same number are not equal if one was built in daylight and the other in the dark.
Contract Months and the Roll
Because a futures contract has an expiration, the ticker you trade is really a family of contracts, one per expiration month. Index futures expire quarterly, on the third Friday of March, June, September, and December. The industry uses single-letter month codes:
- H = March
- M = June
- U = September
- Z = December
So "NQZ5" is the December 2025 Nasdaq contract; "ESH6" is the March 2026 S&P. Your platform usually hides this behind a continuous symbol (/NQ, /ES) that auto-points at the current contract, but the individual contracts are what actually trade.
At any time, one contract — the front month — holds nearly all the volume and liquidity. As it approaches expiration, traders migrate to the next quarter. That migration is the roll. You close your position in the expiring contract and reopen it in the next one (say, from ESU5 to ESZ5) so you're never caught holding into expiration and you're always in the liquid contract.
The practical rules: roll about a week before expiration, typically the week of the second Friday of the expiration month, once volume in the back month exceeds the front. The two contracts trade at slightly different prices (the spread reflects carrying costs and dividends), which is why your charting platform offers "continuous adjusted" data — it splices the contracts together and smooths the price gaps so your historical levels stay meaningful. Miss the roll and you'll find yourself trading a dead, illiquid contract with terrible fills. Set a calendar reminder for expiration week and you'll never think about it again.
Why the two contracts trade at different prices
It surprises people that ESU5 and ESZ5 don't print the same number at the same instant. The gap is the basis — the cost of carrying the position to the later expiration. For equity index futures it mostly reflects short-term interest rates (the cost of financing the notional) minus expected dividends over the period. When rates are meaningfully above dividend yield, the further-out contract trades above the nearer one. This spread is small relative to daily ranges and it doesn't affect your directional trade, but it's why your charted levels need continuous-adjusted data: without it, a clean support line drawn last month suddenly looks off by 30 points after the roll, purely because you switched contracts. Set your charts to continuous adjusted and the problem disappears.
A concrete roll checklist
- Expiration week arrives (week of the third Friday, Mar/Jun/Sep/Dec). Watch volume: when the back month's volume overtakes the front, the market has voted.
- Close your open position in the expiring contract at a moment of your choosing — not at the last second on expiration day.
- Reopen the same directional exposure in the new front month. Your size and thesis are unchanged; only the contract code changes.
- Re-verify your drawn levels against continuous-adjusted data so nothing shifted.
- Confirm your platform's continuous symbol (/NQ) is now pointing at the new front month before you place your next order.
Do this once and it takes ninety seconds. Skip it and your next market order fills three ticks wide in a ghost-town contract.
Cash Settlement: No Barrels, No Certificates
Remember the "obligation to deliver" problem? For index futures, it's solved elegantly: they're cash-settled. There is no Nasdaq-100 index to physically deliver — it's a number, not a warehouse of goods. So at expiration, any open contract is simply marked to the final settlement value, and the difference is paid in cash. Winners get credited, losers get debited, done.
This is a huge practical advantage. A crude oil trader who forgets to close before expiry has a genuine delivery problem. An /NQ trader who forgets just gets cashed out at the settlement price. It's cleaner, and it's one more reason index futures are the friendly end of the futures pool for speculators. (Note the distinction: many commodity futures are physically settled, which is why oil, gold, and grain traders are religious about closing or rolling before expiration.)
The settlement print and "triple witching"
The quarterly settlement isn't a casual event. The final settlement value for the big equity index futures is derived from a special opening quotation on expiration Friday, and that morning is when index futures, index options, and single-stock options all expire together — the market nickname is triple witching. Volume balloons as enormous positions get closed, rolled, or exercised, and price can behave strangely around the open as that machinery settles. You don't need to trade it, and as a newer trader you probably shouldn't take fresh directional risk into that specific print. Just know why the tape gets weird four Fridays a year, and that by then you should already be rolled into the next quarter anyway.
Futures vs. Stocks vs. Options
Three ways to express a directional view. Here's how futures stack up:
Versus stocks:
- No Pattern Day Trader rule. The PDT rule caps under-$25k stock accounts at three day trades per five days. Futures are exempt entirely — day trade a small futures account as often as you like. For active traders with limited capital, this alone is a reason to be in futures.
- Capital efficiency. One /MES controls ~$28,000–$30,000 of S&P exposure on a few hundred dollars of day-trade margin. Replicating that in shares (SPY) ties up far more capital.
- True 24-hour access and the cleanest possible index exposure — you're trading the index, not an ETF wrapper with its own tracking quirks.
Versus options:
- No time decay, no implied volatility to model. An option is a decaying, multi-variable instrument — you can be right on direction and still lose to theta or an IV crush. A futures contract is pure, linear, delta-1 exposure: one point is one point, today or next week. What you see is what you get.
- Simpler mental model. No Greeks, no strike selection, no expiration-week gamma games. Price goes up, long makes money; price goes down, short makes money. That linearity is a feature for directional traders.
- The trade-off: options give you defined risk (a long option can't lose more than its premium). A naked futures position's loss is bounded only by your stop and your discipline — which is precisely why the stop is non-negotiable.
The tax angle — the 60/40 rule. This is one of the most underrated advantages, and it's specific to U.S. traders. Index futures are Section 1256 contracts. Regardless of how long you hold them — one minute or one month — gains are taxed 60% at the long-term capital gains rate and 40% at the short-term rate. Contrast that with stocks, where anything held under a year is taxed 100% at your (higher) short-term ordinary-income rate. For an active trader, that blended 60/40 treatment can be a meaningful edge on the after-tax bottom line. (Not tax advice — talk to a professional about your situation — but know the rule exists, because most new traders don't.)
When each instrument is actually the right tool
The honest answer is that they're complementary, and a complete trader knows when to reach for which.
- Reach for futures when you have a clean directional read on the index and want linear, capital-efficient exposure with no decay working against you — the bread-and-butter intraday and swing directional trade.
- Reach for options when you want defined risk (buying a call/put so your max loss is the premium), when you want to express a view on volatility itself, or when you want to structure asymmetric payoffs around an event. If you can't stomach the open-ended downside of a naked futures position, a long option is the disciplined alternative — you trade some efficiency and eat theta in exchange for a hard floor under your loss.
- Reach for shares/ETFs when you want to hold for the long term, collect dividends, or size a position so small that futures' minimum increment is too coarse.
Hollow Point's default for active index trading is futures — the linearity and efficiency fit a levels-and-reaction process — but "futures for everything" is a beginner's overreach, not a rule.
How the Instrument Behaves Across Market Regimes
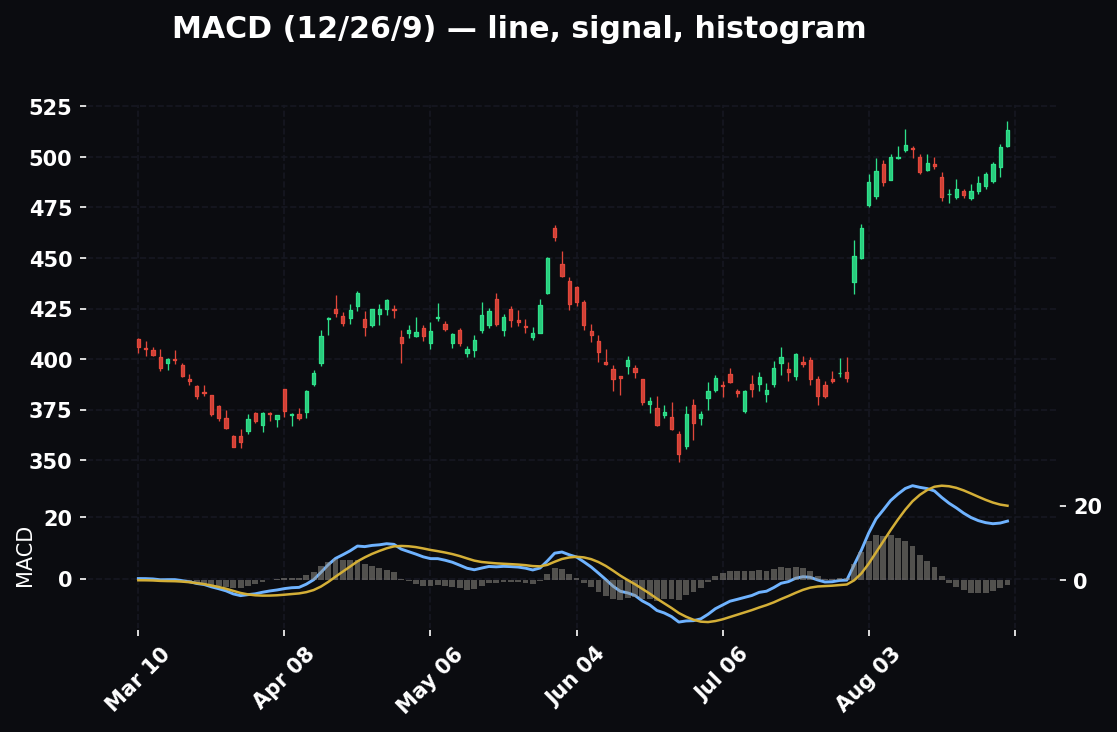
The same contract feels like a different animal depending on the regime. Reading the regime first is what separates traders who adapt from traders who keep running one playbook into a market that stopped rewarding it.
Trending regime
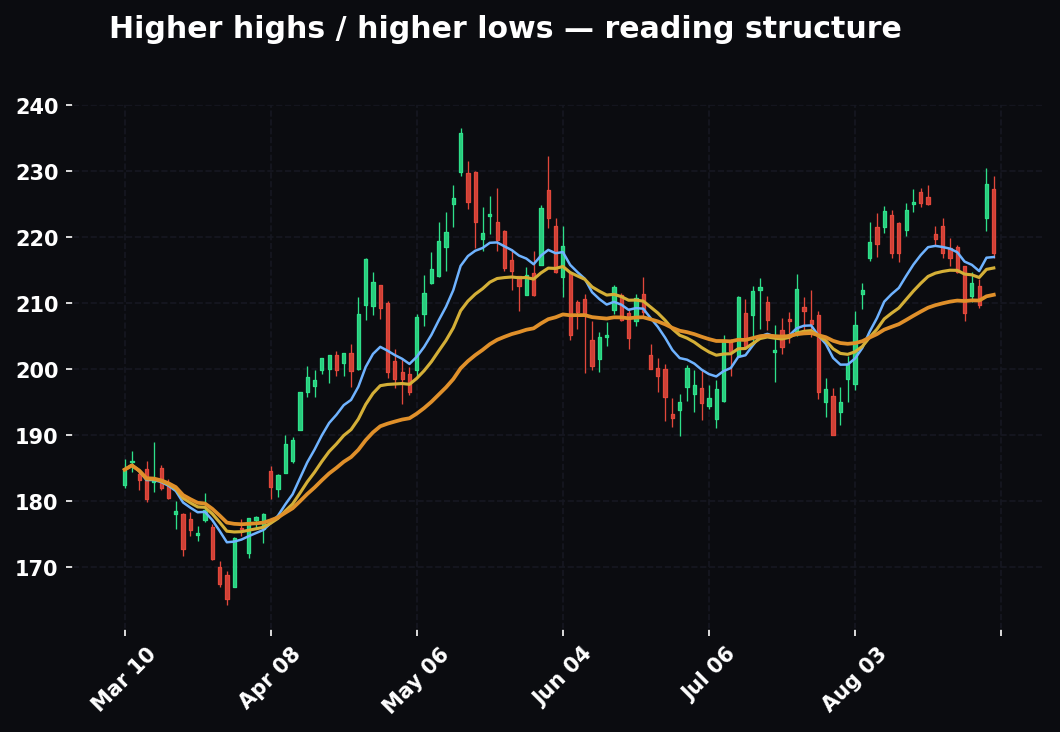
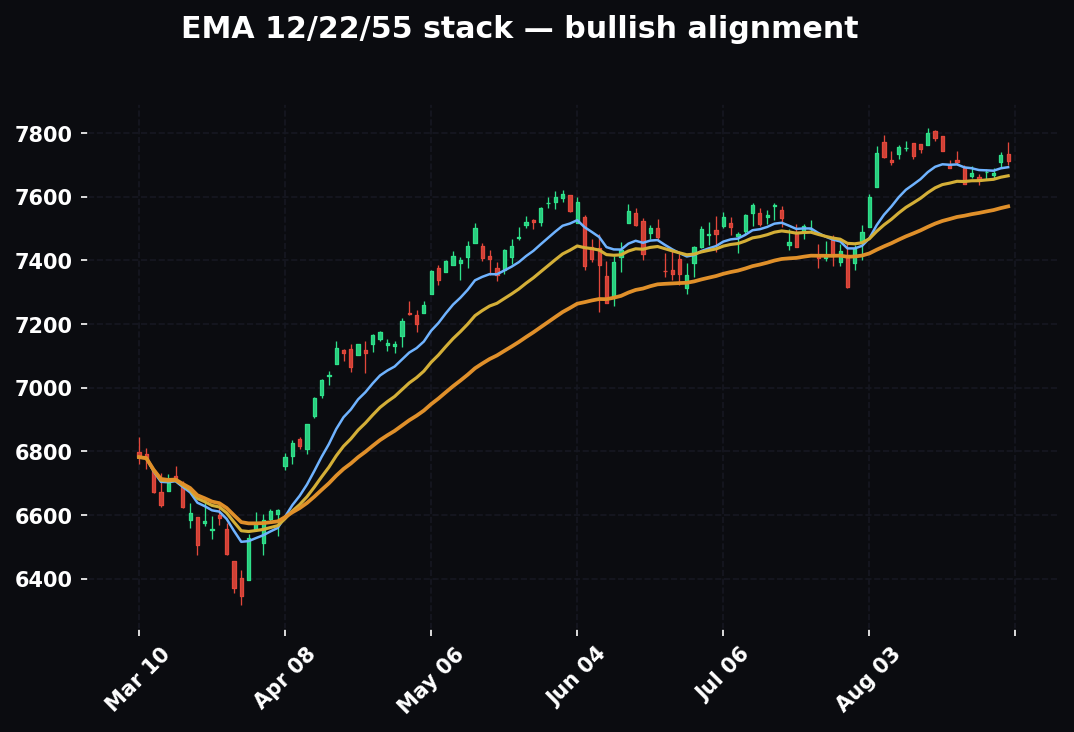
In a clean trend — higher highs and higher lows on the daily, price riding above rising moving averages — /NQ pulls back to levels and launches off them. Reactions at support in an uptrend are sharp and follow through. This is where the 1:3 (and better) reward-to-risk targets get hit routinely, because the trend carries price well past your first target. In a trend, your job is to buy pullbacks to confluence in the direction of the trend and give the winners room. Counter-trend scalps exist but are the exception; the trend regime rewards patience and full targets.
Choppy / range regime
In a range — price oscillating between a defined high and low, moving averages flat and tangled — the exact same "reaction at support" that launched in a trend now fades. Price taps support, bounces halfway across the range, and rolls over. In chop, the edges of the range are the trade and the middle is no-man's-land. Targets shrink: instead of 1:3 to the moon, you're taking the measured move to the opposite side of the range and getting out. The killer mistake here is trading a trend playbook in a range — buying a "breakout" that is really just a tag of the range high, and getting faded right back. In chop, breakouts are guilty until proven innocent, and the money is in fading the extremes back toward the middle.
High-volatility regime
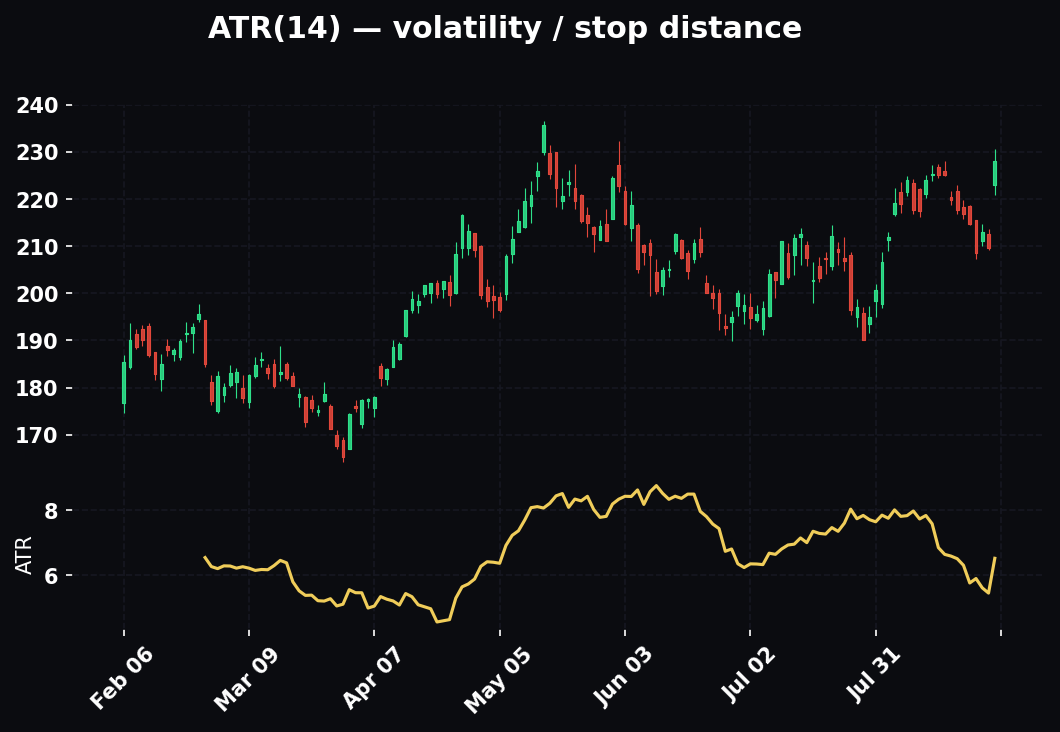
When realized volatility spikes — a CPI print, an FOMC decision, a geopolitical shock — the character changes again. Ranges double or triple, stops that were sane yesterday get run in seconds, and the spread can widen beyond one tick. Two things must adjust: your stop distance and your size. If the average bar just tripled in range, a 25-point stop that was comfortable in calm tape is now inside the noise and will get tagged on a random wiggle. You widen the stop to survive the noise — and because risk-per-contract just went up, you cut size to keep dollar risk constant. This is the crucial insight most blow-up stories miss: when volatility rises, you trade smaller, not the same. The margin the broker requires often rises in these regimes precisely because the exchange sees the same danger.
Reading the regime before you trade
You don't need a fancy model. Three quick reads tell you the regime:
- Daily structure — HH/HL (uptrend), LH/LL (downtrend), or overlapping bars in a band (range).
- Moving-average posture — stacked and sloping (trend) vs flat and intertwined (chop).
- The VIX and the recent daily range — elevated and expanding (high-vol) vs low and contracting (calm).
Name the regime out loud before you draw a single level, and let it set both your target expectations and your stop-and-size math. A level means something different in each regime; the level is the where, the regime is the how it'll behave.
Multi-Timeframe: Stacking the Read
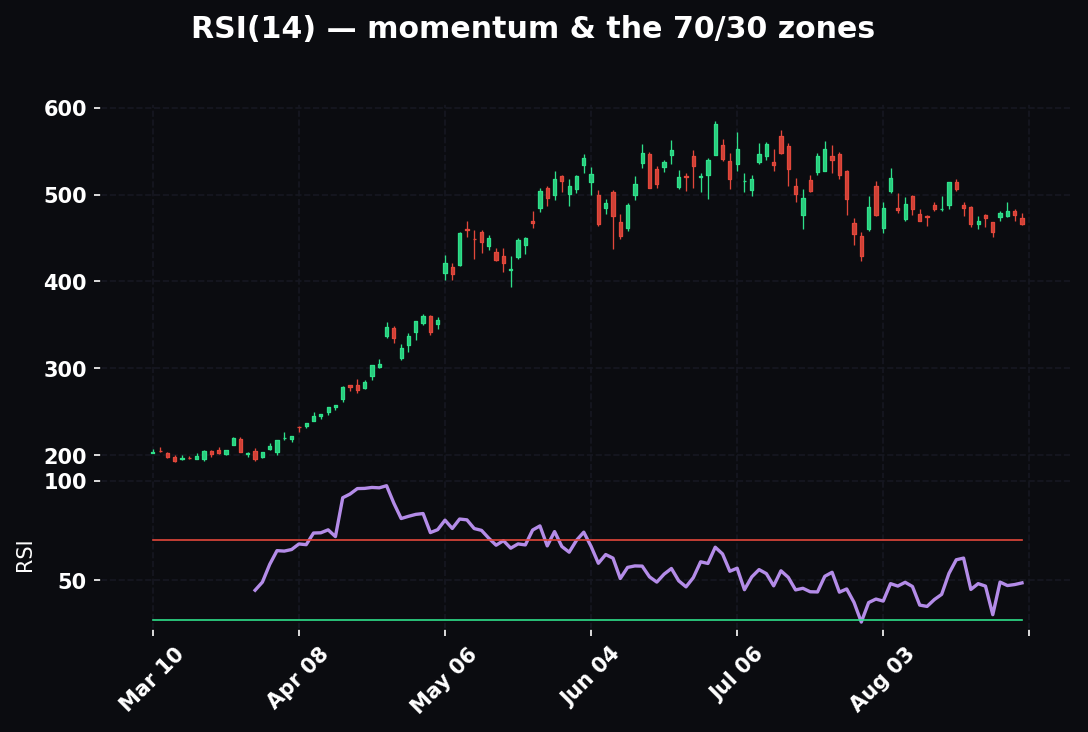
A futures level is only as strong as the timeframes that agree on it. Trading a single chart in isolation is how you get chopped up — the 1-minute is noise; the story lives in the stack.
The Hollow Point ladder runs from the 1-minute all the way to the monthly, and the principle is simple: higher timeframes set the bias and the walls; lower timeframes set the entry and the stop.
- The daily and weekly tell you the regime and the levels that actually matter — the walls institutions defend.
- The hourly and 15-minute refine those walls into a tradeable zone and show you the intermediate structure.
- The 5- and 1-minute are where you time the entry: you wait for the reaction at the higher-timeframe level to show up on the lower timeframe (a rejection wick, a lower-timeframe structure break, a volume surge) before you click.
The trap is inverting this — letting a 1-minute signal override a daily wall. If the daily says price is pinned under major resistance and the 1-minute flashes a long, the daily wins. You trade with the higher timeframe or you stand aside. The best trades are the ones where every rung of the ladder points at the same price — and those are rare enough that recognizing one is most of the edge.
A worked multi-timeframe alignment
Suppose on /NQ:
- Daily: price is pulling back within a clear uptrend to a support shelf at 20,000, which was prior resistance now flipped to support.
- 4-hour: the pullback is three clean legs into that shelf — a healthy correction, not a breakdown.
- 1-hour: a volume point-of-control sits at 20,010, right on top of the daily shelf.
- 15-minute: price is basing, printing higher lows into the zone.
- 5-minute: a bullish engulfing candle fires off 20,000 on a volume surge — the reaction.
That's a stacked long: four higher timeframes pointing at ~20,000, and the 5-minute giving you the trigger and the stop (below the engulfing low). This is the setup you wait days for. When the ladder aligns like this, it isn't a coincidence — it's the whole market's attention converging on one price.
How a Real Trader Uses It: The HPT Levels-First Approach on /NQ
Now the part that matters. Specs don't make money — a repeatable process does. Here's how Hollow Point actually approaches /NQ, and it starts nowhere near the tick chart.
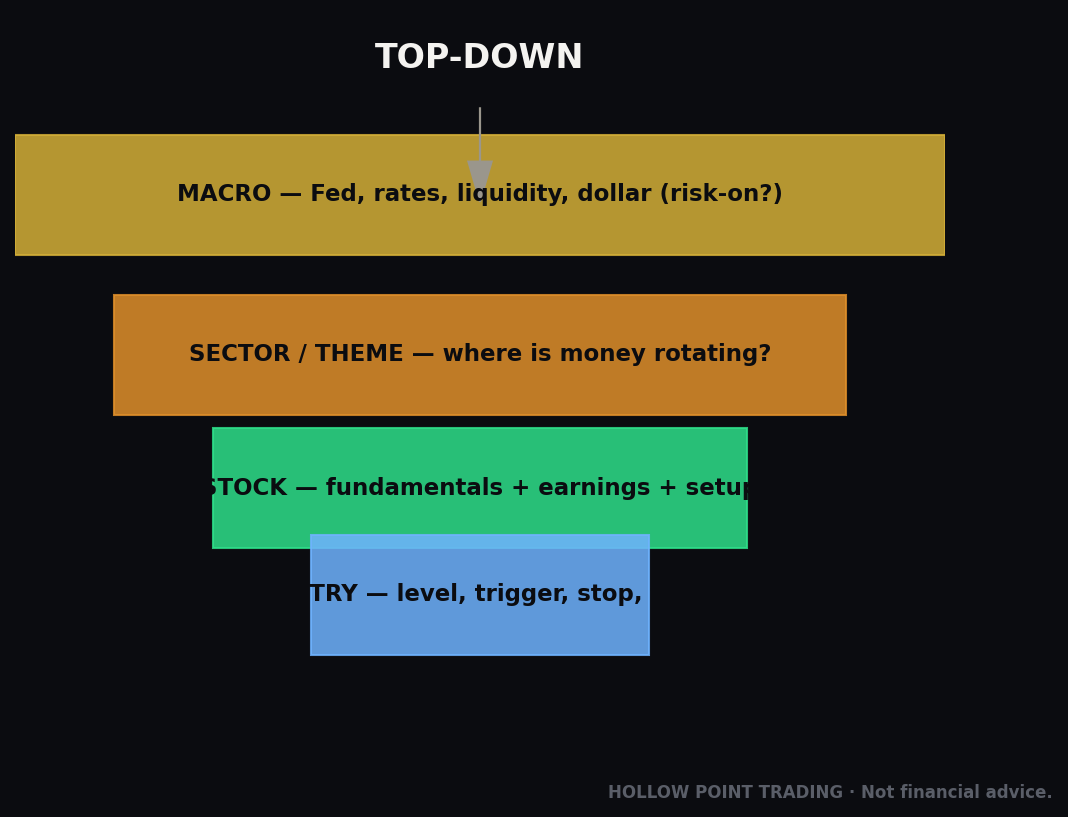
Top-down, macro → sector → instrument. Before a single level gets drawn, the question is what is the environment. What are yields doing? Is the dollar bid? Where's the VIX? Is tech leading or lagging the tape? /NQ is the Nasdaq-100 — a growth-and-tech animal — so it lives and dies on rates and risk appetite. If the macro says risk-off and tech is the weakest sector on the board, a long /NQ scalp is fighting the current, and you'd better have a very good level to justify it. Context sets the bias; the bias tilts which trades you take and which you skip.
Levels first, always. HPT doesn't chase indicators — it maps the battlefield before the open. Prior day high and low. Overnight high and low. The session's opening range. The volume profile's point of control and value area. Round numbers the whole market watches. These are drawn on the chart before the bell as lines that matter, because they're where liquidity actually sits — where stops cluster, where big players defend. Price approaching a level is information. Price reacting at a level is a trade.
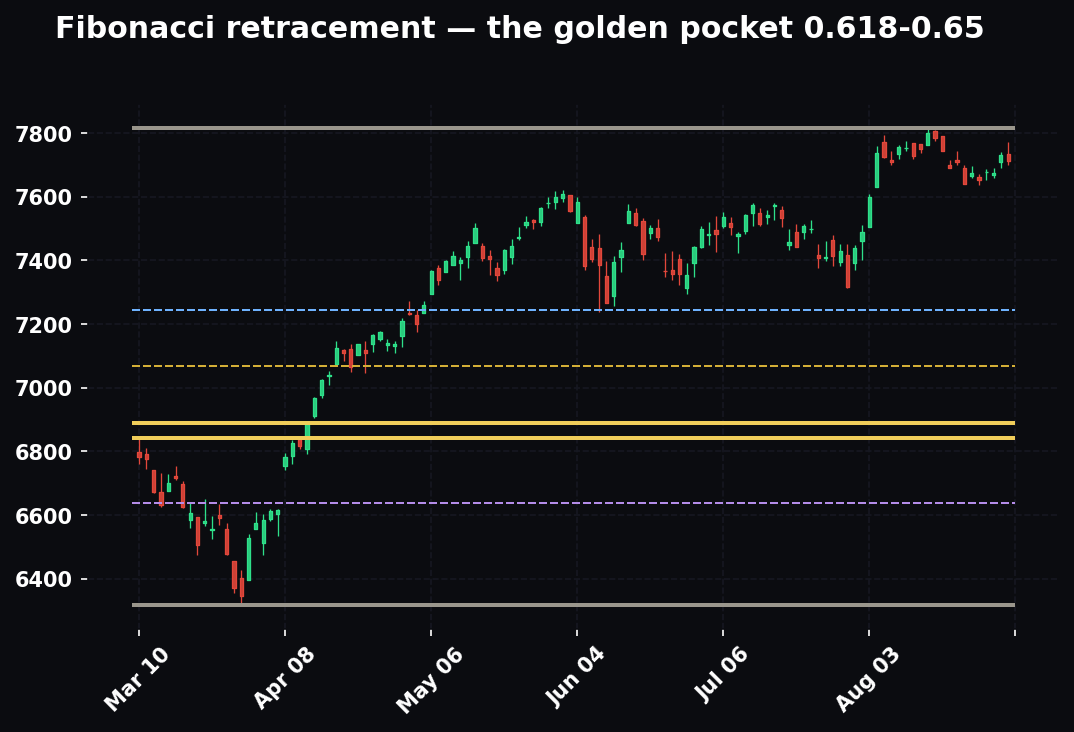
Timeframe-weighted confluence. A level on the 1-minute chart is a rumor. That same level confirmed on the 15-minute, the hourly, and the daily is a wall. HPT weights higher timeframes more heavily — a daily level beats an hourly beats a 5-minute, every time. The best setups are where multiple timeframes point at the same price: the daily support, the overnight low, and the volume point of control all stacking within a few points. That's not a coincidence; that's a magnet. You wait for those.
Then, and only then, size the trade. Suppose the read lines up: /NQ is basing at a daily support level that lines up with the overnight low, macro is neutral-to-constructive, and you want to be long with a stop just below the level. Here's the discipline that keeps you alive in a leveraged product:
- Account: $10,000. Max risk per trade: 1% = $100.
- Setup: long /MNQ at 20,000, stop at 19,975 — a 25-point stop (a sane distance below the level, not jammed right under it where noise takes you out).
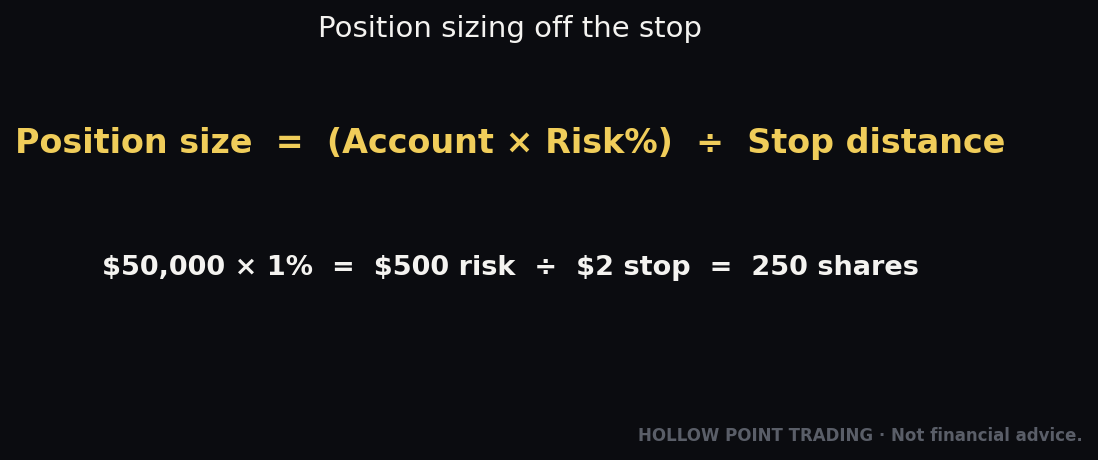
- Risk per contract: 25 points × $2 = $50.
- Position size: $100 risk ÷ $50 per contract = 2 contracts. Not "as many as my margin allows" — two, because that's what the stop math permits.
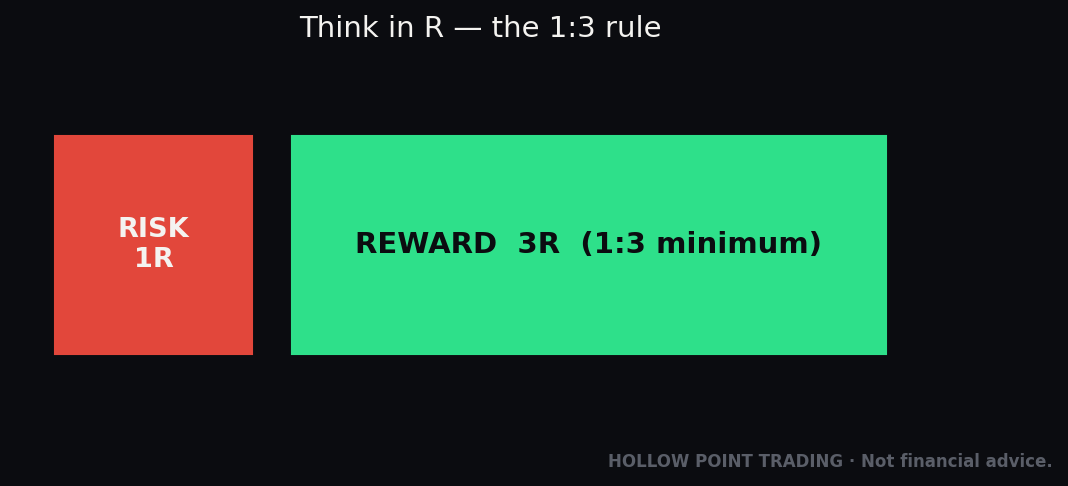
- Target at HPT's 1:3 minimum: risk 25 points to make 75, so a target at 20,075. Reward if hit: 75 × $2 × 2 contracts = $300 against $100 risked.
Notice what drove the size: the stop distance and the 1% rule, not the buying power. The broker might let you hold twenty /MNQ on that margin. You held two, because that's what the stop math permits.
And notice the 1:3. Risking $100 to make $300 means you can be wrong more often than right and still make money. Win only 4 of 10 trades at 1:3 and you're net positive (four wins × $300 = $1,200; six losses × $100 = $600; +$600). That asymmetry is the edge — not prediction, not being right, but structuring every trade so the winners dwarf the losers. Leverage doesn't create that edge. Discipline does. Leverage just makes both the edge and the mistakes bigger.
The same setup, sized three ways
The sizing formula scales to any account. Same 25-point stop on /MNQ (risk per contract = $50):
- $5,000 account, 1% = $50 risk: $50 ÷ $50 = 1 contract.
- $10,000 account, 1% = $100 risk: $100 ÷ $50 = 2 contracts.
- $50,000 account, 1% = $500 risk: $500 ÷ $50 = 10 contracts (or 1 /NQ, since 10 /MNQ = 1 /NQ).
This is why Micros matter: the $50,000 trader can size in precise 10-Micro steps, or graduate to a single E-mini, and the small account can still take the exact same A-setup at one Micro without over-risking. The setup is identical; only the contract count changes, and the count falls straight out of the stop distance and the risk rule. Nothing about the process changes as the account grows — that's the point.
Adding the stop after a volatility shift
Now change one thing: it's an FOMC day and the average 5-minute range just doubled. A 25-point stop is now inside the noise. You widen it to 50 points to survive the wiggle — but you hold dollar risk constant:
- Risk per contract: 50 points × $2 = $100.
- On the $10,000 account, 1% = $100 risk → $100 ÷ $100 = 1 contract.
Same account, same 1% rule, but because the stop doubled, the size halved. That's the regime feeding directly into the sizing math. Widen the stop, cut the size — automatically, every time volatility rises.
Confluence with two other tools
Levels are the spine, but Hollow Point stacks confirming tools onto them. Two that combine cleanly with a level-reaction trade:
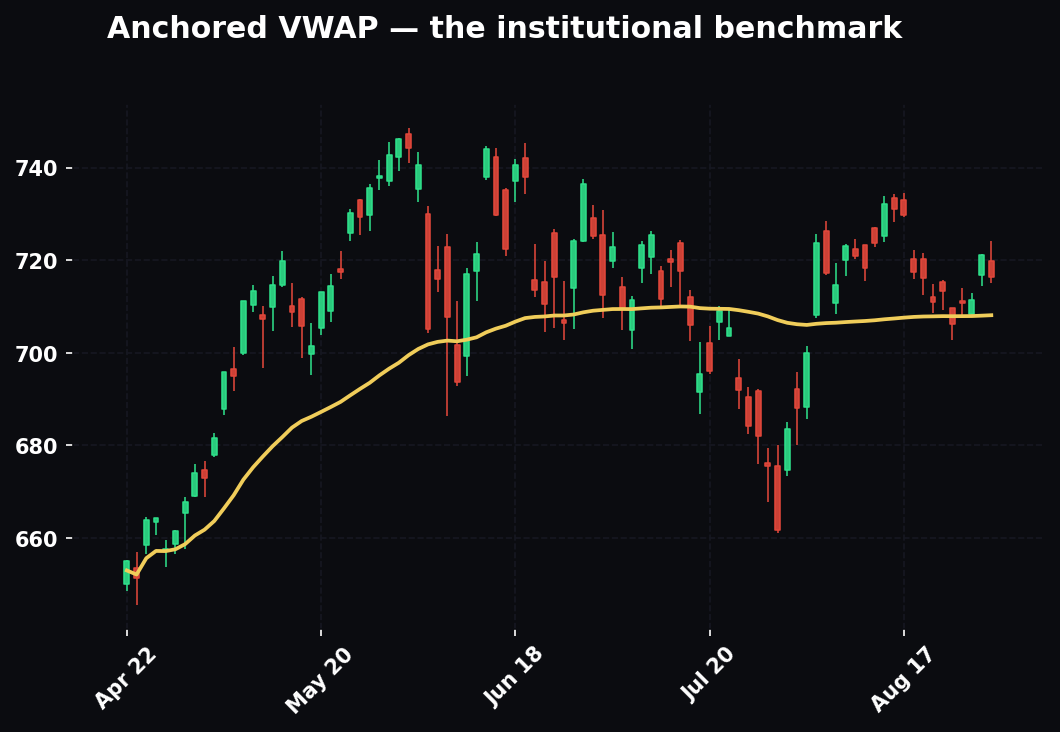
- VWAP (volume-weighted average price). On the intraday chart, VWAP is where the average participant is filled — a magnet and a fairness line. When your daily support level lines up with a rising VWAP, that's two independent reasons for price to hold: the drawn level and the intraday mean. A reaction at the confluence of level + VWAP is stronger than at either alone. Conversely, if price is stretched far above VWAP into resistance, a long is chasing.
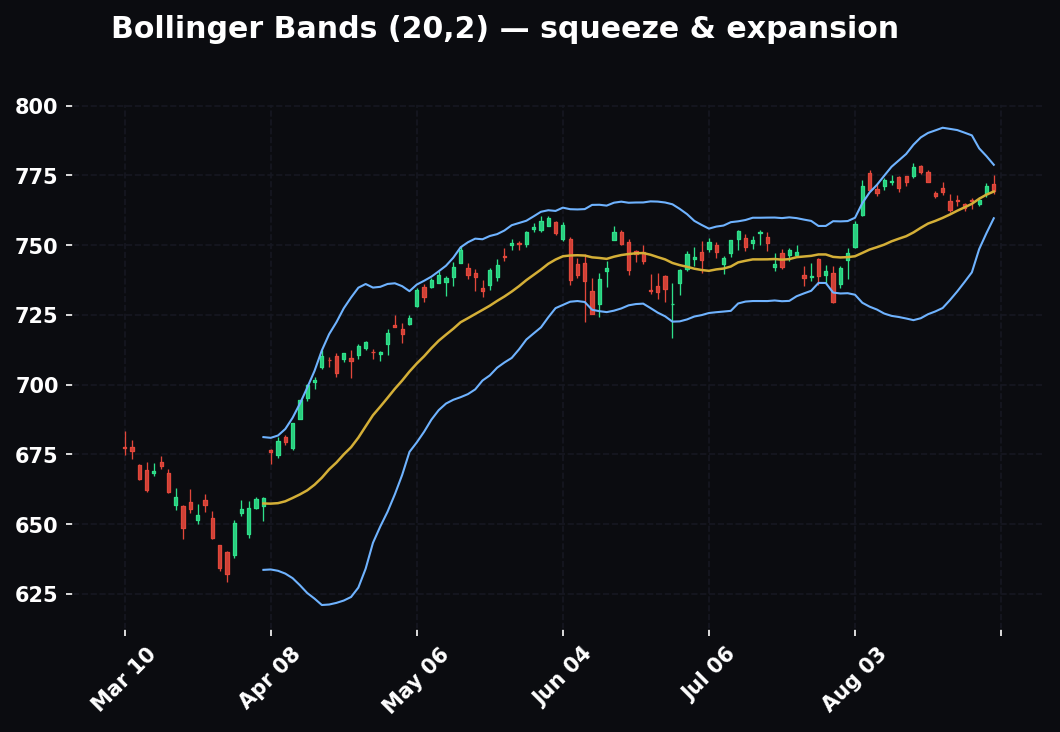
- RSI divergence. As price makes a lower low into your support level but RSI makes a higher low, momentum is fading on the selloff — a classic bullish divergence. On its own it's just an oscillator wiggle; sitting on top of a stacked daily/overnight/POC support level, it's the momentum confirmation that the reaction you're waiting for is real. The level tells you where; the divergence tells you the sellers are running out of gas right there.
Stack it: daily level + overnight low + VWAP + RSI divergence, all at ~20,000, with a 5-minute rejection wick as the trigger. That's not one signal; that's four independent tools agreeing on one price. Those are the trades you build a career on.
How the Pros Use It Differently From Beginners
The specs are identical for everyone. The behavior is night and day. Here's where the gap actually lives.
- Beginners size to buying power. Pros size to the stop. The beginner asks "how many can I hold?" The pro asks "how many does my risk rule allow given where my stop is?" Same account, wildly different survival odds.
- Beginners chase; pros wait for the reaction. A beginner sees price approaching a level and buys the approach. A pro waits for price to reach the level and show a reaction — a rejection, a structure shift, a volume surge — and buys that. The approach is a guess; the reaction is evidence.
- Beginners trade one timeframe; pros trade the stack. The beginner reacts to the 1-minute. The pro anchors on the daily/weekly and uses the 1-minute only to time an entry that the higher timeframes already justified.
- Beginners want to be right; pros want to be paid. A beginner takes a quick 1:1 profit to feel correct and lets losers run hoping to be vindicated. A pro cuts losers at the stop without ego and lets winners run to the 1:3+, because the math only works if the winners are bigger than the losers.
- Beginners overtrade because there's no PDT rule; pros treat the freedom as a test. The pro takes the two or three A-setups a day and passes on everything else. No day-trade cap is rope, and the pro refuses to hang themselves with it.
- Beginners ignore the regime; pros name it first. The pro knows a breakout in a range and a breakout in a trend are opposite trades, and reads the regime before choosing a playbook.
- Beginners fixate on the entry; pros obsess over the exit and the size. Entries are the fun part and the least important. The pro spends their attention on where the stop goes, how big the position is, and where profit gets taken — the parts that actually determine the P&L.
- Beginners see margin as spending money; pros see it as a collateral constraint. To a pro, day-trade margin is just the broker's permission slip, entirely separate from the risk decision, which was already made by the stop.
The Mistakes People Make
- Sizing to margin instead of to the stop. The single deadliest error. "My broker lets me hold ten contracts, so I'll hold ten." No. Your stop and your risk rule set your size. Full stop.
- Confusing margin with maximum loss. You can lose far more than your posted day-trade margin if you don't have a stop and price runs. Margin is the entry ticket, not the loss ceiling. A $500 day-trade margin does not mean $500 is the most you can lose — without a stop, the loss is open-ended.
- Trading the E-mini before the Micro. Starting on /NQ (×20) instead of /MNQ (×2) means every mistake is ten times more expensive while you're still learning. Start Micro. Prove the process. Scale up when the account and the discipline both earn it.
- No stop, "I'll watch it." In a 24-hour, leveraged market, a hard stop resting in the market is survival gear. "Watching it" fails exactly when it matters — during the fast move, when you freeze, when your internet drops, when you step away. The stop must be a resting order, not an intention.
- Moving the stop to avoid being wrong. Widening a stop as price approaches it, "giving it room," is just refusing to take the loss you already defined. The stop is a decision made in a clear-headed moment before the trade; honoring it is the whole discipline. Moving it in the heat of the moment converts a small planned loss into a large unplanned one.
- Revenge trading after a loss. Taking a bigger, faster, worse trade immediately after a stop-out to "make it back." This is the fastest path from one small loss to a blown day. The market doesn't owe you the last trade's money back, and it will happily take more.
- Averaging down into a loser. Adding contracts as price moves against you, lowering your average entry. In a leveraged product this is how a manageable loss becomes an account-ending one — you're increasing size exactly as the thesis is being disproven. Add to winners, never to losers.
- Forgetting the roll. Waking up in a dead back-month contract with garbage fills and levels that no longer line up. Set the calendar reminder for expiration week.
- Overtrading because there's no PDT rule. No day-trade cap is freedom and rope. Ten mediocre trades a day in a leveraged product is a fee-and-slippage machine — remember the spread is a tax on activity. Take the A-setups, skip the noise.
- Ignoring overnight/session context. Treating a level tested in thin 3 a.m. tape the same as one tested in heavy NY volume. Where a level was formed changes what it's worth.
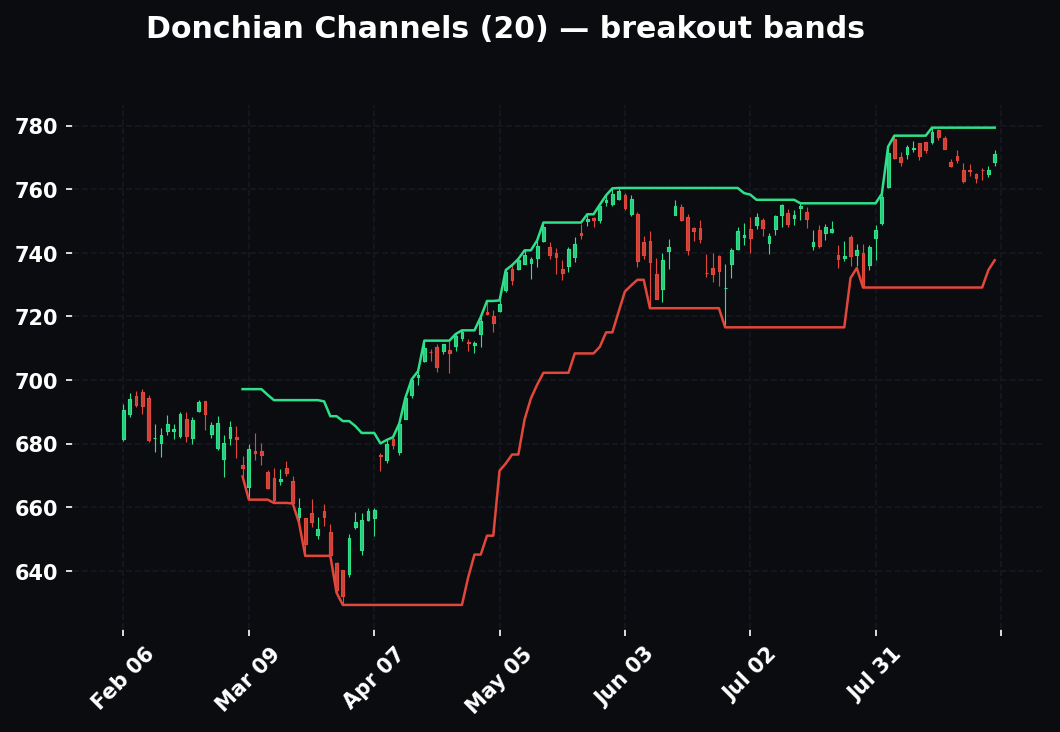
- Chasing indicators instead of levels. Lagging oscillators fire after the move. Levels tell you where the move will decide itself, in advance. Indicators confirm; levels locate.
- Trading one size in every regime. Using the same stop and the same contract count on a dead-calm summer Friday and an FOMC afternoon. When volatility triples, the stop must widen and the size must shrink. One-size-fits-all sizing gets you stopped out in noise on calm days and over-risked on wild ones.
FAQ
How much money do I need to start trading futures? Technically a few hundred dollars can open a Micro on day-trade margin — but that's not the real question. You need enough that a proper 1%-risk position sizes to at least one Micro on your typical stop. On a 25-point /MNQ stop ($50 risk), 1% risk needs a ~$5,000 account to take even one contract cleanly. Starting smaller forces you to over-risk, which defeats the purpose. Many traders also start on a funded/evaluation account to trade a larger simulated balance while they prove the process.
Should I start with /NQ or /MNQ? /MNQ, without exception, until your process is demonstrably profitable. The Micro is exactly 1/10th the risk of the E-mini for the identical setup. There is no upside to learning on the ×20 contract except larger losses.
What's the difference between initial and maintenance margin again? Initial margin is what you need to open a position; maintenance is the minimum equity you must keep to hold it. Fall below maintenance and you get a margin call — add funds or the position is liquidated. Day-trade margin (for positions closed before session end) is far lower than the overnight initial margin.
Can I lose more than I put in? Yes, if you trade without a stop and the market gaps or runs far against you. This is the critical difference from a long option (where max loss is the premium). It is also exactly why a hard stop is non-negotiable in futures — the stop is what converts an open-ended risk into a defined one.
Do futures pay dividends? No. You're not holding shares; you're holding an agreement. The value of expected dividends is already baked into the price relationship between contract months (the basis), but no dividend hits your account.
What actually happens if I forget to close before expiration? For cash-settled index futures, nothing dramatic — your open position is marked to the final settlement value and cashed out. For physically-settled commodities (oil, grains, metals), forgetting is a real problem involving delivery. Since you'll be trading index futures, the practical rule is just: roll to the next quarter about a week before expiration and never think about it.
Why do the pros keep saying "size to the stop"? Because in a leveraged product the broker will let you hold far more than you should. The stop distance times the multiplier is your risk per contract; your risk rule (say 1% of the account) divided by that number is the only correct contract count. Buying power is irrelevant to the sizing decision — it just sets a ceiling you should stay well under.
Is the 60/40 tax treatment automatic? For U.S. traders, Section 1256 treatment applies to these index futures by law, but how it flows onto your return is a filing matter — talk to a tax professional. The point here is only that the favorable blended rate exists and most beginners don't know it.
Why does everyone trade /ES and /NQ specifically? Liquidity. They're the deepest, tightest index futures, which means better fills, one-tick spreads, and levels that behave. Thinner products (/RTY especially) have wider spreads and jumpier tape — fine for specialists, rough for beginners.
How do I know if it's a trend or a range before I trade? Three quick reads: daily structure (HH/HL vs overlapping bars), moving-average posture (stacked and sloping vs flat and tangled), and recent daily range plus VIX (expanding vs contracting). Name the regime out loud before drawing levels — it decides whether you buy pullbacks and hold for full targets, or fade the extremes for measured moves.
The Cheat-Sheet
What it is: A standardized, exchange-traded contract — an obligation to buy/sell an underlying at a set price on a set date. You post collateral (margin), not the full value. For every long there's a short; the clearinghouse guarantees both.
Core products & multipliers (memorize):
- /ES ×$50 · /MES ×$5 (S&P 500) — deepest, cleanest, best to learn on
- /NQ ×$20 · /MNQ ×$2 (Nasdaq-100) — tech/growth, fastest, HPT's home
- /YM ×$5 · /MYM ×$0.50 (Dow) — 1-pt tick, slower
- /RTY ×$50 · /M2K ×$5 (Russell 2000) — small caps, thin, jumpy
- Micro = exactly 1/10 of its E-mini. 10 Micros = 1 E-mini.
The one formula: Dollars = points moved × multiplier.
Tick math (MNQ): 0.25 pt tick × $2 = $0.50/tick. 4 ticks per point. On /NQ: 0.25 × $20 = $5/tick. The spread (usually 1 tick) is a tax on every round-trip.
Notional (the size you really hold): index level × multiplier. One /MNQ at 20,000 = $40,000 controlled; one /NQ = $400,000.
Margin: Initial = to open. Maintenance = to hold (breach it → margin call → possible auto-liquidation). Day-trade margin ≪ overnight. Margin is the entry ticket, not your max loss.
Leverage: ~20:1 overnight to ~80:1 intraday on a Micro. It amplifies wins and losses identically. It doesn't create edge — it magnifies whatever you bring.
Session: ~Sun 5pm CT → Fri 4pm CT, daily maintenance halt. Three acts: Asia (thin), London (first volume), New York (8:30am CT open sets the tone). Weight a level by the volume that formed it.
Contract months: H-Mar, M-Jun, U-Sep, Z-Dec. Quarterly expiry, 3rd Friday. Roll ~a week before expiration to the next quarter, once back-month volume leads. Use continuous-adjusted charts.
Settlement: Index futures are cash-settled — no delivery, just marked to the final value. (Commodities are often physical — close or roll.)
Edges vs. other instruments: No PDT rule · huge capital efficiency · no theta/IV (linear, delta-1) · 60/40 tax treatment (Section 1256).
Regime rules:
- Trend: buy pullbacks to confluence with the trend, hold for full 1:3+ targets.
- Range: fade the extremes back to the middle, take measured moves, distrust breakouts.
- High-vol: widen the stop to survive noise, cut size to keep dollar risk constant.
Multi-timeframe: Higher timeframes set bias + walls; lower timeframes time the entry. Never let the 1-minute override the daily. Best trades = the whole ladder points at one price.
Sizing rule (the whole game):
- Set max risk (e.g., 1% of account).
- Measure stop distance in points.
- Risk per contract = stop points × multiplier.
- Contracts = max risk ÷ risk per contract.
- Target at 1:3 minimum.
Size to the stop, never to the buying power.
Confluence stack (what turns a level into a trade): drawn level + VWAP + volume POC + RSI divergence + a lower-timeframe reaction (rejection wick / structure break / volume surge), all at one price.
HPT process: Macro → sector → instrument. Levels first (PDH/PDL, overnight H/L, opening range, POC/value area, round numbers). Name the regime. Timeframe-weighted confluence — higher timeframe wins. Trade the reaction at the level, not the indicator. 1:3 R/R minimum. Discipline over prediction.
Futures aren't more dangerous than stocks because of some hidden trap. They're more dangerous because they do exactly what you tell them to, ten to eighty times louder. Learn the specs, respect the leverage, read the regime, stack the timeframes, size to your stop, and the same instrument that blows up the reckless becomes the most efficient tool you own.
Bound by rules, feared by trade.