
Every chart you've ever stared at is really a map of one thing: where buyers and sellers changed their minds. Price ramps up, stalls, drops. Falls, stalls, bounces. Those stall points aren't accidents. They're the fingerprints of orders, memory, and human psychology — and they repeat. Learn to mark them cleanly and you stop reacting to every wiggle and start trading the handful of prices that actually matter.
This is the guide I wish someone had handed me at the start. We'll build it from the ground up: why levels exist at all, the difference between a line and a zone, the specific levels that work over and over (prior day/week highs and lows, round numbers), the flip that trips up every beginner, how supply and demand zones sharpen the picture, how levels behave differently in a trend versus a chop versus a high-volatility panic, how they stack across timeframes, and how they combine with the other tools in your kit. Most important of all: how to trade the reaction at a level instead of trying to predict it. By Monday you'll be marking charts like a professional and letting price tell you when it's wrong.
The Concept: What Support and Resistance Actually Are
Strip away the jargon and it's simple.
Support is a price area where buying has been strong enough to stop a fall. Price drops into it, buyers step up, and it bounces. Think of it as a floor.
Resistance is a price area where selling has been strong enough to stop a rise. Price climbs into it, sellers step up, and it stalls or reverses. Think of it as a ceiling.
That's the whole idea in one breath: support is a floor, resistance is a ceiling, and price tends to respect both until it doesn't. The magic isn't in the definition — every beginner knows it. The edge is in why these areas hold, which ones hold, and what you do when price arrives.
One term to define now and never re-explain: a level is a specific price or narrow price area you've drawn on your chart because it has mattered before. When we say "price is testing a level," we mean it has traveled back to a spot where something significant happened — and you're watching to see if that history repeats.
Support and resistance are relationships, not properties
Here's a subtlety that separates a real understanding from a memorized definition: a price is not "support" the way water is wet. A price is support relative to where price currently sits. $100 is support when price is at $105 falling toward it. The exact same $100 becomes resistance the moment price is at $95 climbing toward it. The level is a fixed price on the chart; whether it acts as a floor or a ceiling depends entirely on which side price approaches from.
This is why you should stop thinking "support level" and "resistance level" as two different objects and start thinking "decision level" — a price that matters, that will act as a floor or a ceiling depending on the approach. It makes the flip (which trips up every beginner and which we'll cover in depth) obvious instead of mysterious. The level is neutral. The role is assigned by direction.
The test that a level is real
A price you drew because it "looks like it might matter" is a guess. A price becomes a level when it has produced a reaction — a visible change in price behavior. That reaction is your evidence. No reaction, no level. We'll come back to this repeatedly, because the entire method rests on it: you don't trade levels, you trade reactions at levels.
The Mechanism: Why Levels Exist
If levels were random, they wouldn't work. They work because three real forces converge on the same prices: memory, orders, and psychology. Understand these and support/resistance stops being magic and becomes mechanics. And once you understand why a level exists, you can judge how strong it is before price ever gets there — which is the difference between a mechanic and a line-drawer.
1. Memory — traders remember pain and missed profit
Imagine price rallies to $100, stalls, and dumps to $90. Three groups now carry a memory of that $100 print:
- Trapped longs who bought near $100 and are now underwater. They've been in pain. When price crawls back to $100, they get out at breakeven — that selling caps the move. That's why old resistance is sticky.
- Regretful sellers who wanted to short $100 but hesitated. They now have a second chance and sell into it.
- Profit-takers who bought lower and remember $100 as "the top." They ring the register there.
All three do the same thing at the same price: sell. None of them coordinated. They just share a memory. That collective memory is resistance.
Flip it for support: buyers who missed the bounce, longs who want to add, and shorts covering profit all buy the same area. Memory turns a random price into a magnet.
Memory also explains why a level decays. Every time price returns to $100 and those trapped longs get their breakeven exit, that particular pool of memory-driven sellers is used up. They're out; they're not selling there again. The first return to a level meets the largest crowd of memory-driven orders. The fourth return meets a thinned-out, exhausted crowd. This is the mechanical reason fresh levels are stronger than tired ones — a fact we'll use constantly.
2. Orders — resting liquidity sits at obvious prices
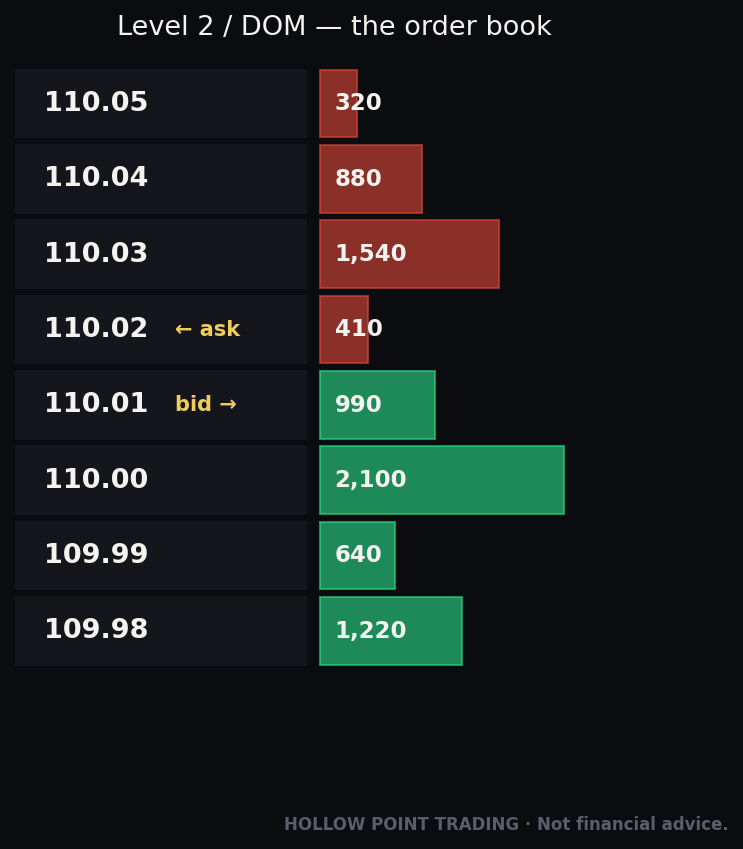
Markets run on an order book — a stack of resting buy and sell orders waiting to be filled. Big participants can't dump size into thin air; they hide limit orders (orders to buy or sell at a set price) at prices where they expect a reaction. Round numbers, prior highs, prior lows — obvious spots — accumulate resting orders precisely because they're obvious. When price arrives, those orders absorb the move and it stalls.
There's a second, sneakier layer. Stop-loss orders cluster just beyond obvious levels — shorts put their stops just above resistance, longs put theirs just below support. Larger players know this. Price often gets pushed through a level to trigger those stops (a stop hunt or liquidity grab), grabbing the flood of orders that fire, and then snaps back. This is why the reaction matters more than the touch — we'll build a whole method on it.
Think about the mechanics of a stop hunt concretely. Say fifty thousand shares of stop-loss sell orders sit just under $100 support. A large buyer who wants to accumulate a big long position has a problem: there aren't enough sellers at $100 to fill them. So price gets nudged down to $99.60. The stops trigger. Now there's a flood of forced selling — fifty thousand shares hitting the market at once — and the big buyer is on the other side of every one of those, filling their entire position at a discount. Then, with no more sellers left, price snaps back above $100. To the untrained eye it looks like the level "failed and reversed." To the trained eye it was the level doing exactly its job: gathering liquidity before the real move. The wick below $100 is the footprint.
3. Psychology — round numbers and clean prices anchor decisions
Human brains love round numbers. Nobody sets a target at $497.13; they set it at $500. Nobody says "I'll sell if it breaks $19,847"; they say $20,000. Because thousands of traders anchor to the same clean prices, those prices become self-fulfilling walls of orders. The level works because everyone believes it will — belief becomes behavior, behavior becomes orders, orders become the level.
Psychology also produces front-running and overshoot, two behaviors you'll see constantly around round numbers. Front-running: sophisticated traders know the crowd will sell at $500, so they sell at $499.50 to beat them — which makes price stall just shy of the round number. Overshoot: stops sit just past $500, so price pokes to $500.40 to grab them before reversing. This is why a round number is never a precise line; it's the center of a zone with a fuzzy edge on both sides.
Put the three together and you get the HPT way of seeing it: a level is a price where memory, resting orders, and psychology all point the same direction at the same time. The more of the three that stack, the stronger the level. A round number (psychology) that is also last week's high (memory) that also has a visible cluster of rejections (orders) is a three-force level — those are the ones you build trades around.
Lines vs. Zones: Stop Drawing Perfect Lines
Here's the first mistake almost everyone makes: they draw support and resistance as thin, perfect lines and expect price to reverse to the exact penny. Then price overshoots by a bit, stops them out, and reverses anyway. They were right about the level and wrong about the precision.
Markets are messy. A level is rarely one price — it's a zone, a band with a top and a bottom. Real reversals happen inside a range of prices, not at a single tick.
When to use a line: a single, sharp price — a prior day's exact high, a round number, a swing point everyone sees. Good for alerts and mental triggers.
When to use a zone: most of the time. Draw the band that captures where price actually reacted — wick-to-body, or the cluster of touches. A zone gives your read tolerance. Price can poke into it, grab stops, and still respect it.
How to build a zone, step by step
- Find a spot where price reversed hard — a sharp turn, not a lazy drift.
- Identify the candles that made the turn — usually the last one or two before price reversed.
- Draw the box from the open/close body to the wick extreme of those candles. On a resistance zone, that's from the top of the bodies up to the highest wick. On a demand zone, from the bottom of the bodies down to the lowest wick.
- Extend the box to the right as a shaded band. That band is your signal area — not a single line you defend to the death.
How wide should a zone be?
A common beginner error is to over-correct: they hear "use zones" and draw zones so wide that everything is inside a zone and nothing is a decision. Calibrate zone width to the instrument and timeframe. On a 5-minute chart of a $50 stock, a zone might be 15–25 cents wide. On a daily chart of that same stock, it might be a dollar. On NQ futures intraday, a zone might be 10–20 points; on the daily, 40–60. The rule of thumb: the zone should be wide enough to contain the wicks of the reaction that created it, and no wider. If your zone is wider than the average candle range on that timeframe, you've drawn a region, not a level.
The mental shift
Stop asking "what's the exact price?" and start asking "what's the area, and how does price behave when it gets there?" The exact price is a comforting illusion. The area plus the behavior is a tradeable read.
The Levels That Work Over and Over
You could mark a hundred levels and drown in lines. Don't. A few categories carry most of the weight. Master these first.
Prior Day High and Low (PDH / PDL)
The single highest and lowest price of yesterday's session. These are the most-watched intraday levels on the planet because everyone can see them and they reset daily. PDH acts as resistance; PDL acts as support. Price breaking PDH signals strength (bulls took out yesterday's ceiling); losing PDL signals weakness. Day traders live and die by these. Mark them every single morning before the open.
A concrete rhythm you'll see constantly: price opens inside yesterday's range, drifts up to PDH, wicks through it to grab the stops sitting above (the breakout buyers' entries and the shorts' stops), and then either (a) reclaims and holds above — a real breakout — or (b) falls back inside the range — a failed breakout, which is one of the highest-odds fade setups there is. The PDH didn't just "resist." It gathered liquidity and then resolved. Your job is to read which resolution happened, not to guess in advance.
Prior Week High and Low (PWH / PWL)
Same idea, bigger timeframe, more weight. Swing traders anchor to these. When intraday levels line up with weekly levels, you get confluence — multiple independent reasons pointing at the same price — and those are your highest-probability spots. A PDH that sits right at the PWH is worth far more than a PDH floating in the middle of the weekly range.
Prior Month / Prior Session levels
Don't forget the prior month's high and low for swing-position context, and — for futures and 24-hour markets — the prior session and overnight highs and lows. Overnight highs/lows are where liquidity built while the day-session crowd slept; they act exactly like PDH/PDL and are among the first magnets the regular session reaches for.
Round Numbers (Psychological Levels)
The clean prices: $50, $100, $500, big index figures like 20,000 on the Nasdaq. Also "half-numbers" ($50 has pull, so do the $25 and $75 midpoints on some instruments). Price often stalls just shy of a round number (the crowd front-runs it) or overshoots it slightly (stop hunt) before reacting. Never treat a round number as a precise line — treat it as the center of a zone.
The bigger and rounder the number, the stronger the pull. $20,000 on the Nasdaq is a heavier magnet than $19,500, which is heavier than $19,750. This is the "big figure" hierarchy: whole thousands beat five-hundreds beat hundreds. On an individual stock, whole dollars matter, but the $10 and $100 marks matter more.
Swing Highs and Swing Lows
A swing high is a peak with lower highs on both sides; a swing low is a valley with higher lows on both sides. These are the raw structure of the market. Connect the meaningful ones and you've marked where price has turned before — the truest support and resistance there is, because it's drawn from price's own behavior, not a formula. When you're unsure where to draw, swing points are the honest answer: they're literally where price already turned.
Session Levels & Opening Range
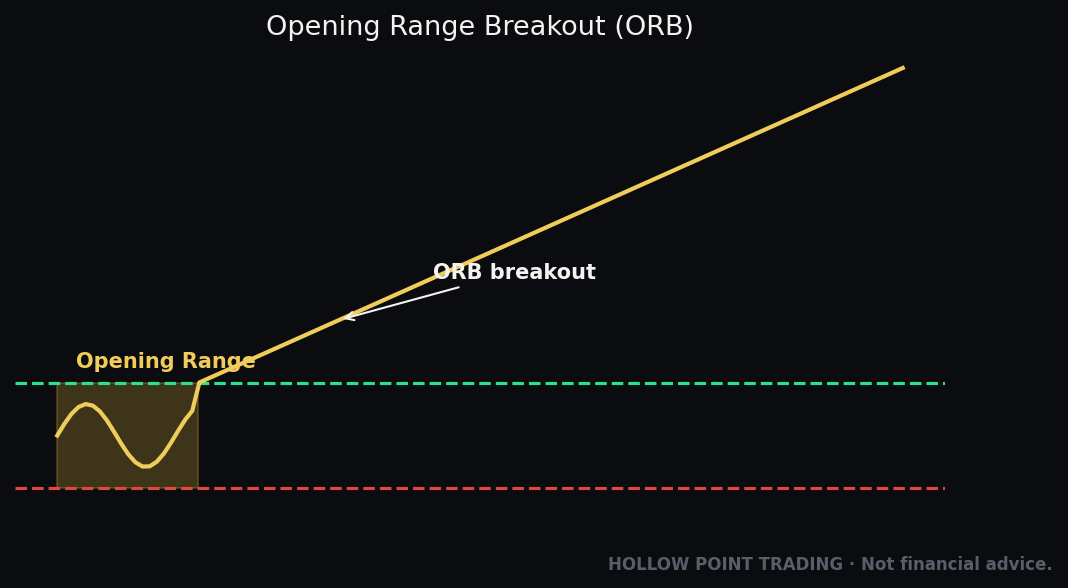
For intraday work: the opening range (the high and low of the first 15–30 minutes) frames the day. Break above it, bulls have control; break below, bears do. The opening range works because the first half hour is where the day's largest participants establish positions — it's the day's highest-information window, and its extremes become the day's first reference lines.
The discipline across all of these: fewer levels, cleaner levels. Three levels you trust beat twenty you drew because you could.
The Flip: When Support Becomes Resistance (and Back)
This is the concept that separates people who get it from people who don't. Learn it cold.
When a support level breaks, it often becomes resistance. When a resistance level breaks, it often becomes support. This is called a flip, polarity change, or "role reversal."
Why does it happen? Go back to memory and orders.
Say $100 was support — buyers kept stepping in there. Then price breaks below $100 and falls to $95. Everyone who bought at $100 is now underwater. When price crawls back up to $100, those trapped buyers dump their positions at breakeven to escape the pain. That selling — right at the old support — turns the former floor into a new ceiling. The level didn't move. The role flipped.
The reverse is just as reliable. Old resistance that breaks becomes new support: the sellers who were capping price are now gone (or trapped short), and buyers who missed the breakout treat the old ceiling as a floor to get in.
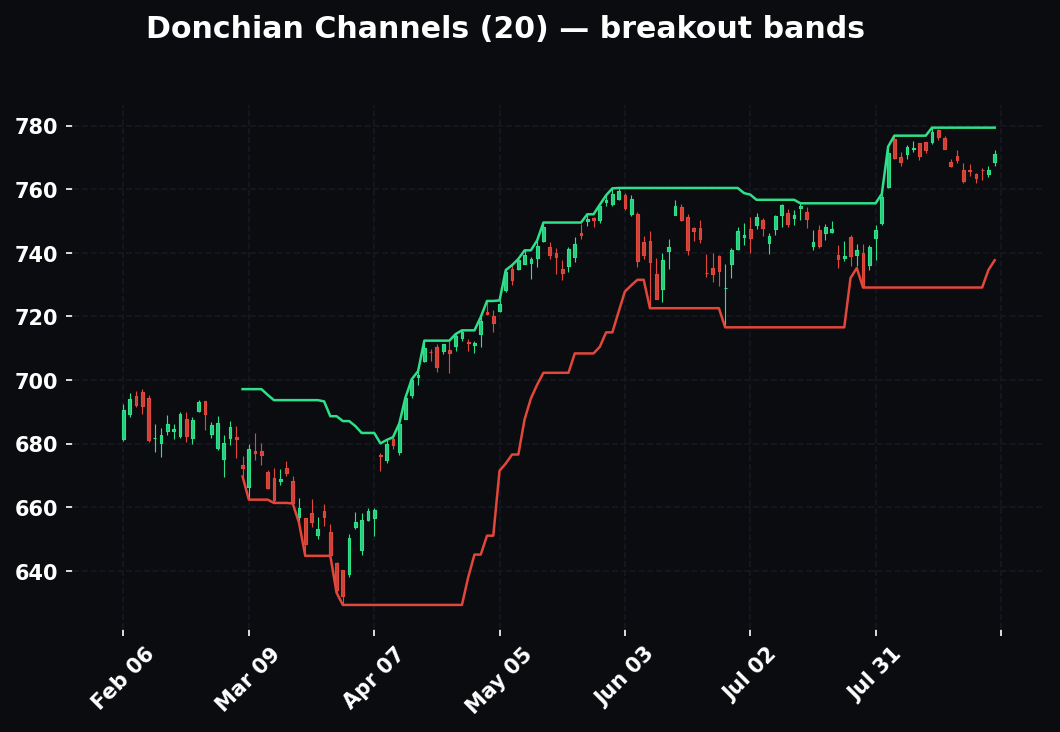
The flip is powerful for two reasons
- It gives you clean entries. A break-and-retest of a flipped level is one of the highest-probability setups in trading. Price breaks resistance, comes back to test it as support, holds, and continues. You enter on the retest — with a tight, obvious invalidation right below the level.
- It confirms the break was real. A level that flips and holds tells you the break had conviction. A "break" that immediately falls back through is a fakeout — the level never truly flipped.
The difference between a real flip and a fakeout
This is the whole game at a breaking level. Two questions decide it:
- Did price close through, or just wick through?* A wick through the level that closes back inside is a rejection, not a break. A full-bodied candle that closes clearly beyond the level is a break. Closes are votes; wicks are attempts.
- Did the retest hold? After a real break, price often comes back to kiss the level. If it holds the level in its new role (finds support at old resistance) and turns, the flip is confirmed. If it slices straight back through, the "break" was a trap and you want no part of the long — in fact the failed flip is now a signal in the opposite* direction.
Worked example: a clean flip long
A stock chops under $200 for a week — clean resistance, tested four times. On the fifth push it breaks to $203 on strong volume, closing the daily candle at $202.80 (a full-bodied close well above the level). Instead of chasing at $203, you wait. Two days later price pulls back to $200.20 and forms a bullish reaction candle — a hammer with a long lower wick — right on the old resistance line. The flip held. You go long at $200.40 with a stop at $198.80 (just under the zone, where the read is proven wrong), targeting $209. That's $1.60 of risk for roughly $8.60 of reward — better than a clean 1:3 by HPT's rules. You didn't predict the breakout. You let the flip prove itself and reacted.
Worked example: a failed flip that becomes a short
Same setup, different resolution. Price breaks to $203 but the daily candle closes at $200.30 — right back at the level, a long upper wick, no conviction. The next day price opens weak and slices back under $199. That's a failed breakout. The trapped breakout buyers from $203 are now underwater and will sell to escape. You flip your bias: the old resistance held after all, and the failed break gives you a short entry on the reclaim of $199 with a stop above the day's high, targeting the bottom of the prior range. The level didn't lie — the close told you which resolution you were in. Beginners see "it broke," pros see "did it hold."
Supply and Demand Zones: The Order-Block Way of Thinking
Support and resistance describe where price reacts. Supply and demand zones describe why, in terms of unfilled orders — and they give you a more precise way to mark the areas that matter.
The core idea comes from a simple truth: big players can't fill their whole position in one spot. When a large buyer wants size, they buy what's available, price rockets up, and they leave orders behind unfilled. The place they were buying is a demand zone — if price returns there, their remaining orders (plus everyone who saw the rocket and wants in) fire again. Same logic inverted for a supply zone: a spot where heavy selling launched a sharp drop, leaving unfilled sell orders that reactivate on a return.
An order block is the specific candle (or small cluster) right before that explosive move — the last down-candle before a big rally (demand), or the last up-candle before a big drop (supply). The theory: that's where the institutional order sat. You mark the body-to-wick range of that candle as your zone.
How to spot a high-quality zone
Not every base is worth marking. The good ones share three traits:
- A sharp, impulsive move away. Weak drift out of an area means weak orders. You want price to leave fast — a strong, wide-range departure, ideally with a gap or a series of large-bodied candles. That impulsiveness is the tell that big orders were absorbed there. The technical name for the departure is a "leg" — the stronger the leg, the stronger the zone that launched it.
- A clean, tight base. A few candles of consolidation before the launch, not a sprawling mess. Tight base = precise zone. If the base is ten candles of chop, the "zone" is really a range, and ranges are traded differently.
- Freshness. An unmitigated zone — one price hasn't returned to yet — is stronger than one that's already been tested twice. Each tap consumes the resting orders. The first return is the highest-odds one. "Mitigated" just means price has already come back and the orders have been partially filled.
The two shapes that matter
- Rally-Base-Rally / Drop-Base-Drop — continuation zones. Price paused mid-trend, loaded up, and kept going. Trade in the direction of the trend.
- Rally-Base-Drop / Drop-Base-Rally — reversal zones. Price paused and turned. These mark the strongest supply (at a top) and demand (at a bottom).
Grading a zone before you trust it
Before you commit to a supply or demand zone, run it through a quick grade:
- Departure strength: Did price leave with force (large candles, a gap)? A-grade. Did it ooze out? C-grade, skip it.
- Time at the base: A few candles is ideal. A base that sat for dozens of bars has become a value area, not an order block — the "institutional footprint" is diluted.
- Freshness: Untouched since creation? A-grade. Tested once and held? B-grade. Tested twice? Treat it as nearly spent.
- Location: Does the zone line up with a horizontal S/R level, a round number, or a higher-timeframe zone? Confluence upgrades any zone.
Here's the honest part most gurus won't tell you: supply/demand and support/resistance are the same phenomenon described two ways. S/R is the horizontal-level lens; supply/demand is the fresh-order-block lens. You don't need to pick a religion. Use S/R for the big, obvious, everyone-sees-them levels, and use supply/demand order blocks to refine your entries to the tightest, freshest part of the zone. Together they're sharper than either alone — S/R tells you the neighborhood, the order block tells you the doorway.
How Levels Behave in Different Market Regimes
A level does not behave the same way on every kind of day, and this is where a lot of otherwise-good level-drawers lose money — they use the same playbook in conditions that demand different responses. There are three regimes. Know which one you're in before you touch a level.
Trending regime
In a clean trend, levels in the direction of the trend are strong and levels against it are weak. In an uptrend, demand zones and support flips catch price and launch it higher — buy them. Resistance, on the other hand, tends to break rather than hold, because the trend has momentum and fresh buyers behind it. So the pro read in an uptrend is: fade support-side reactions (buy the dips), and treat resistance as a break-and-retest opportunity, not a reversal. The EMAs (which we'll cover) confirm the regime — stacked and sloping means trend.
The mistake is shorting every resistance touch in a strong uptrend. You're standing in front of a train because a line told you to. In a trend, the counter-trend level is the weak one.
Ranging / chop regime
In a range, price ping-pongs between a well-defined ceiling and floor, and both levels are strong. This is the one regime where fading the level — selling resistance, buying support — is the primary play, because there's no trend to override the level. Range days reward patience: you wait for price to reach an edge of the range, wait for the rejection, and trade back toward the other edge. The middle of the range is no-man's-land; the money is made at the extremes.
The mistake in a range is trading breakouts. Ranges produce constant fake breakouts — price pokes out, grabs stops, and reverts. Until the range genuinely resolves (a decisive close outside with follow-through), assume every poke past the edge is a liquidity grab, not a breakout.
High-volatility / news regime
When volatility explodes — a Fed day, an earnings gap, a geopolitical shock — levels get sloppier and overshoots get bigger. A zone that's normally 20 points wide might need to be 60. Stops get run further past levels before reversals. Some levels get sliced through as if they weren't there, because the order book gets swept away by a wave of market orders that don't care about your line.
The pro response to high vol is not to abandon levels — it's to widen the zones, demand a much stronger reaction before trusting a level, and shrink position size so the wider stop still fits your risk. Many pros simply stand aside during the first violent minutes after a major catalyst and let the level re-form — they wait for price to establish a new reaction after the shock, then trade that. A level drawn from calm conditions is not reliable in the first five minutes of a panic.
Multi-Timeframe Levels: The Hierarchy
Levels are fractal — they exist on every timeframe, from the 1-minute to the monthly — and the single most important rule for using them is that higher-timeframe levels outrank lower-timeframe levels. When a daily level and a 5-minute level disagree, the daily wins. This is timeframe-weighted confluence, and it's non-negotiable in the HPT method.
Why the hierarchy exists
A daily level was created by a full day (or many days) of participants agreeing that a price mattered. A 1-minute level was created by a few minutes of a much smaller crowd. The daily level has more memory, more resting orders, and more eyes on it. When price reaches a daily level, the entire market is watching; when it reaches a 1-minute level, a handful of scalpers are. More participants means a stronger reaction.
The three-timeframe stack
The practical method is to work three timeframes at once:
- The context timeframe (e.g., daily or weekly) — where you mark the major anchors and read the trend. This tells you whether and which way.
- The setup timeframe (e.g., 1-hour or 15-minute) — where you see the actual level being approached and the structure forming.
- The execution timeframe (e.g., 5-minute or 1-minute) — where you read the reaction candle and pull the trigger.
You never let the execution timeframe override the context timeframe. If the daily says the trend is down and price is at a daily supply zone, a bullish 1-minute reaction is a scalp against context at best — small, fast, and not something you press. But if the daily trend is up, price is pulling into a daily demand zone, and the 5-minute prints a clean bullish rejection, now every timeframe agrees and that's where you size up.
When timeframes align — and when they fight
The highest-odds trade in all of technical analysis is timeframe alignment: a level that exists on the daily, is confirmed by structure on the hourly, and gives you a clean reaction on the 5-minute, all pointing the same way. Everyone from the position trader to the scalper is leaning the same direction at that price.
When timeframes fight — daily demand but a 15-minute downtrend hammering into it — you have a decision, not a trade. Either wait for the lower timeframe to stop fighting the higher one (a 15-minute reversal into the daily zone), or stand aside. Trading into a timeframe conflict is how you get chopped up.
How to Mark Clean Levels: A Repeatable Process
Marking levels is a skill, and the enemy is clutter. Here's the routine.
Start on the higher timeframe and work down. Open the daily (or weekly for swings). Mark the major levels first — the ones a blind man could see: obvious tops, obvious bottoms, the round numbers in play. These are your anchors. Then drop to your trading timeframe and add the intraday levels (PDH/PDL, opening range). Higher-timeframe levels outrank lower ones — the hierarchy above is baked into the drawing order.
Draw from the most obvious reactions. For each level, ask: did price react here more than once, or react violently once? Two clean touches or one sharp rejection earns a line. A single ordinary touch doesn't.
Mark the wick-and-body zone, not a random pixel. For a resistance zone, draw from the highest wick down to the cluster of candle bodies. That's your band.
Left is right. The most important levels are the ones price has respected in the past — scroll left. History is your evidence. A level with three prior reactions is worth ten drawn on a hunch.
Color-code by weight. A simple, powerful habit: use one color for major (higher-timeframe) levels and another for minor (intraday) levels. When price approaches, the color instantly tells you the weight and how seriously to take the reaction. You never confuse a daily anchor with a 5-minute wiggle in the heat of the moment.
Then stop. If your chart has more than a handful of lines per timeframe, you've over-marked. Clean charts make clean decisions. Delete anything price has already blown through and isn't coming back to.
A quick worked example
You're preparing an index-futures chart for the week. Weekly: you mark the all-time-high round number above and a major prior-week low below — two anchors, in your "major" color. Daily: last week's high and low, plus a mid-range level where price reversed twice — three more. On your 15-minute execution chart you add PDH and PDL each morning, in your "minor" color — two more that reset daily. Roughly six to seven meaningful levels, ranked by timeframe and colored by weight. When price approaches any of them, you already know its weight and what a hold or break means. No scrambling, no fresh lines mid-session.
Maintenance: levels are living, not permanent
Marking isn't a one-time event. Each morning, before the open: add the new PDH/PDL, delete yesterday's if price has moved well past them, and check whether any of your major levels flipped overnight. A chart you marked three weeks ago and never updated is a liability — it's full of dead levels price has already resolved. Ten minutes of maintenance keeps the map honest.
Trading the Reaction, Not the Prediction
This is the heart of it, and it's where most traders go wrong. They see a level and predict: "It'll bounce here." Then they buy before price does anything, get run over, and blame the level.
Professionals invert this. You don't predict the level will hold. You wait for price to show you it's holding, then react. The level is a decision point, not a guarantee. Your job is to be ready with two plans — one if it holds, one if it breaks — and let price pick.
There are exactly two things price can do at a level. Build a plan for each.
Reject (the level holds)
Price arrives, and sellers (at resistance) or buyers (at support) show up. You see it in the candles: a rejection wick (a long tail poking into the level and closing back out), a bearish/bullish engulfing, a stall in momentum. That reaction is your signal. You trade in the direction of the bounce, with your stop just on the far side of the zone. The level held; you're going with it.
What a good rejection looks like, concretely: price drives into the zone, and within one to three candles you get a long wick against the direction of the approach, a close back out of the zone, and ideally a pickup in volume on the reversal candle. One clean rejection candle with a decisive close beats three ambiguous doji every time.
Reclaim / Break (the level fails)
Price pushes through the level and — critically — closes beyond it and holds. Now the level flips. You wait for the retest: price comes back to the broken level, tests it in its new role, and holds. You enter on that retest, going in the breakout's direction, stop on the wrong side. The level broke; you're going with that.
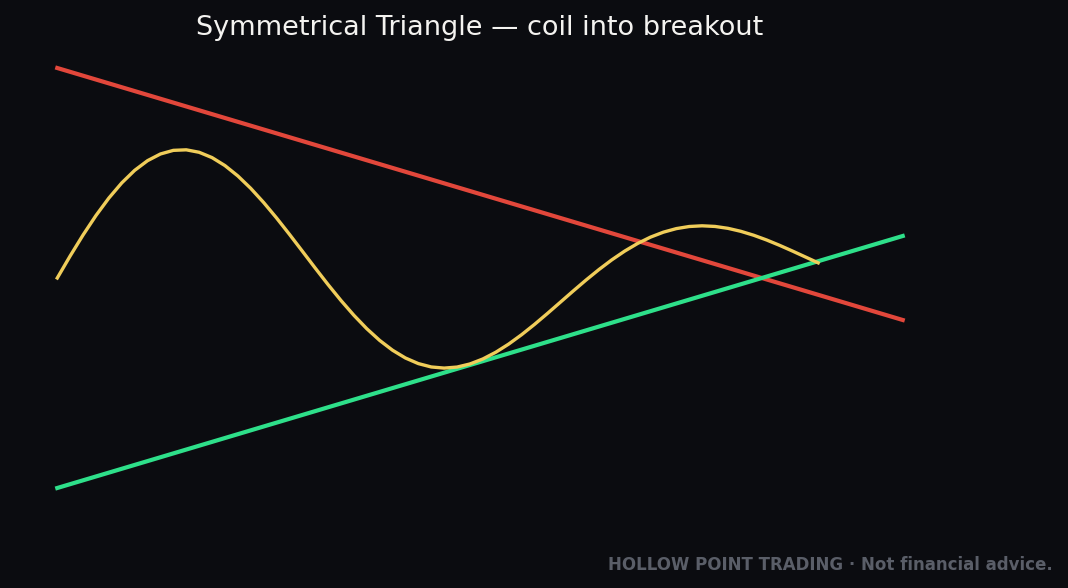
Notice what both plans share: you never enter on the touch itself. The touch is just price arriving. You wait for the reaction — the rejection candle or the break-and-retest — because that's the market voting. This one habit eliminates most bad trades. You stop catching knives and stop chasing fakeouts, because you're always trading confirmation, never hope.
The third thing price can do: nothing clean
Honesty demands a third branch the textbooks skip. Sometimes price arrives at a level and gives you mush — small indecisive candles, no clear rejection, no clean break, just chop straddling the line. This is not a signal. It's the market telling you it hasn't decided. The correct response is no trade. Most of your losses at levels will come from forcing a read onto mush because you wanted a trade to exist. The reaction has to be clean to be tradeable. If you can't describe the reaction in one sentence — "long lower wick, closed back above, volume popped" — there isn't one yet.
Reject vs. Reclaim — the mental script
Walk up to every level with this script:
- "If price rejects here (wick + reversal candle), I go with the bounce, stop past the zone."
- "If price breaks and closes through, I wait for the retest, then go with the break, stop on the far side."
- "If it's mush, I do nothing."
- "Until one of the first two happens cleanly, I do nothing."
That "do nothing" is the discipline that pays. Discipline over prediction. You're not smarter than the market; you're just prepared for its moves.
Fitting the reaction into 1:3 R/R
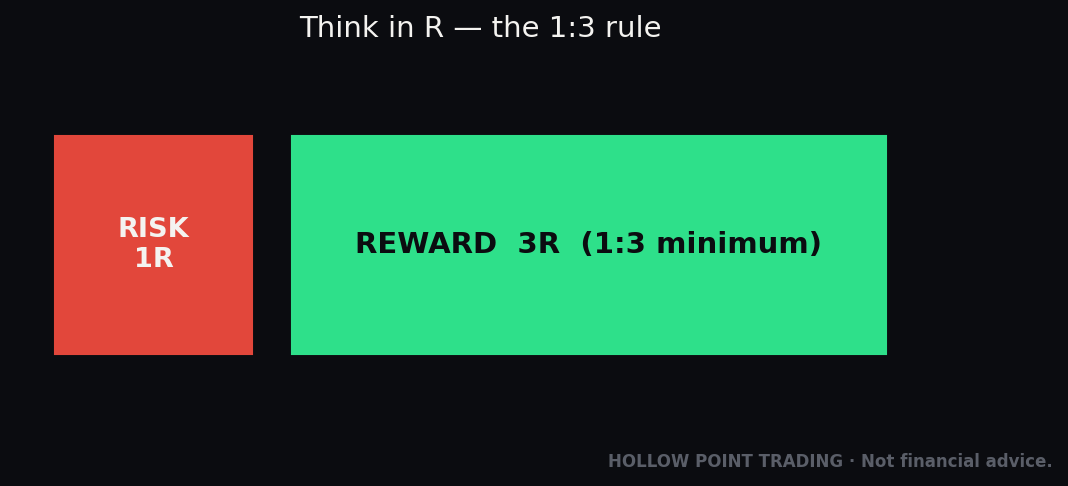
HPT trades a minimum 1:3 reward-to-risk — for every dollar risked, three targeted. Levels make this mechanical. Your risk is the distance from entry to the far side of the zone (where the read is wrong). Your reward is the distance to the next level up or down. If price is rejecting resistance with the nearest support three times the stop-distance away, the trade qualifies. If the next level is too close to pay 3:1, you pass — no matter how pretty the setup. Levels don't just find entries; they measure whether a trade is even worth taking.
Worked example: measuring a trade at the level
NQ futures pull into a daily demand zone at 19,800–19,820. You want to buy the reaction. A clean 5-minute bullish engulfing prints and closes back at 19,835. You enter at 19,840. Your stop goes below the zone at 19,788 — the point where the demand is proven failed. That's 52 points of risk. Now you measure reward: the next meaningful level up is the prior-day high at 20,010, which is 170 points away. 170 ÷ 52 ≈ 3.3. The trade pays better than 1:3 — it qualifies. Had the next level been at 19,940 (100 points, under 2:1), you pass, no matter how clean the engulfing was. The level didn't just give you the entry; it gave you the math.
Confluence: Combining Levels with Other Tools
A level alone is a location. A level plus two or three other tools all pointing at the same price is a setup. Confluence is the whole game — the more independent reasons that converge, the higher the odds. Here's how levels stack with the three tools you'll reach for most.
Levels + EMAs (the 12 / 22 / 55)
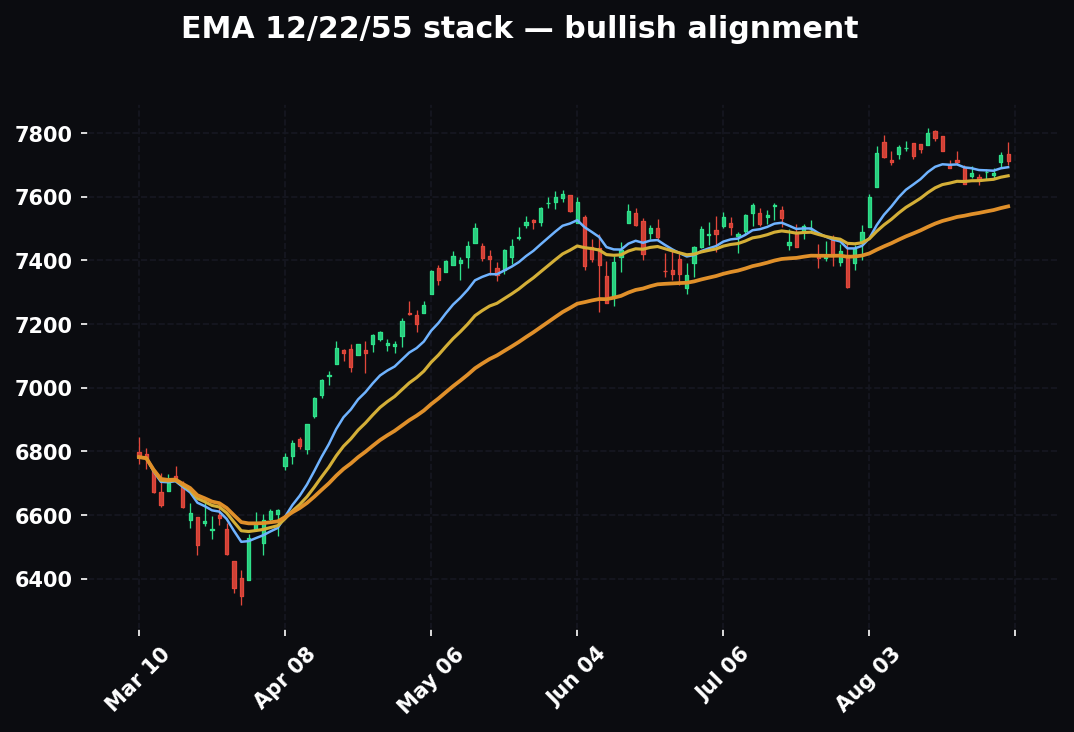
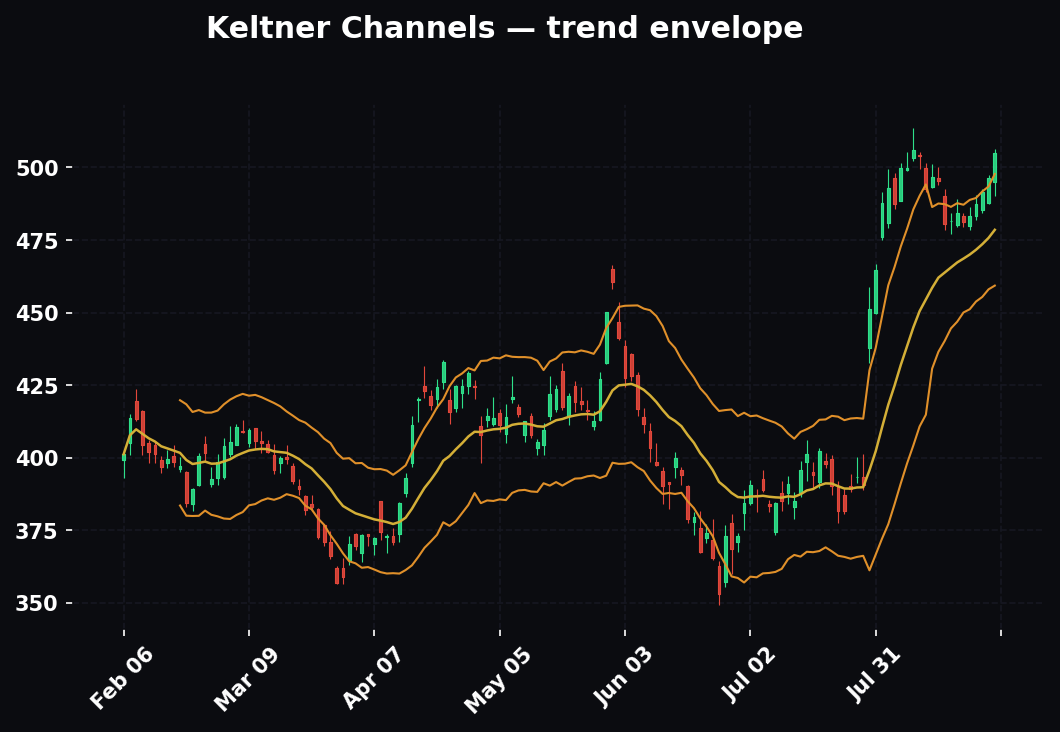
Trend is read through the 12, 22, and 55 exponential moving averages. When they're stacked in order (12 over 22 over 55) and rising, the trend is up; stacked down, the trend is down. The daily 55 EMA is the big-picture bias tell.
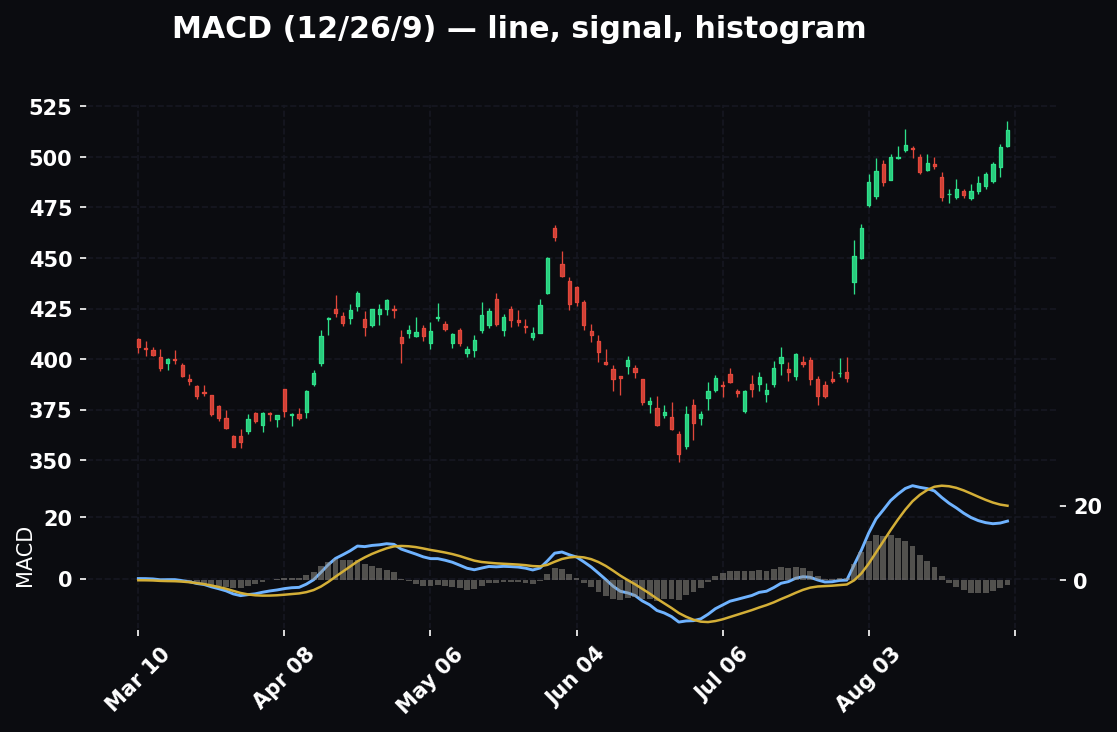
The confluence: a demand zone that lines up with a rising 55 EMA is far stronger than one floating in space, because two independent forces — the horizontal level and the dynamic trend line — arrive at the same place at the same time. A classic high-odds setup is price pulling back in an uptrend to a demand zone that sits right on the rising 22 or 55 EMA. Horizontal support plus dynamic support plus an uptrend equals a stacked long. Conversely, a resistance level with the EMAs stacked bearishly above it is a stacked short. You trade levels in the direction the EMAs already point.
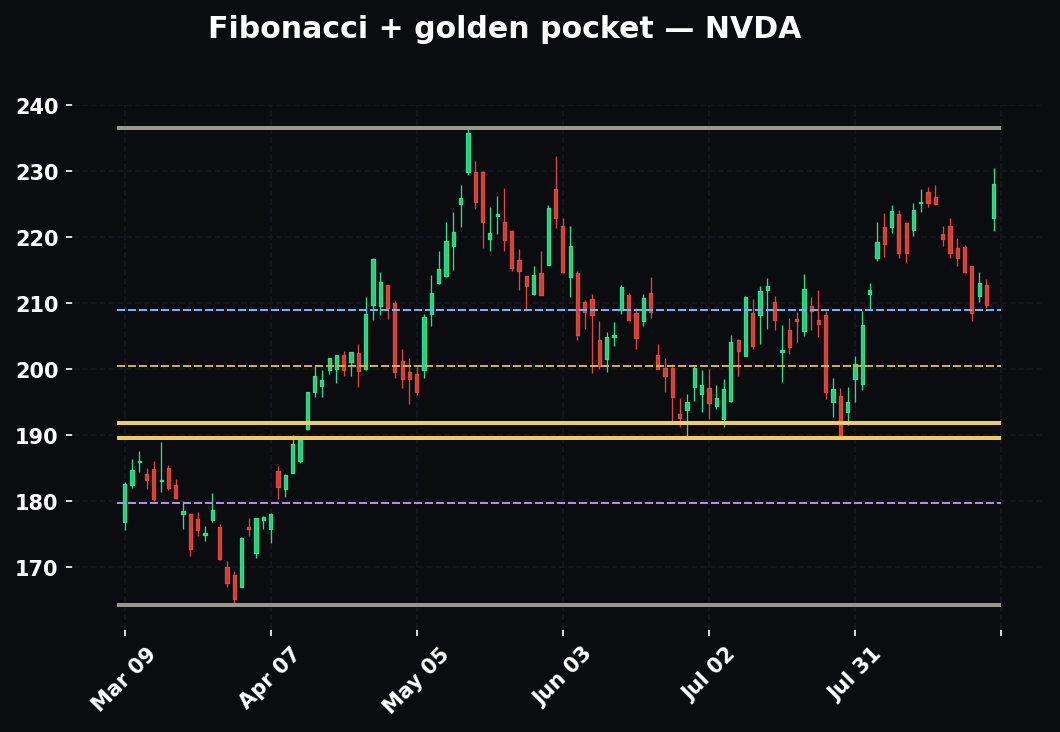
Levels + Fibonacci (the golden pocket)
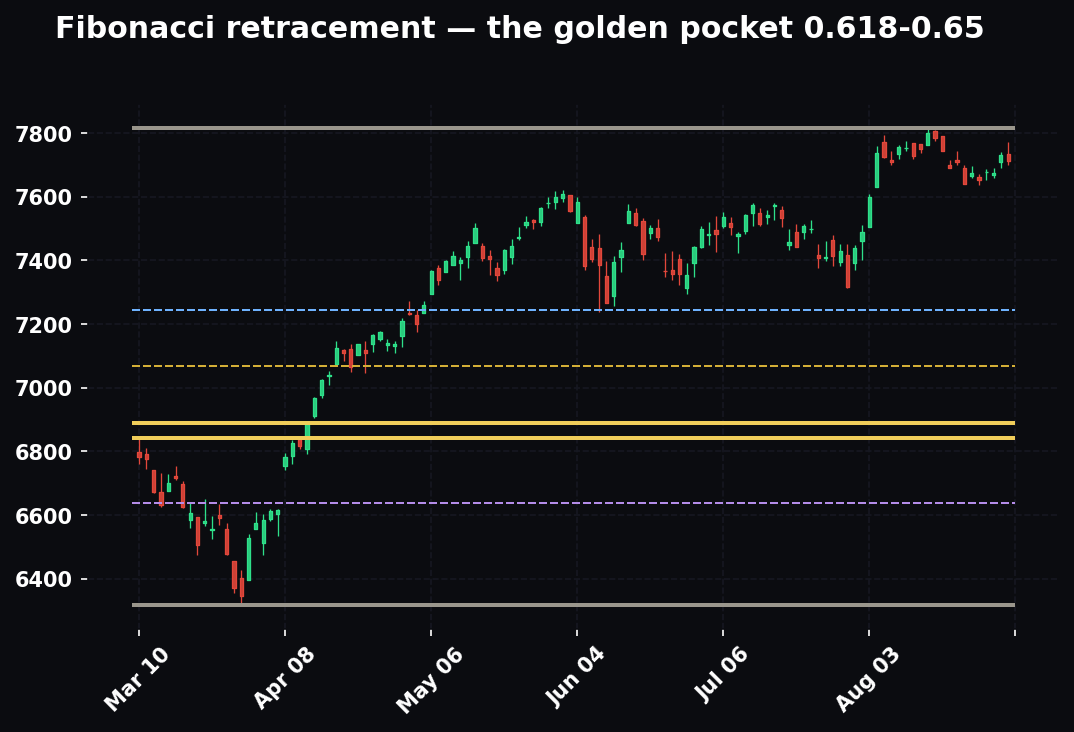
Draw a Fibonacci retracement across the trend leg and the golden pocket — the 0.618 to 0.65 retracement — is where trends most often resume. When a horizontal demand zone or a support flip lands inside the golden pocket, you have two independent methods marking the same price. That overlap is a premium entry. Price retracing into a golden pocket that also happens to be prior resistance flipped to support, on a rising EMA stack, is about as much confluence as you'll ever get for a long.
Levels + Volume
Volume is the lie detector for every reaction at a level. Two uses:
- On the break: a breakout on rising volume is far more likely to be real than a breakout on falling volume. Big volume through a level means real orders pushed through; light volume means it may be a drift that reverts. Demand a volume expansion before trusting a break.
- On the rejection: a rejection candle at support with a volume spike tells you buyers stepped in with size. A rejection on dead volume is weaker — fewer participants defended the level. The volume confirms who actually showed up.
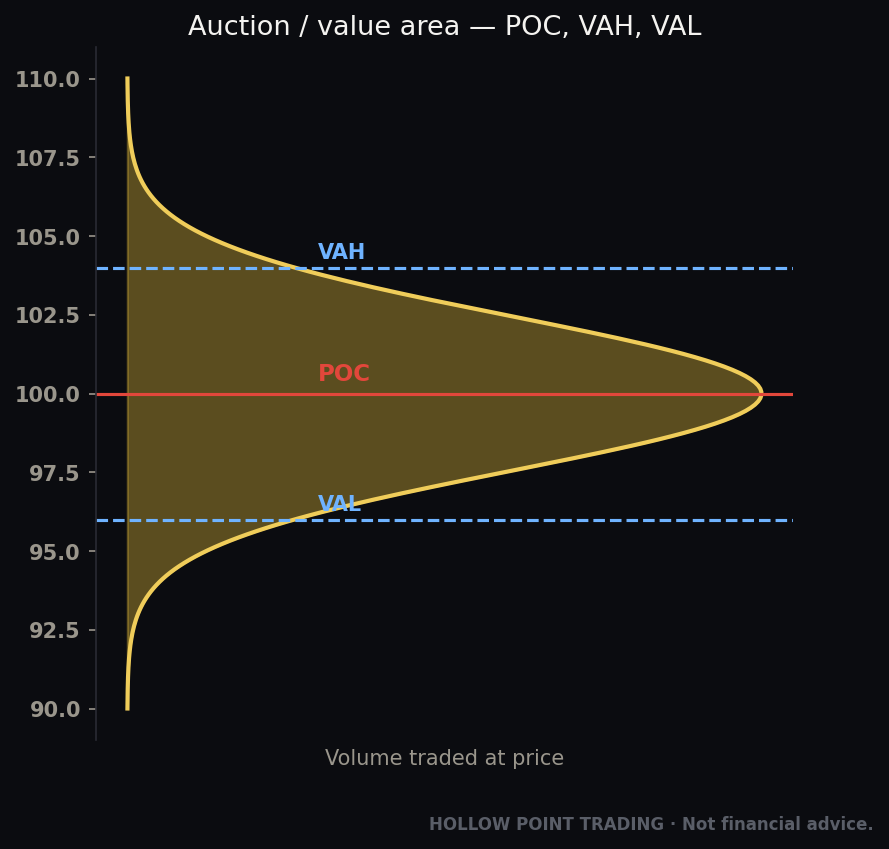
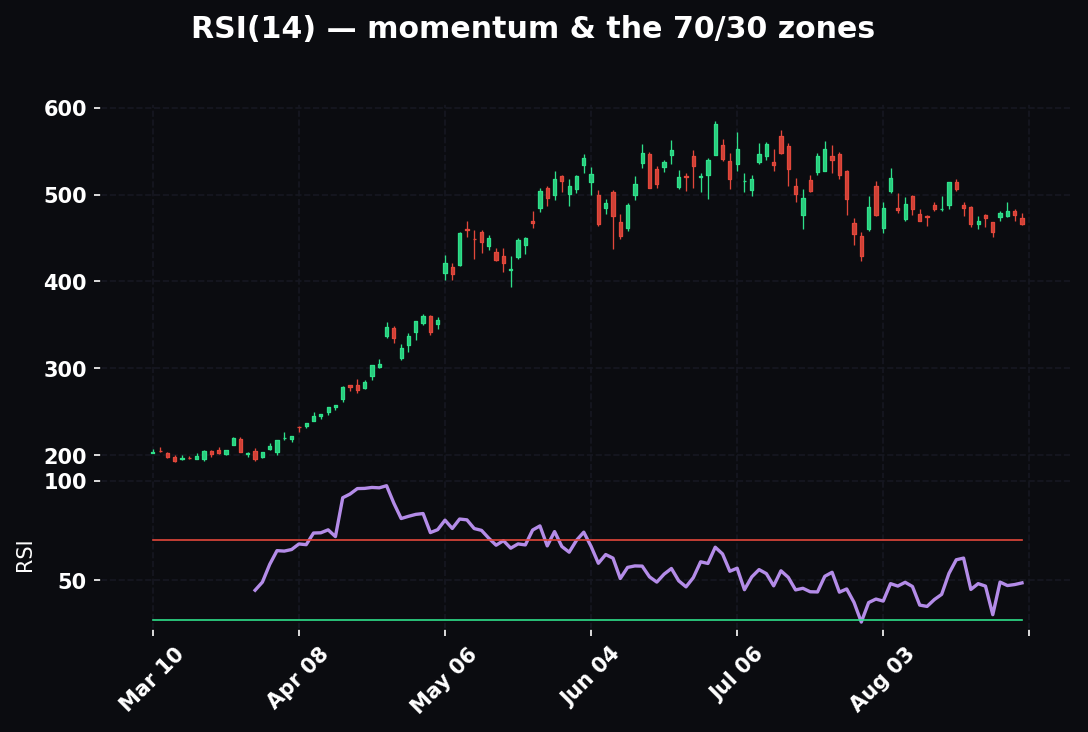
A third, deeper use is the volume profile — where the most volume has traded historically. The point of control (POC) — the single price with the most traded volume — is itself a powerful magnet and support/resistance level. When a horizontal level lines up with a volume-profile POC or the edge of a high-volume node, you've found a price the market genuinely cares about. Value-area edges (VAH/VAL) act as support/resistance the same way.
The principle across all confluence: *the level tells you where; the EMAs, fibs, and volume tell you whether the reaction is real.* One tool is a guess. Three tools agreeing is an edge.
Where This Fits: The Top-Down Process
Levels aren't the strategy. They're a layer inside a bigger frame. The HPT approach is top-down: macro → sector → stock → level.
- Macro sets the weather. Is the broad market risk-on or risk-off? What's the trend of the index, rates, the dollar? You don't fight the tape.
- Sector narrows it. Is the group your name lives in leading or lagging? Strength flows downhill from strong sectors.
- Stock (or instrument) is where you pick the horse — relative strength, its own trend.
- Level is where you pull the trigger.
Layered on top is trend, read through the EMA 12/22/55 stack described above. A demand zone in a strong uptrend inside a leading sector in a risk-on market is a very different trade from the identical zone fighting all three.
That's the whole point of confluence: *the level tells you where; the top-down read and the trend tell you whether and which way.*** A great level in the wrong context is a trap. A good level aligned with everything above it is where you press.
How the Pros Use Levels Differently from Beginners
Two traders can draw the exact same lines on the exact same chart and one makes money while the other doesn't. The lines aren't the edge. The use of the lines is. Here's where the two diverge.
Beginners predict; pros react. The beginner sees support and buys, anticipating the bounce. The pro sees support and waits — for the rejection candle, the volume, the confirmation — then buys the reaction. The beginner is right about the level and still loses because they entered before the market voted.
Beginners draw lines; pros draw zones and grade them. The beginner defends a single price to the penny. The pro trades a band and knows before price arrives whether it's an A-grade level (fresh, higher-timeframe, confluent) or a C-grade one (tired, minor, isolated) — and sizes accordingly.
Beginners see levels as walls; pros see them as liquidity. The beginner thinks price "can't get through" support. The pro knows support is where the stops are, and that price is often drawn to levels precisely to trigger those stops. The pro is not surprised by the wick through the level — they were waiting for it, because that sweep is often the best entry.
Beginners treat every level equally; pros weight by timeframe. The pro never lets a 1-minute level override a daily one. The beginner reacts to whatever line price is nearest, with no sense of which lines are load-bearing.
Beginners take every setup; pros wait for confluence. The pro passes on a clean level that lacks trend alignment, sits against the macro read, or doesn't pay 3:1. They'd rather take three A-grade setups a week than thirty C-grade ones. The beginner mistakes activity for productivity.
Beginners move stops; pros move on. When price breaks their level and holds, the pro takes the small stop and immediately looks for the trade in the new direction (the flip). The beginner widens the stop, hopes, and turns a small loss into a large one.
Beginners react to the touch; pros have already planned both branches. By the time price reaches the level, the pro has written the if-reject-then and the if-break-then in advance. There's no decision to make in the heat of the moment — just execution of a pre-written plan. The beginner is improvising at the worst possible time.
The Common Mistakes
Learn these so you can skip the tuition.
1. Drawing too many levels. Clutter is indecision. If everything's a level, nothing is. When your chart has a line every few points, price is always "near a level" and the concept loses all meaning. Keep the few that matter and delete the rest.
2. Demanding penny-perfect precision. Use zones. Price grabbing stops a hair past your line and reversing is normal — a thin line would've stopped you out of a winning read. The overshoot isn't the level failing; it's the level working exactly as designed, sweeping liquidity before the turn.
3. Entering on the touch. The cardinal sin. You're predicting instead of reacting. Wait for the rejection candle or the break-and-retest. Always. The touch is just price arriving at the address; you wait to see who answers the door.
4. Ignoring the timeframe hierarchy. A 1-minute level does not override a daily level. When they conflict, the higher timeframe wins. Every time. Beginners get chopped up trading tiny levels straight into a major higher-timeframe zone they never looked at.
5. Trading levels against the trend and the top-down read. A support bounce in a hard downtrend, in a lagging sector, in a risk-off market is a low-odds fade. Levels work with context, not against it. The strongest support in the world is fragile when the whole market is falling.
6. Treating a level as permanent. Levels get used up. Each tap consumes orders. The third or fourth test of the same level is weaker than the first — fresh zones are stronger than tired ones. A level that "held four times" is not proving its strength; it's spending it.
7. Forgetting the flip. Once a level breaks and holds, it changed jobs. Keep trading it as support after it's become resistance and you'll get run over. The level didn't disappear — its role inverted, and your read has to invert with it.
8. Marrying the prediction. Price broke your level and held? You were wrong. Take the stop, respect the flip, and look for the trade in the new direction. The level didn't fail you; your unwillingness to update did.
9. Confusing a wick-through with a break. A wick past the level that closes back inside is a rejection — a signal to fade, not to chase. A full-bodied close beyond is a break. Beginners see the wick poke through, panic, and take the exact wrong side. Wait for the close.
10. Chasing the break instead of waiting for the retest. Even a real breakout usually retests. Entering at the moment of the break gives you a terrible stop location and often a worse fill. Waiting for the retest gives you a tight, obvious invalidation and a far better entry. Patience at the break is worth more than speed.
11. Ignoring volume on the break. A breakout on dead volume is a fakeout waiting to happen. If price "breaks" a level with no volume expansion, assume it's a drift that reverts until proven otherwise. Volume is the difference between a break with conviction and a trap.
12. Sizing the same on an A-grade and a C-grade level. Not all levels deserve the same risk. A fresh, higher-timeframe, confluent level aligned with the trend deserves full size. A tired, minor, isolated level against context deserves a scalp or a pass. Flat-sizing everything means your worst setups quietly bleed away what your best ones earn.
Frequently Asked Questions
How many times can a level be tested before it breaks? There's no fixed number, but the principle is fixed: every test weakens it. The first test meets the largest crowd of resting orders and is the highest-odds hold. By the third or fourth test, the orders are thinned out and the odds of a break rise sharply. Repeated testing isn't strength — it's price grinding away the level's fuel. When you see a level tested many times in quick succession, lean toward it breaking, not holding.
Do support and resistance work on every instrument and timeframe? Yes — they're a product of human behavior and order flow, which exist in every market with enough participants. Stocks, futures, forex, crypto, indices: all respect levels. They're fractal, working the same way on a 1-minute and a monthly. The main variable is liquidity: thin, low-volume instruments give messier, less reliable levels because there aren't enough participants to build the memory and orders that make levels work.
What's the real difference between support/resistance and supply/demand? They're two lenses on the same thing. Support/resistance is the horizontal-level view — a price that has mattered repeatedly. Supply/demand is the order-block view — the specific base a big impulsive move launched from. S/R is better for the big, obvious, everyone-sees-them levels; supply/demand is better for pinpointing the freshest, tightest entry inside a zone. Use both: S/R for the neighborhood, the order block for the doorway.
Should I use the wick or the body to draw a level? Draw a zone that captures both — from the cluster of bodies to the wick extreme. If forced to pick a single line, bodies represent where price closed (stronger consensus) and wicks represent the extreme (where stops sat). Many pros mark both edges and treat the space between as the zone, watching how price behaves as it moves through it.
How do I trade a level when there's a news catalyst? Widen your zones, demand a much stronger reaction, cut your size, and consider standing aside for the first violent minutes. A level drawn in calm conditions isn't reliable in the first bars of a shock — the order book gets swept away. Let price re-form a reaction after the initial spike, then trade that. Never assume a pre-news level will hold a post-news market without fresh confirmation.
What if price is between two levels with nothing nearby? That's no-man's-land, and the honest answer is usually no trade. The best level trades happen at levels, where you have a clean reaction to read and a nearby invalidation. In the middle of a range, you have neither — no clear signal and a distant, expensive stop. Wait for price to reach an edge.
How is an order block different from regular support? An order block is a specific candle — the last opposite-colored candle before an impulsive move — whereas regular support is a horizontal price that has reacted repeatedly. The order block is more precise and is graded on the strength of the move that left it. Think of it as a high-resolution version of support, most powerful when it also lines up with a horizontal level.
Can I automate level-drawing with an indicator? Indicators can mark candidates — pivots, prior-day levels, volume-profile nodes — and that's genuinely useful for not missing anything. But grading a level (fresh vs. tired, aligned vs. against context, A-grade vs. C-grade) and reading the reaction still require judgment. Use tools to surface levels; use your own eyes to trade them.
The Cheat-Sheet
Pin this.
What they are
- Support = floor (buyers stop the fall). Resistance = ceiling (sellers stop the rise). Same price flips roles depending on which side price approaches from.
- They exist because of memory (trapped/regretful traders), orders (resting limits + clustered stops), and psychology (round numbers).
How to mark
- Zones, not lines. Body-to-wick band, no wider than the candles that made it.
- Top-down: mark higher timeframe first, then drill down. Higher TF outranks lower.
- Draw from repeated or violent reactions. Scroll left for evidence.
- Color-code by weight. Fewer, cleaner levels. Delete the dead ones. Update every morning.
The key levels
- Prior Day High/Low (PDH/PDL) — reset daily, most-watched.
- Prior Week / Month High/Low — heavier, for swings.
- Overnight / prior-session high/low — where liquidity built while you slept.
- Round numbers — centers of zones, not exact lines; whole thousands beat five-hundreds beat hundreds.
- Swing highs/lows — the raw structure.
- Opening range — frames the intraday day.
Supply/Demand
- Demand = sharp rally's launch base. Supply = sharp drop's launch base.
- Order block = last opposite candle before the impulsive move.
- Best zones: impulsive departure, tight base, fresh (unmitigated), confluent with a horizontal level.
- Grade every zone A/B/C before trusting it.
The flip
- Broken support → new resistance. Broken resistance → new support.
- Real break = full-bodied close through + retest that holds. Wick-through that closes back inside = rejection, fade it.
- Break-and-retest of a flipped level = premium entry. Failed flip = signal in the opposite direction.
Regimes
- Trend: buy dips to support in an uptrend; treat resistance as break-and-retest. Don't fade the trend at a counter-trend level.
- Range: fade both edges — sell resistance, buy support. Distrust breakouts.
- High-vol: widen zones, demand stronger reactions, cut size, or stand aside until price re-forms a reaction.
Multi-timeframe
- Context TF (daily/weekly) = whether + which way. Setup TF (1H/15m) = structure. Execution TF (5m/1m) = the reaction.
- Highest odds = all three timeframes aligned. Timeframes fighting = no trade.
Confluence
- Levels + EMA 12/22/55 stack (trade with the trend).
- Levels + golden pocket 0.618–0.65 (overlap = premium entry).
- Levels + volume (break needs rising volume; rejection needs a volume pop; POC/value-area edges are levels too).
Trading the reaction (never predict)
- Reject: rejection wick / reversal candle → go with the bounce, stop past the zone.
- Reclaim: close through + hold → wait for retest → go with the break, stop on the far side.
- Mush: no clean reaction → no trade.
- Never enter on the touch. Wait for the market to vote.
- Risk = entry to far side of zone. Reward = distance to next level. Demand 1:3 or pass.
- Align with trend (EMA 12/22/55) and the macro → sector → stock read.
Levels are the closest thing trading has to a repeatable map. They won't tell you the future — nothing does. But they'll tell you where the fight happens, why it happens there, and how to know who won before you commit a dime. Mark them clean, respect the higher timeframe, wait for the reaction, size to the grade, and let price prove itself. Do that consistently and you'll trade the ten prices that matter instead of the ten thousand that don't.
Bound by rules, feared by trade.