
Chart patterns have a reputation problem, and it's earned. Open any trading forum and you'll find someone who lost money "buying the bull flag" or "shorting the head and shoulders" — and they're not wrong that it failed. What they're missing is that patterns were never supposed to be traded as standalone magic shapes. A pattern is a map of order flow — a picture of who's trapped, who's accumulating, who's about to be forced to act, and where the stops are piled up. Read that way, patterns are one of the most useful tools you own. Traded as horoscopes — "it looks like a W, therefore up" — they'll bleed you dry one confident click at a time.
This guide does two things, and it does them at a depth most paid courses never reach. First, it teaches you the patterns that carry real edge — the structure, the target math, the volume fingerprint, the entry, the exact line that kills the trade, and how often each one actually fails in the wild versus in a textbook. Second, and more important, it shows you the HPT way to trade them: never naked, always inside the top-down process, filtered through the EMA 12/22/55 trend read, weighted across timeframes, and ideally entered through the undercut-retest-into-breakout sequence that turns a coin-flip pattern into a genuinely high-probability entry.
If you take one thing from this: the shape is the least important part of trading a chart pattern. The context around it and the entry mechanics inside it are where the money lives.
Let's build it from the ground up.
The Concept: A Pattern Is a Story About Trapped Money
Every pattern is the same underlying event repeating at different scales: a fight between buyers and sellers that resolves in one direction, leaving the losers trapped and forced to fuel the move as they cover their positions. That's it. That's the whole thing. Once you see patterns as forced-buying and forced-selling machines rather than shapes, you stop asking "is this a flag?" and start asking "who's stuck, and what makes them puke?"
A reversal pattern marks the end of a trend. The prevailing side runs out of fresh participants — everyone who wanted in is already in — the other side takes control, and price changes direction. A continuation pattern is a pause, not a turn — a rest stop where the trend catches its breath, weak hands and early profit-takers get shaken out, fresh buyers replace them at higher prices, and then the original move resumes.
Three ideas carry through everything below, and you should be able to recite them in your sleep:
- The measured move. Most patterns give you a built-in first target: measure the height of the pattern and project it from the breakout point. It is not a guarantee and it is not a ceiling — it's a first, statistically-grounded objective, a place where you should already be planning to take risk off the table. Treat it as "where the pattern says it should at minimum reach," not "where it will stop."
- The volume signature. Volume is the lie detector. Real patterns have a characteristic volume shape — usually contracting during the pattern's formation, then expanding hard on the breakout. A breakout on no volume is a rumor; a breakout on a volume surge is news. When price and volume disagree, believe volume.
- The location. A pattern at a meaningful level — prior swing high, a monthly gap fill, the daily 55 EMA, a round number where options sit — carries ten times the weight of the identical pattern floating in the middle of nowhere. Patterns are not created equal; where they form is half their value.
Before we go pattern by pattern, define these once and we'll reuse them throughout. A swing high/low is a local peak/trough — a candle with lower highs on both sides (high) or higher lows on both sides (low). Support is a price floor buyers have defended; resistance is a ceiling sellers have defended. A breakout is price closing decisively beyond a boundary — a wick through it is a probe, a close beyond it is a commitment. A retest (also called a throwback or pullback) is price returning to that broken boundary to check whether it now holds as the opposite — broken resistance becoming support, broken support becoming resistance. A stop run or liquidity grab is a fast poke beyond an obvious level, designed (by the market's structure, not a conspiracy) to trigger the resting stop orders clustered there before reversing. Keep "liquidity grab" close — it's the engine behind the HPT entry.
The Mechanism: Why Shapes Repeat
Markets are made of humans and the algorithms trained on them, and both respond to the same few forces: fear of missing out, fear of loss, the pain of a losing position, and the mechanical reality of stop orders clustered at obvious levels. Patterns repeat because those forces repeat. The chart is just where the emotion leaves fingerprints.
Take a double top. Price rallies, fails at a high, pulls back, rallies again to roughly the same high, and fails again. Why does the second failure matter so much more than the first? Because the first failure taught everyone where the ceiling is. Longs who bought the first push up are now nervous — they've watched price reject once. Shorts now see a defined, cheap risk level: they can short with a stop just above the high, risking little. New longs hesitate to buy into obvious resistance. So when the second push fails, three things hit at once: nervous longs bail, emboldened shorts press, and sidelined buyers stay sidelined. The "pattern" is just the visible residue of that psychology playing out. When price then breaks the middle trough, the longs who bought both pushes are now underwater and start dumping — that's the fuel that drives the measured move.
This is why patterns work better on higher timeframes and on liquid instruments: more participants, more memory, more stops resting at obvious levels, cleaner reactions. A daily double top on a major index has thousands of traders watching the same ceiling. It's also precisely why the same shape on a 1-minute chart of a thin, illiquid stock is noise — there aren't enough players for the psychology to bind, and a single large order can erase the whole structure.
Keep this mechanism in your head the entire way through. The test of whether you actually understand a pattern is simple: can you explain who is trapped and what forces them to act? If you can — "the longs who bought the second push are now underwater and their stops are below the middle pivot, so the break of that pivot cascades their selling" — you understand it. If you can't, and you're just matching a shape to a picture in a book, you're trading pixels, and pixels don't have edge.
Reversal Patterns
Reversals are harder to trade than continuations, full stop. You are fighting an established trend, betting it's exhausted, and "the trend is exhausted" is a claim the market disproves for a living. Trade reversals with more evidence, more confluence, and smaller size than continuations until each specific setup has earned your trust. Bottoms and tops also behave differently: bottoms tend to be rounded, drawn-out processes (fear bleeds out slowly), while tops tend to be sharp, violent events (greed snaps). That asymmetry matters for which reversal patterns you trust more.
Head and Shoulders
The most famous reversal, and one of the more reliable when it's genuinely clean — which most aren't.
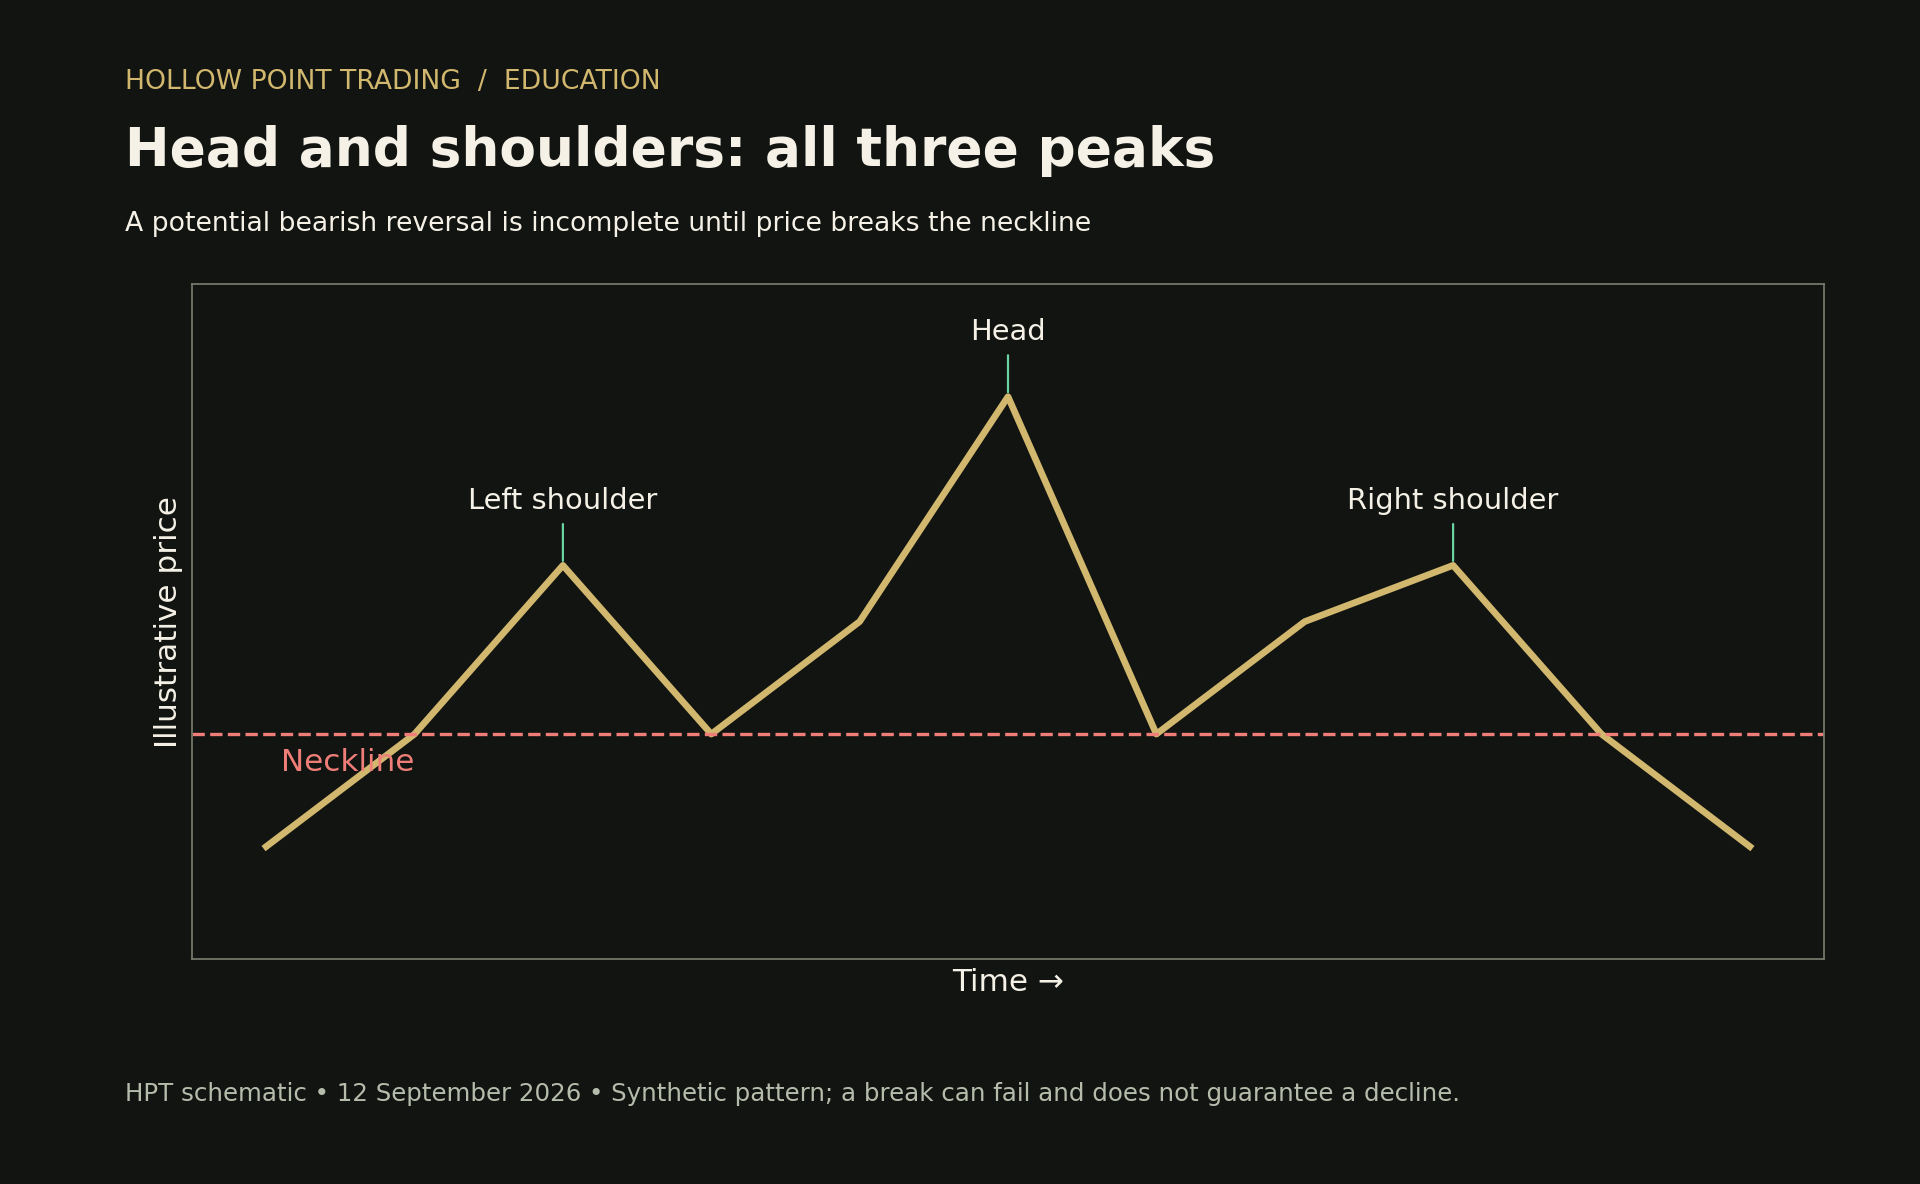
Structure. Three peaks: a left shoulder, a higher head, then a right shoulder roughly level with the left. Connect the two troughs between the peaks and you get the neckline — it can slope up, down, or run flat, and a down-sloping neckline is generally the more bearish (it means each recovery is weaker). The mirror version at a bottom — the inverse head and shoulders — is three troughs with the middle one lowest, and it signals a bottom reversal. The inverse version is the one you'll trade more often as a long-biased trader, and it's frequently the tail end of a larger basing process.
Volume signature. This is the tell that separates real from fake, and it's the first thing to check. Volume is typically highest on the left shoulder and the head — those are the moves that carry conviction — then noticeably lighter on the right shoulder. The last push up is running on fumes; the buyers who could show up already showed up on the head. The break through the neckline should then come on expanding volume as the trapped longs bail. If the right shoulder forms on heavier volume than the head, be suspicious — that's not exhaustion, that's fresh demand, and the pattern may not resolve down.
Measured move. Measure the vertical distance from the top of the head down to the neckline (measured at the point directly below the head). Project that same distance down from the point where price breaks the neckline. That's your first target.
Worked example. Say a stock runs to a left shoulder at 148, pulls back to 140, pushes to a head at 156, pulls back to 141, then makes a lower right-shoulder high at 149 on visibly lighter volume. The neckline sits around 140.5. Head-to-neckline height is 156 − 140.5 = 15.5. Price breaks the neckline at 140. First target: 140 − 15.5 = 124.5. If you entered the retest at, say, 141 with a stop at 150.5 (just above the right shoulder), you're risking 9.5 to make 16.5 to the measured move — about 1:1.7 — which is not good enough for HPT on its own. This is exactly why we don't trade the naked version: the undercut-retest entry (covered below) drops that stop to just above the reclaim, tightening risk and blowing the R/R out past 1:3.
Entry & invalidation. The classic entry is the close below the neckline. The HPT-preferred entry is the retest: price breaks the neckline, then throws back up to kiss it from below and fails to reclaim — you enter on that failure with a much tighter stop. Invalidation is a close back above the right shoulder's peak (or above the neckline with conviction, depending on how aggressive your entry was). The entire thesis is dead if the right shoulder gets exceeded — at that point there's no exhaustion, there's a new leg up.
How often it fails. In real-world testing — Bulkowski's decades of hand-tabulated pattern data remain the standard reference — the head and shoulders top has one of the lower failure rates among reversals, on the order of one in twenty reaching its "break-even failure" threshold under ideal conditions. But read that honestly: those are cherry-picked, textbook-clean examples with perfect volume and clear necklines. In live trading with sloppy necklines, an asymmetric right shoulder, and no confluence, treat any single pattern as closer to a coin flip and let the process tilt it. The failure mode to fear most is the "failed H&S that becomes a continuation" — price breaks the neckline, sucks in shorts, then reclaims everything and rips to new highs, trapping the reversal traders. That reclaim above the right shoulder is your hard line; respect it.
Double Tops and Double Bottoms
The workhorses. You'll see these constantly, on every timeframe, on everything.
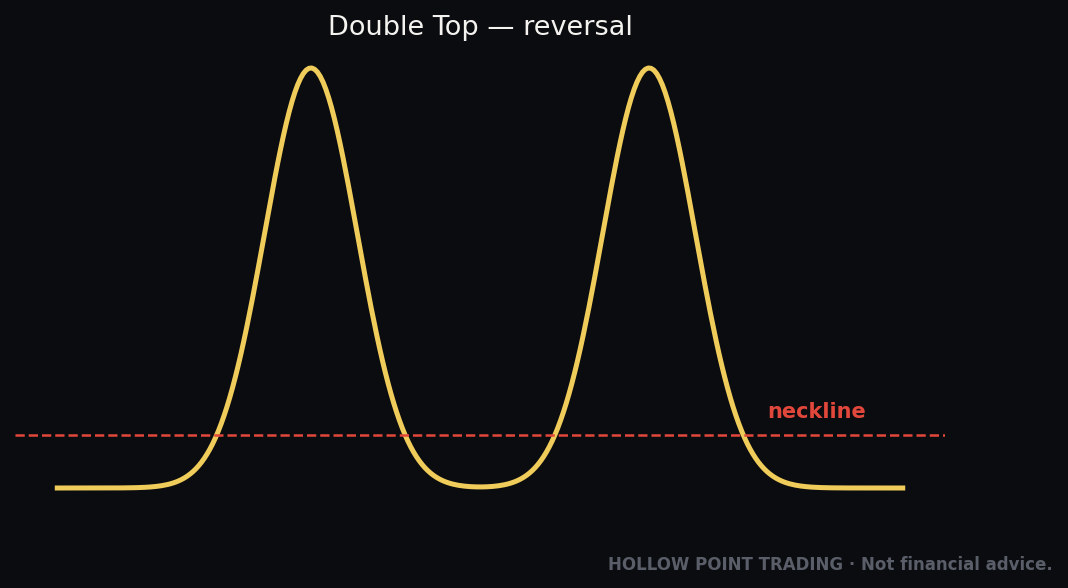
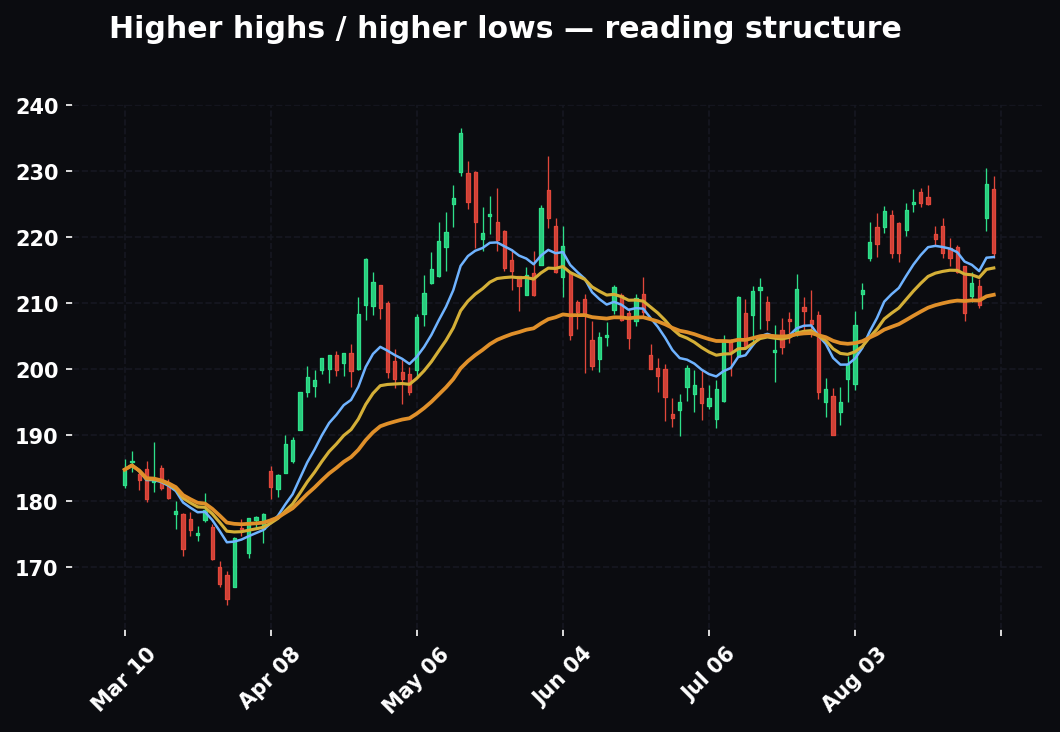
Structure. A double top (the "M" shape) is two peaks at roughly the same price with a trough between them. Critical point most beginners miss: the pattern only confirms when price breaks below that middle trough. Until then it's just two highs, and two highs is not a pattern — it's a maybe. A double bottom (the "W") is the mirror: two troughs at the same level, confirmed on a break above the middle peak.
Volume signature. The second peak usually comes on lighter volume than the first — demand is fading, fewer buyers showed up to make the same high. The confirmation break should expand. On a double bottom, ideally the second low comes on lighter selling volume (sellers exhausting) and the break of the middle peak surges.
Measured move. Height from the peaks down to the middle trough, projected down from the breakdown point — and the inverse for bottoms (height from troughs up to the middle peak, projected up from the breakout).
Worked example. An index bounces off 4,180 twice — a low at 4,182 then a slightly higher low at 4,185, with a middle peak at 4,240. That's a double bottom. Height = 4,240 − 4,182 = 58. Break of 4,240 projects to 4,298. But notice the "slightly higher second low" — that's not a flaw, that's often the strongest version, because it means sellers couldn't even reach the first low. The strongest version of all is when the second low pokes below the first (a fresh low that fails immediately) — that's the undercut, covered next, and it's the highest-probability variant because it runs every stop below the pattern before reversing.
Entry & invalidation. Do not short the second touch of the top on hope — that's guessing at the ceiling, and it's how you get run over on the third push. Confirmation is the break of the middle pivot, full stop. Invalidation is a new high above the pattern (for a top) or a new low below it (for a bottom). The two highs don't need to be pixel-perfect; within a fraction of a percent is fine, and as noted, a slightly higher second high that fails hard is often the strongest version — it ran the stops of everyone who shorted the exact first top, then rolled over on them.
How often it fails. Double bottoms that break out and hold the retest have a solid track record. The common, expensive failure mode is the "confirmation" that immediately fails and rolls back into the range — you buy the break of the middle peak, and price rejects right there and dumps back to the lows. That single failure mode is why waiting for the break and a successful retest cuts your losers dramatically, at the cost of a slightly worse entry price. That trade is almost always worth making.
Triple Tops and Bottoms
Same logic, three touches instead of two. A level tested three times is more significant and more obvious — which cuts both ways, and you have to hold both truths at once. Three failed pushes into resistance is genuine, visible exhaustion. But it's also a level every algorithm and every retail trader can see, so the eventual break is very often preceded by a stop run through the level first — a fake-out that clears the stops resting just beyond it. Trade a triple like a double, with even more respect for the undercut/overshoot fake-out before the real move. The more obvious the level, the more likely it gets swept before it breaks for real. Obviousness is not safety; obviousness is a target painted on the level.
Rounding Tops and Bottoms (Saucers)
Structure. A slow, curved change of direction with no sharp pivot — a gradual roll, like a ball settling into and rolling out of a bowl. The rounding bottom (saucer) is that bowl: selling decelerates, price flattens and grinds, buying gradually takes over, and the curve turns up. Rounding tops are the dome version and are meaningfully less reliable — remember, tops are typically sharp events, so a slow rounded top is fighting the grain of how tops usually form.
Volume signature. Classic and beautiful, and the cleanest confirmation of any reversal: volume is high on the way in (the last of the sellers), dries up almost to nothing at the bottom of the bowl (nobody left to sell, nobody yet interested in buying), then rebuilds steadily as price curls up and buyers wake up — a "U" in volume that mirrors the "U" in price. If you can see that volume U, you have a real saucer. If volume is erratic through the base, you have a range that happens to look curved.
Measured move. Depth of the bowl projected up from the breakout of the rim. These are slow, patient patterns — often weeks or months on a daily chart — and their targets take time to reach. They reward position traders, not scalpers.
Entry & invalidation. Enter on the break of the rim (the horizontal that caps the right side of the bowl); invalidation is a decisive close back down into the bowl. Rounding bottoms very often morph into a cup and handle — the saucer is the cup, and the mild pullback after the rim break is the handle. Hold that thought; we'll come back to it, because the two patterns are cousins and the cup-and-handle entry is the more tradeable of the two.
Continuation Patterns
These are the bread and butter of trend trading, and if you only ever mastered continuations you'd have a complete, profitable methodology. The trend is your friend; continuation patterns are simply where you get on board mid-move without chasing an extended candle. They have a structural advantage over reversals: you're betting with the established force, not against it. Lower degree of difficulty, better base rates, easier to hold.
Flags and Pennants
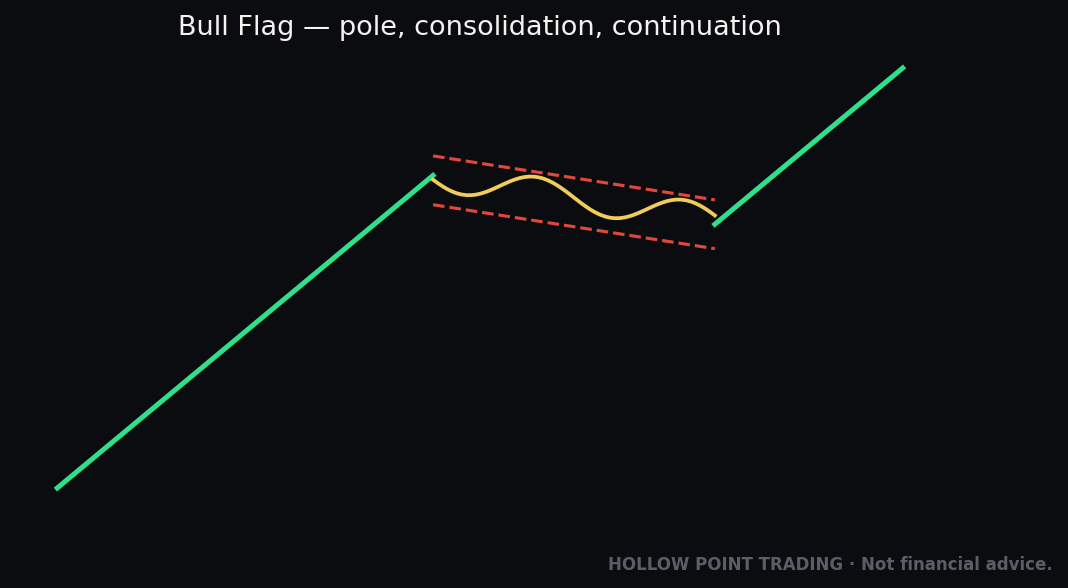
Structure. After a sharp, near-vertical move (the flagpole), price consolidates in a small, tight, counter-trend drift. A flag is a small rectangle or parallel channel that slopes against the trend — a bull flag drifts gently down, a bear flag drifts gently up. A pennant is a tiny symmetrical triangle — a coil that winds tighter. Both are short by nature: a handful of bars, days on a daily chart, minutes on an intraday chart. This is the single most important qualifier and the one people ignore: if it drags on too long, it's not a flag anymore, it's a range, and ranges behave completely differently. A flag that's been going for twenty bars has lost the coiled-spring tension that makes a flag work.
Volume signature. The single most reliable volume tell in all of chart-reading, and the one to burn into memory: huge volume on the pole, volume drying up completely through the flag, then a volume surge on the breakout. The pole is conviction, the flag is rest (nobody's fighting, the sellers who wanted out got out), the break is the trend resuming with force. No volume contraction in the flag = be suspicious; that's not resting, that's active distribution, and the "flag" may be a top.
Measured move. Measure the flagpole — from the base of the impulsive move up to where the flag started — and project that full distance from the breakout point. Flags are famous for flying at "half-mast," meaning the flag tends to form around the midpoint of the total move, so the pole often repeats in full. That's a powerful, specific expectation: a clean flag off a strong pole projects a move roughly equal to the pole itself.
Worked example. A stock bases at 50, then rips to 62 in three big green candles on triple its average volume — a 12-point pole. It then drifts down to 59 over four small red candles on fading volume — a textbook bull flag. Pole = 12. Flag started at 62. Break of the flag's upper edge at 60.5 projects 60.5 + 12 = 72.5 (or, projecting from the flag start, 62 + the remaining half ≈ same neighborhood). Entry on the break at 60.5, stop below the flag low at 58.8 (risk ≈ 1.7), target 72.5 (reward ≈ 12). That's better than 1:6 on the measured move — this is why HPT loves clean flags off real poles. The tight pattern gives a tight stop; the pole gives a big target; the math takes care of itself.
Entry & invalidation. Enter on the break of the flag's upper boundary (bull) in the direction of the pole. Invalidation is a break back through the other side of the flag, or a close below the flagpole's origin — if price erases the whole pole, there was nothing to continue. Tight patterns mean tight stops mean fat R/R, which is exactly why HPT prizes flags for the 1:3-plus mandate.
How often it fails. Flags in a strong, clean trend are among the highest-probability continuations that exist. But they fail constantly when the "flagpole" wasn't a real impulse — a weak, choppy, overlapping move with a flag drawn on top has nothing to continue, because there was never any conviction to resume. *The pole quality is the edge.* Before you trade any flag, interrogate the pole: was it sharp, was it on volume, did it break a level to get here? A flag off a limp pole is a trap dressed as a setup.
Triangles
Triangles are consolidations where the range narrows into an apex — buyers and sellers converging until one side gives. Three flavors, and the distinction is directional bias:
Ascending triangle. Flat top (horizontal resistance at one price), rising lows (a higher-low trendline climbing into the flat top). The story: buyers are getting more aggressive — willing to pay up sooner each time — while a wall of sellers holds one specific price. Each higher low means the buyers are absorbing supply. Bias: bullish, breaks up most often. Measured move: the height of the triangle at its widest (the left side) projected up from the breakout.
Descending triangle. Flat bottom (horizontal support), falling highs. Sellers pressing lower each time, buyers holding one floor. Bias: bearish, breaks down most often. Same target math, projected down. (Note: in a strong overall uptrend, descending triangles break up more often than the textbook admits — the higher-timeframe trend overrides the local pattern bias. Location beats shape.)
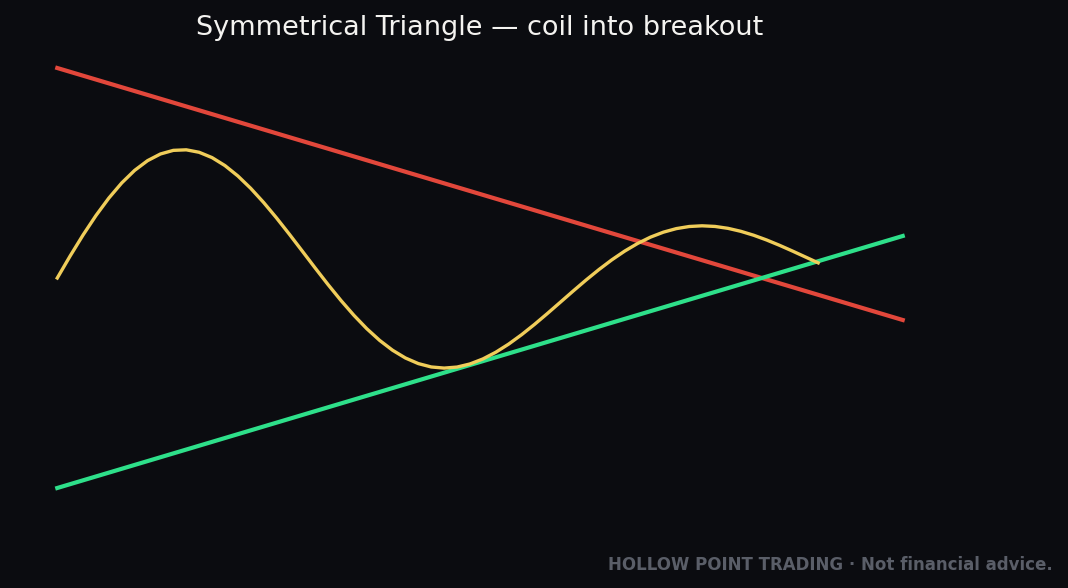
Symmetrical triangle. Lower highs and higher lows — a true coil, both sides tightening symmetrically toward the apex. Neutral by itself; statistically it's a continuation of the prior trend most of the time, so the default is to trade it in the direction of the move that came before it. Wait for the break — do not guess the direction of a symmetrical triangle before it resolves, because guessing the coil is a 50/50 bet with extra steps.
Volume signature. Volume contracts steadily as the triangle tightens toward the apex — the coil winding down — then expands sharply on the break. This is the confirmation. A break that happens before volume has dried up, or one with no expansion behind it, is prone to failure and to reversing straight back through the apex.
Entry & invalidation. Enter on the decisive close beyond the relevant trendline. Best practice, and a rule pros follow that beginners don't: don't let price get too deep into the apex before it breaks. Breakouts from the last 25–40% of the triangle's horizontal length are weaker and whip more, because the coil has lost its energy and price is just grinding into the point. The strongest breaks come from roughly the halfway-to-two-thirds mark. Invalidation is a close back inside the triangle, or better, a close beyond the opposite boundary.
How often it fails. Symmetrical triangles are notorious for false breaks — a poke one way to grab the stops, then the real move the other way. This is the pattern where the undercut-retest sequence saves you the most money over a career, because the first break is so often the trap. If you take one habit from this section: never trust the first break of a symmetrical triangle without confirmation.
Wedges
Structure. Like a triangle, but both boundaries slope the same direction while still converging. A rising wedge has both lines sloping up but the lower line rising faster, so they pinch — and it's bearish (buyers are exhausting; each push up is smaller and the higher lows are getting crowded). A falling wedge has both lines sloping down and converging — and it's bullish. This is counterintuitive until you internalize it: *the wedge slopes with price but signals against it.* A market grinding higher in a narrowing rising wedge is running out of gas even as it makes new highs — the new highs are getting smaller and coming harder.
Wedges show up as both reversal and continuation patterns depending on where they sit in the larger structure. A falling wedge after a downtrend is a reversal up; a falling wedge as a pullback inside an uptrend is a continuation up. Either way, the direction rule holds: falling wedge resolves up, rising wedge resolves down. Context tells you whether it's a turn or a pause; the shape tells you the direction.
Volume signature. Contracting through the wedge, expanding on the break — same as triangles. A falling wedge with volume drying up as it grinds lower, then a volume pop on the reclaim of the upper line, is the clean version.
Measured move. Less precise than triangles, and you should size your expectations accordingly. One common approach: project the height of the wedge (at its widest) from the break point. Another: expect a return toward the wedge's origin — the level where the wedge began. Because wedge targets are the loosest of any pattern here, HPT leans on structure — prior swing highs/lows, the measured moves of nearby patterns, VWAP, the EMAs — for exits rather than trusting wedge math alone. Use the wedge for the entry and direction; use structure for the target.
Entry & invalidation. Break of the wedge line in the signaled direction; invalidation on a close back inside. Rising wedges into a major top and falling wedges into a major bottom are strongest when they align with a higher-timeframe level — a rising wedge bumping into monthly resistance is a far better short than one floating in space.
Rectangles and Ranges
Structure. Price bounces between horizontal support and resistance — a box, a channel with flat top and bottom. It's a battle at a standstill: buyers defend the floor, sellers defend the ceiling, and neither can win yet. As a continuation, it resolves in the trend direction; as a reversal (a "rectangle top" or "rectangle bottom"), it caps the prior move. You don't need to predict which — in fact trying to predict a range's resolution is a fast way to get chopped — you need to trade the break when it comes, or fade the edges while it holds.
Volume signature. Often erratic and unhelpful inside the box; the meaningful tell is the breakout volume. Bonus signal, and a good one: volume often picks up near the edge that eventually breaks, because that's the wall being accumulated against. If you see rising volume on the pushes into resistance and shrinking volume on the drops to support, the box is being accumulated and likely breaks up.
Measured move. Height of the box projected from the breakout point.
Entry & invalidation. Two legitimate, mutually exclusive styles. Fade the edges: buy support, sell resistance, with stops just outside the box, while the range holds — a mean-reversion trade. Trade the break: wait for a decisive close outside the box and enter the breakout — a momentum trade. Both work. What destroys accounts is doing both blindly — buying support, then flipping to chase the breakdown when support breaks, then flipping again to chase the re-reclaim. Pick your style before you enter the range. Invalidation for a range (fade) trade is a close beyond the edge you faded; for a break trade, a close back inside the box. Ranges are where undisciplined traders get chopped to death — respect the box, pick one plan, or stay out entirely. There is no shame in refusing to trade a messy range; there's plenty of shame in the P&L of those who won't.
Cup and Handle
The trophy pattern of trend-following, popularized by William O'Neil and beloved for good reason — when it's clean, in a leading name, in a healthy market, it's about as good as continuation setups get.
Structure. A cup is a rounded bottom — a U, emphatically not a sharp V — a gradual correction and recovery that brings price back to near the prior high. The rounding matters: it means the selling exhausted gradually and buyers absorbed the supply patiently, which is the accumulation footprint you want. Then, instead of blasting straight through the old high, price forms a handle: a small, mild pullback or sideways drift near the highs, usually in the upper third of the cup, often a little downward-sloping flag or a tight quiet consolidation. The handle's job is psychological — it shakes out the last impatient holders and the breakeven sellers (the ones who bought the old high, rode it down through the cup, and just want their money back) before the real breakout, so there's less overhead supply to fight.
Volume signature. Volume dries up through the base of the cup (selling exhausted), rebuilds on the right side of the cup as buyers return, contracts again in the handle (the final quiet shakeout), then surges on the breakout through the rim. A handle that forms on heavy selling volume is a warning sign — you want the handle quiet and orderly. Heavy volume in the handle means real sellers are still present, not just impatient weak hands.
Measured move. Depth of the cup projected up from the breakout of the rim/handle high. A more conservative, HPT-friendly approach: use the handle's height for a first target (take partial risk off), and the full cup depth for the runner. Two targets, scale out, let the rest work.
Entry & invalidation. Enter on the break of the handle's high (which usually sits right near the rim of the cup). Invalidation is a break below the handle's low — and this is the beautiful part — a well-formed handle keeps its dip shallow, ideally staying in the upper third of the cup. A shallow handle means a tight stop against a full-cup target. That geometry is where the 1:3-plus R/R is born. A deep handle that erases most of the right side of the cup is a broken pattern — the shakeout became a genuine reversal — and you should pass on it.
Worked example. A stock topped at 100, corrected to 82 over several weeks in a rounded U, and recovered back to 99 — that's the cup, 18 points deep. It then drifts back to 95 in a quiet, shallow handle over a week. Handle high ≈ 99, handle low ≈ 95. You enter the break of 99, stop below the handle low at 94.5 (risk = 4.5). First target using cup depth: 99 + 18 = 117 (reward = 18), a clean 1:4. If instead the handle had sagged to 86 — into the lower half of the cup — you'd pass: the stop would be wider, the geometry worse, and the "handle" would really be a failed recovery.
How often it fails. Clean cup-and-handles in leading stocks during healthy, trending markets are among the very best continuation setups in existence. But the failure mode is real and common: a V-shaped "cup" with no rounding (panic-down, panic-up — no accumulation), a handle in the lower half of the cup (too deep, real selling), or a breakout in a weak or falling market (no wind at the back). The pattern demands patience and selectivity — most "cup and handles" people trade are half-baked V-bottoms with a wishful handle drawn on. The discipline to pass on the bad ones is most of the edge.
The HPT Edge: Undercut-Retest-Into-Breakout
Here's the sequence that changes everything, and it's the reason HPT rarely takes a naked breakout. If you internalize one section of this entire guide, make it this one — it's worth more than all the pattern definitions combined, because it's the entry mechanic that makes every one of those patterns tradeable with defined, tight risk.
The problem with textbook breakout entries is structural and unavoidable: the obvious level is exactly where everyone's stops sit, and the market's structure knows it. Stops are resting liquidity, and price is drawn to resting liquidity like water to a drain. So price frequently does the opposite of the clean pattern first — it pokes through support on a double bottom, undercuts the handle low on a cup, fakes below the triangle, wicks under the range floor — running the stops of everyone positioned the textbook way, harvesting that liquidity. Then, with weak hands flushed and the fuel collected, it reverses and makes the real move in the original direction.
Traders who bought the clean textbook break get stopped out at the exact low tick, then watch the move go without them. Traders who understand the undercut wait for it, let it happen, and buy the reclaim — often getting a better price than the breakout buyers and a tighter stop.
The three-step sequence, in detail:
- Undercut (the sweep). Price violates the obvious level — dips below double-bottom support, wicks under the range low, undercuts the handle low, pokes below the triangle's lower line. Stops trigger; a cascade of forced selling hits. To everyone watching the textbook, it looks like the pattern just failed. This is the trap being sprung — and the entire mental reframe is this: *it's being sprung for you, not on you.* The sweep isn't the enemy; it's the setup.
- Retest / reclaim. Price snaps back above the level it just broke and holds above it. The undercut low — the lowest tick of the wick — becomes your reference point and your risk anchor. The failure to follow through on the downside is the signal: sellers had their best shot, got the stops, and still couldn't press lower. When maximum bearish effort produces no downside follow-through, the path of least resistance is up.
- Breakout (the real one). Now price drives through the pattern's actual trigger — the neckline, the rim, the range high, the flat top — on expanding volume, and this time the trapped shorts from the undercut (the ones who shorted the "breakdown") become forced buyers, adding fuel to the move as they cover.
Your entry is on step 2 confirmation (the reclaim holds) or on the step 3 break with the undercut low as your stop. Either way, your invalidation is below the undercut wick — the lowest point of the trap. That is a precise, defensible, structurally-meaningful stop, not an arbitrary percentage. And because it's tight relative to the measured-move target above, the R/R blows out in your favor. An undercut-retest cup and handle can hand you a 1:4 or 1:5 where the naked breakout offered 1:2 with a worse fill and a worse win rate. You improve the entry, the stop, and the probability simultaneously — a rare trifecta.
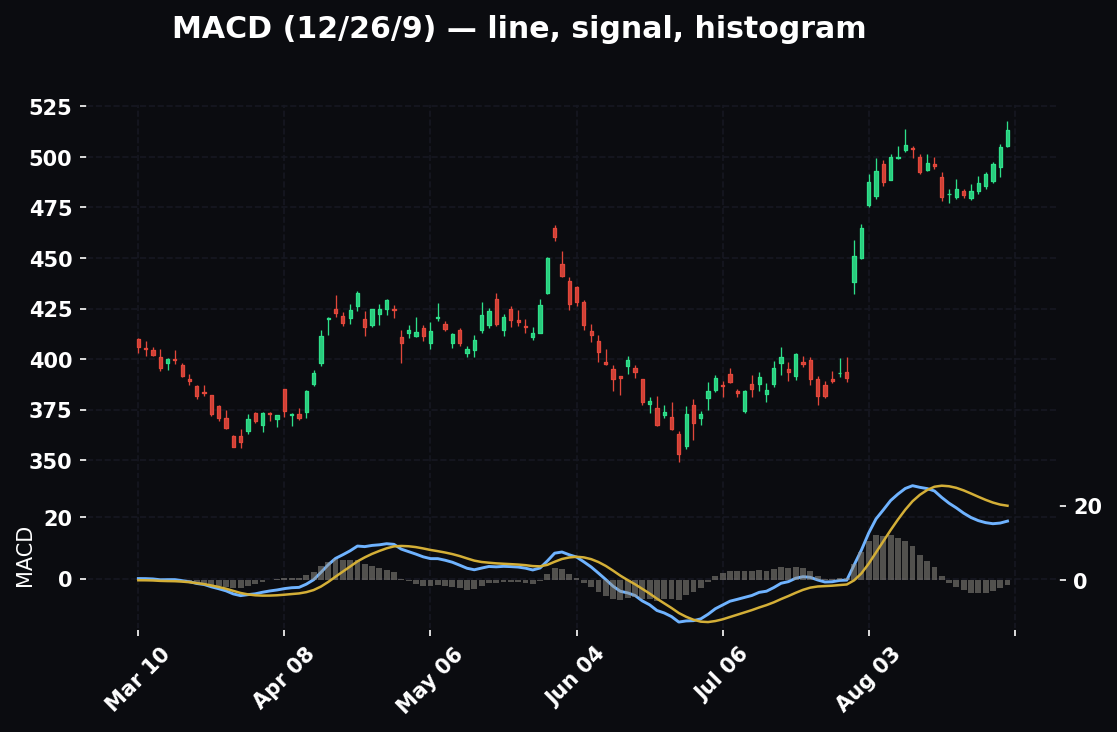
This is HPT's discipline-over-prediction ethos distilled into one setup: you don't predict the low, you don't front-run the level, you don't argue with the sweep. You let the market show you the trap has sprung and the sellers are spent, and then you take the confirmed entry with defined risk. You're not smarter than the market about where the bottom is — you're more patient than the traders who need to be right about it.
When the undercut doesn't come. Sometimes a pattern just breaks clean, no sweep, and runs. That's fine — you're allowed to take the standard break with a normal stop, sized down, if the higher-timeframe context is strong enough. The undercut entry is the preferred tool, not the only* tool. But when a big obvious level is sitting there un-swept, expect the sweep, and don't be shocked or shaken when it arrives.
How It Fits the Top-Down Process
A pattern is a trigger, not a thesis. This is the sentence to tattoo on your forearm. HPT's process runs macro → sector → stock, and patterns live at the very bottom of that funnel — they tell you when to act on a thesis that macro and sector already built. Here's the full stack, top to bottom.
1. Macro and sector first. Is the broad tape — the indexes, the instrument's benchmark — trending up or down? Is the sector leading or lagging its benchmark? A bull flag on a stock in a leading sector in an uptrending market is a with-the-wind trade — three tailwinds at your back. The identical bull flag in a broken-down sector during a market selloff is fighting three levels of gravity, and its expected value is negative even though the shape is perfect. Same shape, opposite expected value. The pattern is identical; the trade is not. Beginners see the shape and take the trade; pros see the shape and first ask what's behind it.
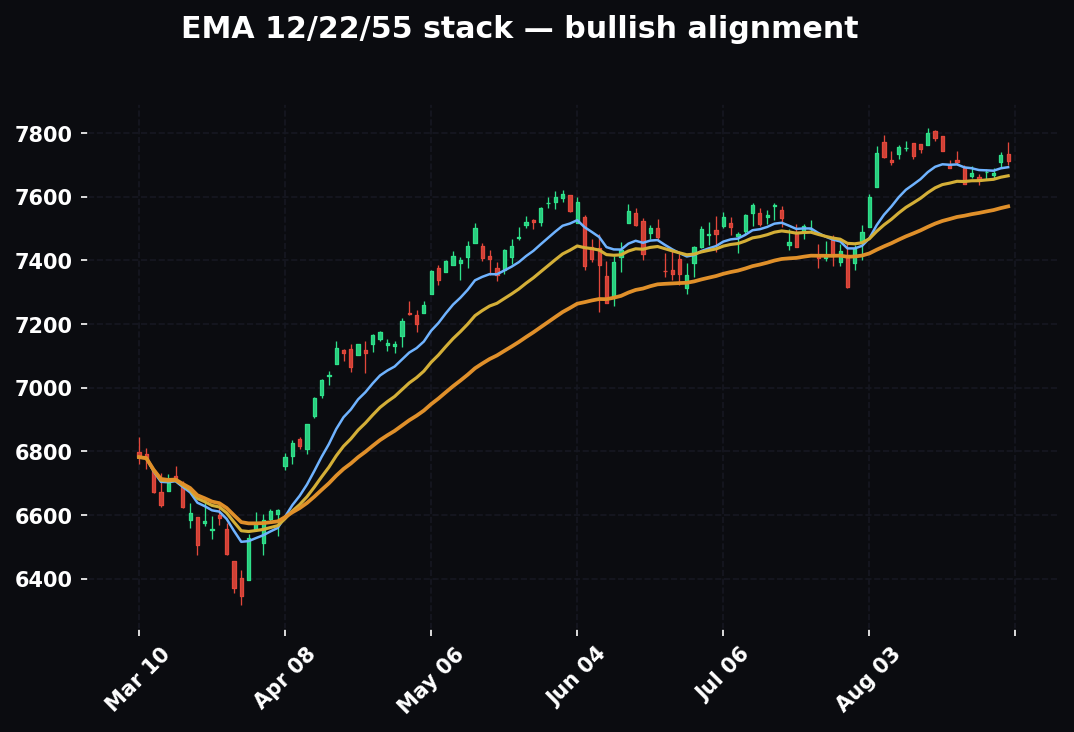
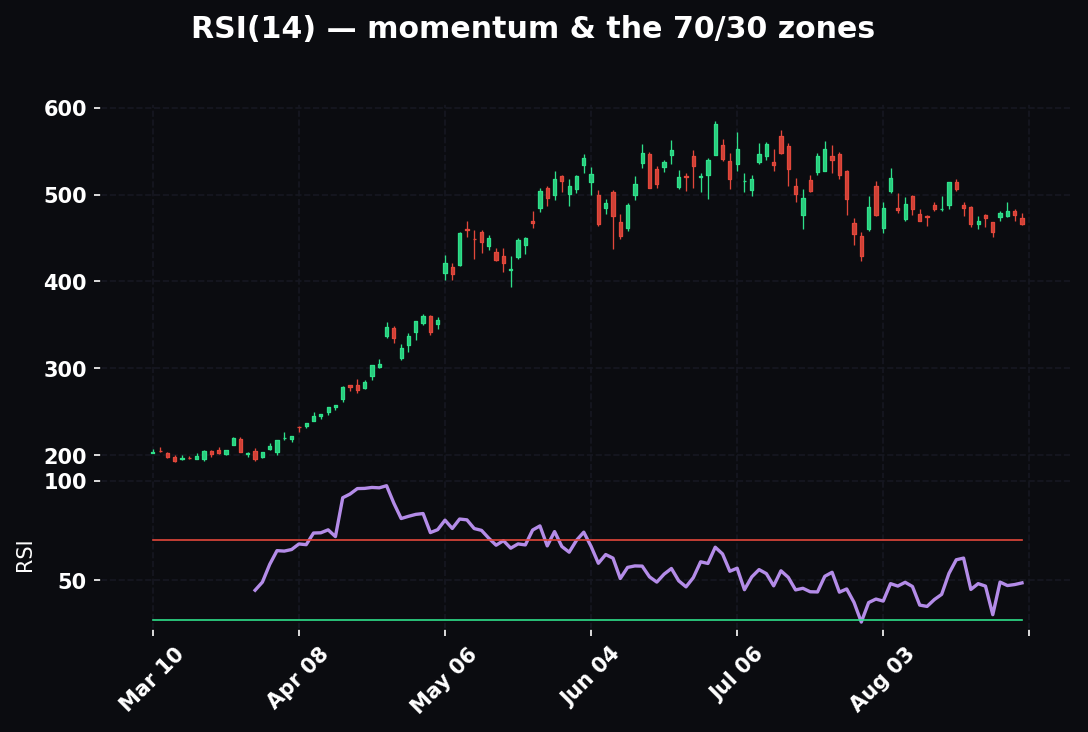
2. EMA 12/22/55 trend filter. Before you trade any pattern, check the EMAs — HPT uses 12/22/55, not the conventional 9/21. Stacked 12 over 22 over 55 and all rising = clean uptrend; take continuation longs (flags, ascending triangles, bull pennants, cup-and-handle) and be genuinely skeptical of reversal-short patterns. The daily 55 EMA is the bias tell — which side of it price is on frames everything you do on lower timeframes. A pattern against the EMA stack needs far more evidence to justify; a pattern with the stack is your default, your bread and butter. The "505 rejection" — a rejection off the 55 EMA — is itself a location where reversal patterns gain weight.
3. Timeframe-weighted confluence. The pattern on your entry timeframe should agree with the structure above it. A 15-minute ascending triangle that sits right underneath hard daily resistance is a far worse long than the identical triangle breaking into clean open air above. Weight the higher timeframe more, always. When the 1H, 4H, and daily all point the same direction and your entry-timeframe pattern triggers with them, that's an A+ setup and the one you size up on. When they conflict — say a bullish 15m flag under a bearish daily trend — you size down hard or stand aside. The higher timeframe is the tide; your pattern is the wave. Waves that run with the tide travel far; waves against it die on the sand.
4. Then, and only then, the pattern plus undercut sequence. With macro, sector, EMA, and multi-timeframe confluence all lined up, you finally drop to the entry timeframe, wait for the undercut-retest, and pull the trigger — stop below the trap, target at the measured move, sized to a minimum 1:3. Notice that the pattern was the last thing you looked at, not the first.
The pattern didn't make the trade good. The context made it good; the pattern just told you when. Reverse that order — pattern first, context as an afterthought — and you'll trade beautiful shapes into terrible outcomes for the rest of your career.
Patterns Across Market Regimes
The same pattern behaves differently depending on the market's regime, and failing to adjust for regime is one of the quiet reasons traders who "know their patterns" still lose. There are three regimes worth naming, and each rewrites the rules.
Trending Regime
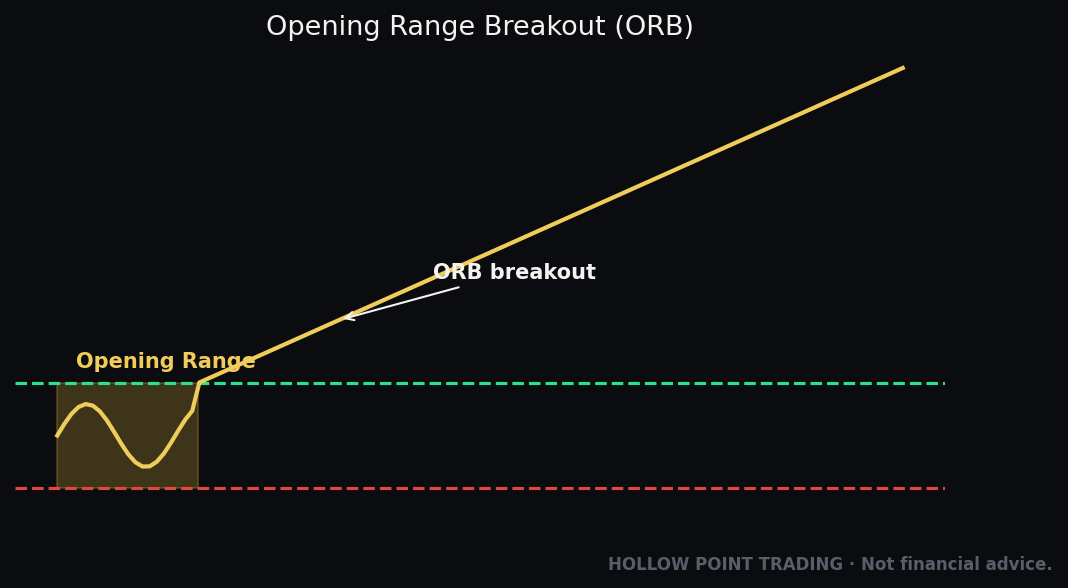
In a clean, established trend, continuation patterns are king and reversals are traps. Flags, pennants, ascending triangles (in uptrends), bull pennants, and cup-and-handles fire and follow through with their best base rates. Breakouts hold; retests are shallow and get bought fast; the undercut, when it comes, is a quick wick rather than a deep flush. Meanwhile, every reversal pattern is suspect — the market is littered with "double tops" in strong uptrends that were just pauses before higher highs. Rule for trending regimes: trade continuations aggressively in the trend direction, demand extraordinary evidence for any counter-trend reversal, and lean on the undercut entry because trends love to shake out before continuing.
Choppy / Ranging Regime
In chop — a sideways, directionless tape with no EMA stack, price crossing the 55 EMA repeatedly — breakouts fail more than they work. This is the mean-reversion regime. Patterns that project big directional moves (flags, triangles breaking to targets) mostly false-break and reverse. What does work is fading the range edges: buying support, selling resistance, taking quick profits into the middle. Rectangles are the defining pattern of this regime, and the winning move is often to trade the box, not the break. Rule for choppy regimes: distrust every breakout, fade the edges or sit out, cut targets short, and remember that the graveyard of the undisciplined is paved with people trading breakouts in a range. If you can't tell whether you're in a trend or a range, assume range and demand more.
High-Volatility Regime
In a high-vol tape — think a post-catalyst market, an event-driven spike, a VIX regime shift — everything is faster, wider, and noisier. Patterns still form, but the wicks are huge, the undercuts are violent and deep (not gentle probes), stops get run by a mile, and measured moves get overshot in both directions. The adjustment is mechanical: widen your stops and shrink your size so your dollar risk stays constant. A stop that would be 2 points in a calm tape might need to be 8 points in a high-vol tape, which means one-quarter the position size for the same risk. Patterns that rely on tight stops (flags, shallow handles) lose their R/R advantage here because you can't use a tight stop safely. Favor higher-timeframe patterns (which absorb the noise) and be extremely patient for the reclaim — high-vol undercuts look like the world is ending right before they reverse.
Multi-Timeframe Treatment
A pattern is never really "on the 15-minute chart" — it's on the 15-minute chart inside a 1-hour structure inside a daily structure. Reading it in isolation is like reading one sentence of a paragraph and guessing the plot. Here's how to layer timeframes deliberately.
Use three timeframes, in a fixed relationship. A clean, common stack is: daily for bias, 1H (or 4H) for structure, 15m (or 5m) for the entry trigger. The higher one sets which direction you're allowed to trade, the middle one identifies the level you're trading around, and the lowest one gives the pattern and entry. Roughly a 4x-to-6x ratio between each rung keeps them meaningfully distinct — daily to 1H is 24x, so many traders insert 4H between them.
The alignment test. Before taking any pattern, ask three questions in order. (1) Bias: which side of its 55 EMA is the daily on, and is the stack rising or falling? That's your permitted direction. (2) Location: on the middle timeframe, is your pattern forming at support/resistance that agrees with the bias — e.g., a bullish pattern at a higher-timeframe support in an uptrend — or is it forming into a wall? (3) Trigger: does the entry-timeframe pattern fire with the bias and location? Only when all three agree do you have the A+ setup. Two of three is a size-down. One of three is a pass.
Worked example. Daily is stacked up, price above a rising 55 EMA — bias long. On the 1H, price pulls back into a prior breakout level that lines up with the 1H 22 EMA — good long location. On the 15m, a falling wedge (bullish) forms at that 1H support and then undercuts its own lower line, sweeps the stops, and reclaims. That's all three: bias long, location support, trigger a bullish reclaim. That's the trade you back the truck up on. Change the daily to below its 55 EMA and the exact same 15m wedge becomes a counter-trend scalp at best — same shape, downgraded trade.
Nested patterns. Sometimes a small pattern on a low timeframe is part of a big pattern on a high timeframe — the 15m bull flag is the right side of the daily cup, or the 5m double bottom is the undercut-and-reclaim of the 1H range low. When the low-timeframe pattern is the entry mechanic for the high-timeframe pattern, you've found the highest-quality setups there are: precise entry, tight stop, huge structural target.
Combining Patterns With Other Tools (Confluence)
A pattern alone is a coin flip you've nudged. A pattern plus two or three independent confirmations is a genuine edge. The key word is independent — three tools that all measure the same thing (say, three momentum oscillators) aren't confluence, they're the same vote counted three times. Here are the highest-value pairings.
Patterns + Fibonacci / The Golden Pocket
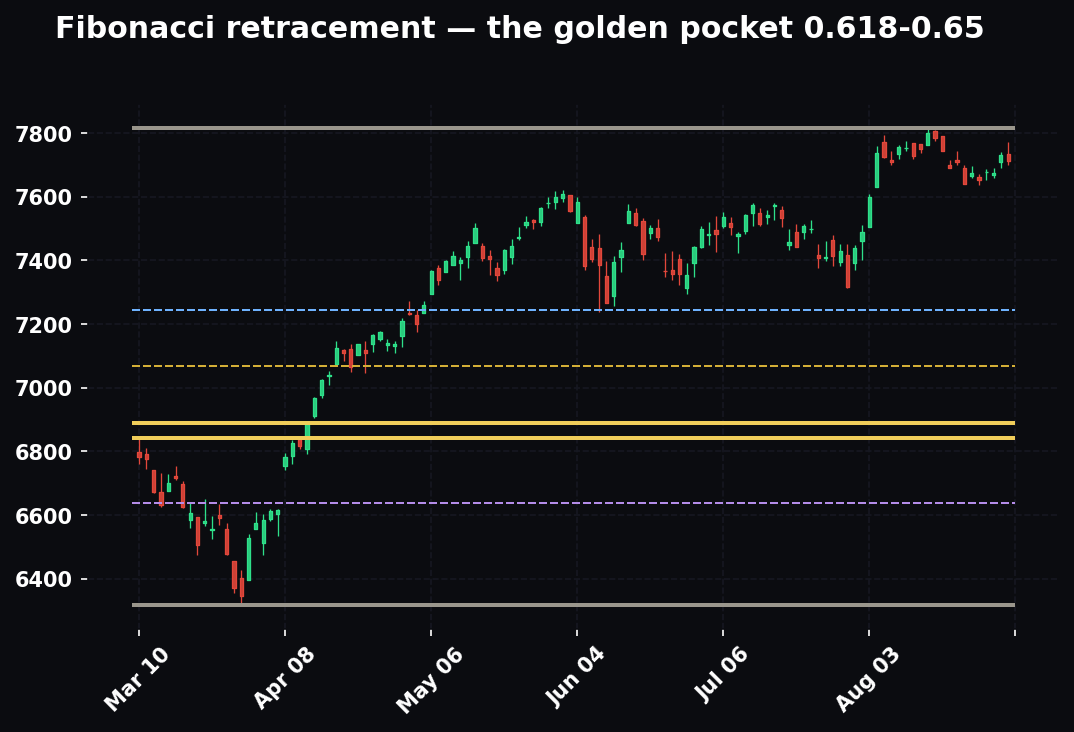
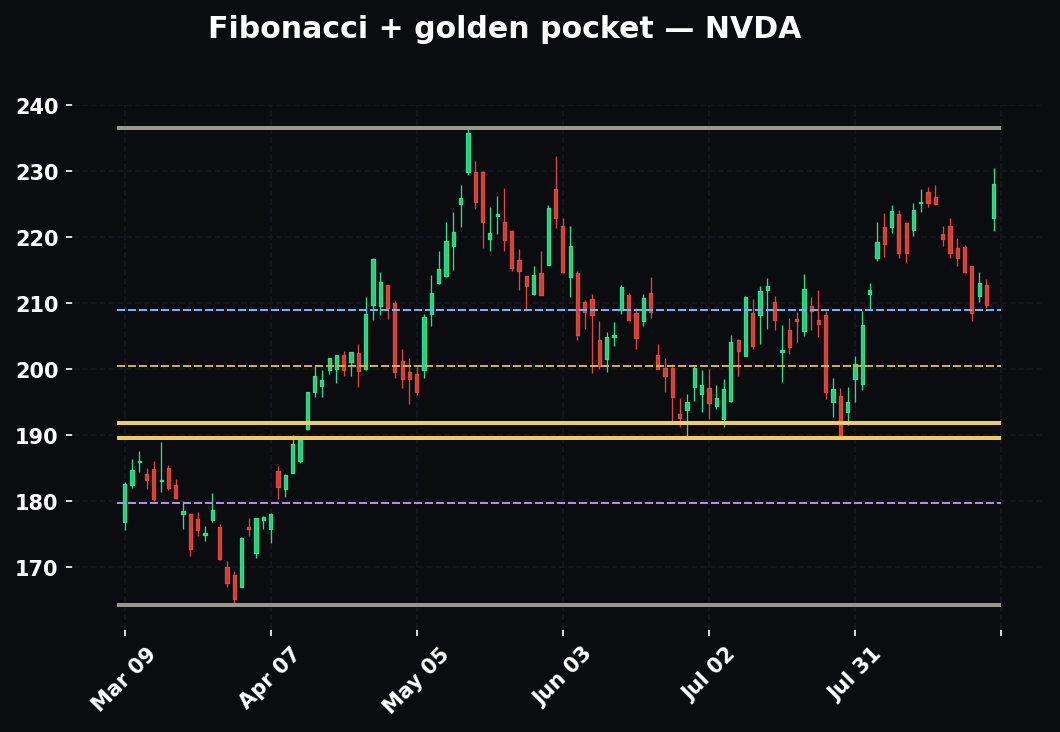
Pull a Fibonacci retracement over the impulse leg that preceded your pattern. The magic happens when the pattern forms at a key retracement — especially the golden pocket, the 0.618–0.65 zone. A bull flag whose low sits exactly in the golden pocket of the prior up-leg is a much higher-probability continuation than one that's pulled back a random amount, because two independent methods — pattern structure and Fibonacci — point to the same price. Even better: an undercut that sweeps just below the 0.65 and reclaims back into the pocket is a textbook trap-and-go. The Fib gives you a precise level to expect the pattern's low, which sharpens both your patience (you know where to wait) and your stop (just below the pocket).
Patterns + VWAP and Anchored VWAP
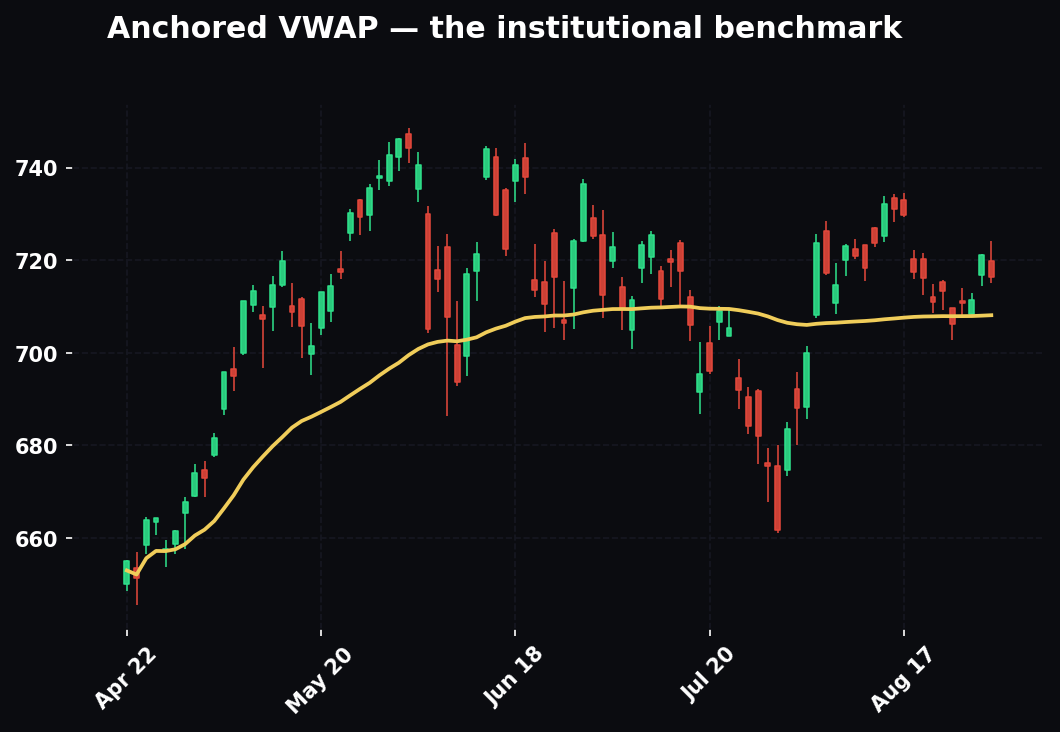
VWAP (and anchored VWAP dropped from a meaningful pivot — the swing low, the earnings gap, the range start) is where institutional size references its average price, so it's a magnet and a battleground. A continuation pattern that breaks out from above a rising VWAP, or a reversal that forms right at a VWAP rejection, gains a real vote. Intraday, a bull flag riding on the daily VWAP with an undercut that wicks to VWAP and reclaims is a premium setup — VWAP is the support the smart-money buyers are defending, and it hands you the exact stop reference. When your pattern's key level coincides with VWAP, weight it up.
Patterns + RSI / Momentum Divergence
The most useful oscillator confirmation for patterns is divergence. On a double top, if the second peak makes an equal or higher price high but RSI makes a lower high, that's bearish divergence confirming the exhaustion the pattern is drawing — momentum faded even as price held. On a double bottom or falling wedge into a low, a higher RSI low against an equal/lower price low is bullish divergence confirming the reversal. The divergence and the pattern are independent (one is price structure, one is momentum), so agreement between them is real confluence. A head-and-shoulders top with RSI diverging across the head and right shoulder is materially stronger than one without.
Stacking Them
The A+ trade is where several independent tools converge on one price and one direction: the pattern says long, the golden pocket sits at the pattern's low, VWAP is right there as support, RSI shows bullish divergence, the EMA stack is up, and the higher timeframe agrees. When five independent methods point at the same 20-cent zone, you're not guessing anymore — you're trading a confluence, and you can size accordingly. That confluence, not the shape, is the actual HPT edge.
How the Pros Use Patterns Differently From Beginners
The gap between a beginner and a professional using the "same" patterns is enormous, and almost none of it is about knowing more shapes. It's about how they relate to the shapes.
Beginners hunt for patterns; pros wait for them at levels. A beginner scans a hundred charts looking for anything that resembles a flag. A pro identifies the two or three key levels that matter today — the higher-timeframe support, the range edge, the prior day's high — and waits for a pattern to form there. The pro trades far fewer patterns and wins far more, because location is doing most of the work.
Beginners take the first break; pros expect the sweep. A beginner buys the exact breakout and gets stopped on the undercut. A pro sees the obvious level, anticipates that it'll be swept, and waits to buy the reclaim. Same pattern, opposite outcome, purely because of when they act.
Beginners see the shape; pros see the participants. A beginner thinks "double top, therefore short." A pro thinks "the longs who bought the second push are trapped, their stops are under the middle pivot, and when it breaks they'll fuel a cascade — that's why I'm short." One is pattern-matching; the other is reading order flow through the pattern.
Beginners trade every pattern the same; pros grade them. A pro has an A/B/C grade for every setup — A+ gets full size, B gets half, C gets passed — based on trend alignment, location, volume, and confluence. Beginners treat a perfect in-trend flag and a sloppy counter-trend flag as the same trade with the same size. Position sizing by conviction is most of the professional edge and none of the beginner's process.
Beginners predict; pros react. A beginner calls the top, front-runs the level, and argues with price. A pro states the invalidation before entry, lets the market confirm, and is emotionally fine being wrong because the risk was defined from the first click. The pro isn't trying to be right about the future — they're managing a series of defined-risk bets with positive expectancy.
Beginners obsess over entries; pros obsess over the trade lifecycle. Where to take partials, where to trail the stop to breakeven, when the thesis is invalidated even though the stop hasn't hit, when to add — pros spend most of their energy on managing the position after entry. Beginners fire and forget, then either panic out of winners or ride losers to the stop.
Beginners need the pattern to work; pros need their process to work. A pro knows any single pattern is close to a coin flip and doesn't care about the outcome of trade #47 — they care that across 100 trades, taken with 1:3+ R/R and disciplined selection, the math wins. Beginners get emotionally destroyed by three losing patterns in a row and abandon a perfectly good process. The professional's real edge is that they're playing a different game — a probabilistic one — while the beginner is trying to be a fortune-teller.
The Common Mistakes
1. Trading the shape before it confirms. A double top isn't a double top until the middle pivot breaks. A cup isn't tradeable until the handle high goes. Two highs is just two highs. Anticipating the pattern — entering "before it's obvious" to get a better price — is the single most expensive habit in this entire discipline, because you're guessing at an unconfirmed structure, and unconfirmed structures resolve against you at least half the time. Wait for the trigger. The better fill you chased is not worth the base-rate you surrendered.
2. Ignoring volume. A breakout with no volume expansion is the most common failure setup there is. Volume is the difference between "price left the level" and "price left the level with force behind it." If the volume signature is wrong — no dry-up in the flag, no surge on the break, heavy volume in the handle — the pattern is wrong, no matter how clean the lines look. Believe the volume over the shape every time.
3. Forcing lines onto noise. If you have to squint, tilt your head, ignore three wicks, and use a fat marker to see the pattern, it isn't there. The market does not owe you a setup on demand. The best patterns are obvious — they jump off the chart. HPT calls a weak pattern weak: no manufactured confluence, no drawing the picture you want to see. A forced pattern is a decision to lose money with extra steps.
4. Fighting the higher timeframe. A perfect 5-minute pattern against a hard daily trend is a low-expectancy trade, full stop. The higher timeframe is the tide and it wins. This is the mistake behind most "the pattern was textbook and it still failed" complaints — the pattern was fine; it was pointed the wrong way relative to the structure above it. Always weight the higher timeframe more, always check it first.
5. Naked breakout entries into obvious stops. Buying the exact break of the most-watched level on the chart is buying into the liquidity that the market's structure is hunting. The more obvious the breakout level, the more likely it gets swept first. Wait for the undercut and the reclaim. Your worst fills across a career will overwhelmingly be naked breakout entries at obvious levels; your best will be reclaims after the sweep.
6. No invalidation. If you can't state the exact price that proves you wrong before you enter, you don't have a trade — you have a hope with money attached. Every pattern in this guide has a defined, structural invalidation: below the right shoulder, below the handle low, below the undercut wick, back inside the range. Know it before you click. A trade without a pre-defined stop is a slow-motion account deletion.
7. Overtrading ranges. Rectangles and chop chew up more accounts than any trend ever will, because they generate constant fake signals in both directions and punish momentum entries relentlessly. Either fade the edges mechanically with a plan, or wait for the confirmed break — never flip-flop mid-range, chasing each poke. When you notice you're getting chopped, the answer is almost always fewer trades, not better shapes.
8. Moving the stop to avoid being wrong. You set the invalidation below the undercut wick, price approaches it, and you slide the stop lower "to give it room." That's not risk management, that's converting a small defined loss into a large undefined one. The moment you widen a stop mid-trade because price is threatening it, you've abandoned the entire framework. If the level breaks, you were wrong; take the small loss and re-set.
9. Wrong position size for the pattern's grade. Taking a sloppy counter-trend C-grade pattern with the same size as an A+ in-trend confluence setup is a mistake even when the C-grade happens to work — it worked despite the process, not because of it. Size by conviction: full size only when trend, location, volume, and confluence all align. Uniform sizing across unequal setups guarantees your losers cost as much as your winners make, which kills the math.
10. Marrying the measured move. The measured move is a first objective, not a promise and not a place to be greedy waiting for. Price reaching the measured move on fading momentum, into a higher-timeframe level, is a place to take risk off — not a place to add hoping for more. Equally, treating the measured move as a hard ceiling and exiting a screaming runner too early in a strong trend leaves the fat tail on the table. Use it as a decision point, informed by momentum and structure, not as a mechanical exit.
11. Assuming patterns are destiny. The honest truth threaded through this entire guide: most patterns, traded in isolation on live charts, fail or underperform their textbook statistics. The edge is not the shape. The edge is the shape plus higher-timeframe context plus volume confirmation plus the undercut entry plus disciplined, graded risk. Strip those away and you are trading pretty pictures against people who are trading order flow.
12. Revenge-trading a failed pattern. A clean pattern fails — it happens, base rates are base rates — and instead of accepting the defined loss you immediately flip and chase the opposite direction, or double the size on the next setup to "get it back." The failed pattern was probably a normal statistical loser; the revenge trade is a guaranteed emotional one. The process only works if you let it play out across many trades without letting any single outcome hijack the next decision.
FAQ
Do chart patterns even work anymore, with all the algorithms? Yes — but not as standalone signals, and arguably algorithms make the undercut dynamic stronger, not weaker. Algorithms are exquisitely good at hunting the obvious stops resting at pattern levels, which is exactly why naked breakouts fail more than they used to and why the sweep-and-reclaim works so well. The patterns didn't stop working; the naive way of trading them stopped working. The order flow underneath — trapped traders forced to act — is human psychology and mechanics, and that hasn't changed.
Which single pattern should a beginner master first? The bull flag (and its mirror, the bear flag). It's the purest expression of the whole concept — clear pole (conviction), clear rest (volume dry-up), clear break (resumption), tight stop, fat R/R — and it's the highest-base-rate setup when traded with the trend. Master the flag, master the trend filter that tells you when to take it, and you have a complete method before you ever touch a head-and-shoulders.
What timeframe should I trade patterns on? Whatever fits your life and temperament, but always with the higher-timeframe context above it. Swing traders live on the daily with a weekly bias and a 4H/1H entry. Day traders live on the 5m/15m with a daily bias and a 1H structure. The ratio matters more than the absolute timeframe — always have a bias timeframe roughly 4–6x higher than your entry timeframe. Lower timeframes have more noise and lower base rates; don't go below what you can actually watch and manage.
How do I tell a real breakout from a fake? Three checks, fast. (1) Did it close beyond the level, or just wick? Wicks are probes; closes are commitments. (2) Was there a volume surge on the break? No surge, distrust it. (3) Does it hold the retest — does price come back to kiss the broken level and defend it? A break that closes beyond, surges on volume, and holds the retest is real. A break that wicks through on light volume and immediately falls back inside is the sweep — wait for the reclaim in the other direction.
What's a realistic win rate trading patterns this way? Lower than beginners expect and it doesn't matter as much as they think. Traded with a strict 1:3+ R/R, you can be profitable at a sub-40% win rate — you lose small more than half the time and win big the rest. The whole point of the tight-undercut-stop-versus-measured-move-target geometry is to make the math work even with a modest hit rate. Chasing a high win rate usually means taking profits too early and cutting your R/R to shreds, which is how "70% win rate" traders still lose money.
Should I trade against the pattern if I think it'll fail? Only through the defined mechanism — i.e., a failed pattern is itself a tradeable setup (the failed head-and-shoulders that reclaims and continues, the failed breakout that traps and reverses), and you trade it with the same discipline: wait for confirmation of the failure, define invalidation, size by grade. What you don't do is predict the failure and front-run it. Let the failure confirm, then trade it like any other setup.
How many confirmations is enough before I pull the trigger? Enough that at least the trend filter and one independent tool agree with the pattern — that's the floor. More is better up to a point, but waiting for every box to check on every trade means you never trade the good-enough setups and you miss the fast ones. The practical answer: bias must agree (non-negotiable), plus location or an independent confirmation (Fib/VWAP/divergence). That's a B+ setup worth taking. All of them aligning is the A+ you size up.
Cheat-Sheet / Quick Reference
Pin this. Everything above, compressed to what you'll actually check in the seat.
Reversals
- Head & shoulders: 3 peaks, middle highest; volume lighter on the right shoulder; target = head-to-neckline height projected from the neckline break; invalidation above the right shoulder. Among the more reliable — when clean. Fear the reclaim-and-continue failure.
- Double / triple top-bottom (M / W): confirm ONLY on the middle-pivot break, never on the touch; second push on lighter volume; target = pattern height from the break. Watch for the undercut of the second low — often the strongest version.
- Rounding / saucer: slow curve, U-shaped volume, break of the rim; tops less reliable than bottoms; often becomes a cup & handle.
Continuations
- Flag / pennant: sharp pole → tight counter-drift on drying volume → surge break; target = full pole projected from break; flies "half-mast." Pole quality is the edge. Too long = it's a range now.
- Ascending triangle: flat top, rising lows → bullish. Descending: flat bottom, falling highs → bearish (but breaks up in strong uptrends — location beats shape). Symmetrical: coil → breaks with the prior trend, notorious for false first breaks. Volume contracts into apex, expands on break; avoid deep-apex (last 25–40%) breaks.
- Wedge: rising wedge → bearish; falling wedge → bullish (slopes with price, signals against it). Loose targets — use structure for exits.
- Rectangle / range: box between horizontals; fade the edges OR trade the break, NEVER both; target = box height. The graveyard of the undisciplined.
The trophy
- Cup & handle: rounded U cup + shallow high handle (upper third) → break of handle high; target = cup depth from break; keep the handle quiet and shallow; stop below the handle low. Pass on V-cups, deep handles, and weak tapes.
The HPT entry sequence
- Undercut → reclaim → breakout. Let price sweep the obvious level and run the stops, wait for the reclaim to hold, enter the confirmed break with your stop below the undercut wick. Tightest risk, best R/R, best win rate. Expect the sweep at every obvious level.
The process (do this in order, every time)
- Macro & sector — with the wind or against it?
- EMA 12/22/55 — stacked which way? Daily 55 = the bias tell.
- Higher timeframe outweighs lower — always. Bias → structure → trigger.
- Volume confirms or the pattern is void.
- Add independent confluence — golden pocket 0.618–0.65, VWAP, RSI divergence.
- State invalidation BEFORE entry. Grade the setup A/B/C and size accordingly.
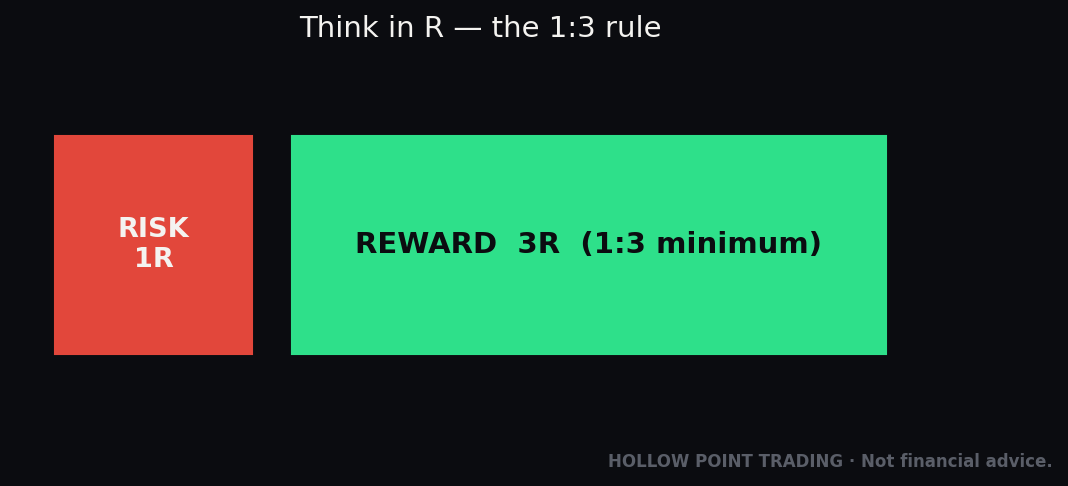
- Minimum 1:3 R/R, always. Manage the trade after entry — partials, breakeven, thesis-invalidation.
Regime adjustments
- Trend: continuations king, reversals suspect, aggressive with-trend.
- Chop: breakouts fail, fade the edges or sit out, cut targets.
- High-vol: widen stops, shrink size, favor higher timeframes, expect violent undercuts.
Rough reliability, honestly. Don't memorize failure percentages as gospel — live conditions swamp the textbook base rates. But directionally: clean head-and-shoulders and cup-and-handles in-trend are top-tier; flags off real poles and ascending/descending triangles with the trend are strong; symmetrical triangles and wedges false-break often; ranges are the graveyard of the undisciplined. In every single case, the undercut-retest entry and the top-down context matter more than the base rate of the shape. The shape is the least important variable in the equation — internalize that and you're already ahead of most of the people trading these.
Trade the story, not the shape. Read who's trapped. Wait for the trap to spring. Enter on confirmation with defined, graded risk, sized to the math. Manage the trade like a professional after you're in. That — not the picture in the textbook — is how patterns actually work.
Bound by rules, feared by trade.