
A candlestick is a corpse. By the time it closes, the battle is over and you're reading the autopsy. That's fine for structure and bias — but the actual decisions, the moment a big player decides to defend a level or bail on a position, happen inside the bar, in the stream of real transactions. Order flow and tape reading is the discipline of watching those transactions as they print, so you're reacting to what's happening now instead of narrating what already happened.
This is the most granular lens in the top-down stack. Macro tells you the weather. Sector tells you the neighborhood. The daily chart and the EMA 12/22/55 tell you the trend. The tape tells you whether, at this exact price, this exact second, buyers or sellers are winning the handshake. It's not a replacement for any of that. It's the trigger layer that sits underneath all of it — the thing that gets you a good fill on a level your higher-timeframe work already blessed.
Here is the trap you have to understand before you learn a single read: the tape is the only tool in trading that pays you more attention than it deserves. It never stops moving. There is always green, always red, always a print. A moving chart on a five-minute timeframe waits for you patiently between bars; the tape offers you a fresh decision every half-second. That firehose is exactly why it rewards screen time more than any other skill, and exactly why it seduces so many traders into overtrading noise as if it were signal. The whole art is learning to sit inside the firehose and stay dry until the one moment that actually matters.
We're going to build this from the ground up — the plumbing, the reads, dozens of worked examples with real numbers, how it behaves in trending versus choppy versus high-volatility markets, how it stacks with your other tools, how the pros use it differently from beginners, the mistakes that cost people accounts, and a full quick-reference at the end. Read it once to understand it, then keep it open next to a live DOM until the patterns become reflex.
The Concept: Auctions, Not Prices
Strip away the charts and a market is an ongoing auction. At every instant there is a best bid (the highest price a buyer is publicly willing to pay) and a best ask, also called the offer (the lowest price a seller is publicly willing to accept). The gap between them is the spread. In a liquid market like NQ futures or a large-cap stock, that spread is one tick wide and stable. In thin names or thin hours, it gaps.
Price doesn't "move" in the abstract. Price moves because someone crosses the spread — a buyer decides the ask is worth paying right now and lifts it, or a seller decides the bid is worth hitting right now and sells into it. Every single trade in the market is one of two things: a passive order that sat and waited (a resting limit order), and an aggressive order that came in and took it (a market order or a marketable limit).
That distinction is the entire foundation. Passive players provide liquidity and wait for price to come to them. Aggressive players demand liquidity and move price to get filled. When you read the tape, you are constantly asking one question: who is being aggressive, buyers or sellers, and are they winning?
Why the auction never rests
Think of a physical auction house. Bidders raise paddles; the auctioneer moves the price up until nobody will pay more, then it settles. A financial market is that, running continuously, in both directions, at machine speed. The reason price can hang at one level for a full minute and then rip four points in three seconds is that the auction is constantly testing: how much aggression does it take to move this? When the answer is "very little," price flies. When the answer is "an enormous amount, and it still won't budge," you are watching absorption — the single most important read in this entire discipline, which we'll build carefully below.
The two currencies: liquidity and urgency
Every participant is spending one of two things. Passive players spend liquidity — they post size and wait, hoping to get filled at a good price without moving the market. Aggressive players spend urgency — they pay the spread, accept a slightly worse price, and move the market because getting filled now matters more than getting filled cheap.
The whole edge of tape reading comes from the fact that urgency is expensive and finite. Nobody pays up forever. A fund covering a short has a fixed number of contracts to buy. An algo chasing a breakout has a budget. When you watch aggression pour into a level and price refuses to move, you are watching one side burn through a finite tank of urgency against an opponent who is simply posting liquidity and waiting. The moment the tank runs dry, price reverses — not because of magic, but because the aggressors are out of ammunition and the passive side is still standing there.
Intent leaks — and the leak is your edge
The genius and the curse of order flow is that intent leaks. A trader who needs to get long — a fund covering a short, a desk filling a client, an algo chasing a breakout — telegraphs urgency by paying up, by lifting offer after offer instead of patiently bidding. Urgency shows up in the transactions before it shows up in the candle. That leak is your edge. A five-minute chart will show you a green bar after the move is largely done; the tape shows you the first forty-lot lifting the offer while the bar is still forming. Everything below is a technique for detecting that leak earlier than the crowd, and — just as important — for refusing to act when the leak is fake.
The Mechanism: The Three Instruments
You read order flow through three tools. Learn what each physically shows you before you try to interpret anything, because ninety percent of bad tape reading comes from misunderstanding what a tool is even displaying.
1. Time & Sales — "The Tape"
The tape is the literal, chronological list of executed trades. It has been called "the tape" since stock prices printed on ticker tape in the 1800s, and the name stuck. Each print shows: price, size, time, and (usually by color) whether it hit the bid or lifted the ask.
That last part is the whole game. A trade printing at the ask — colored green in most platforms — means an aggressive buyer paid up. A trade at the bid — red — means an aggressive seller hit down. A fast scroll of green means buyers are demanding liquidity. A wall of red means sellers are. The tape is the only tool that shows you completed aggression: real money that actually changed hands, not orders that might vanish.
Two subtleties beginners miss. First, trades that print between the bid and ask (at the mid) are ambiguous — often a hidden order or a negotiated block — and most classification algorithms make a best guess. Don't over-read a single mid print. Second, size context is everything. A 50-lot means one thing in a market printing 1–3 lots and nothing at all in a market where 50s are the average. You have to calibrate your eye to the current baseline of the product and the current hour. The same absolute size is a scream at 12:15 in a dead lunch tape and a whisper at 9:31 in the opening rush.
2. The DOM / Level 2 — The Order Book
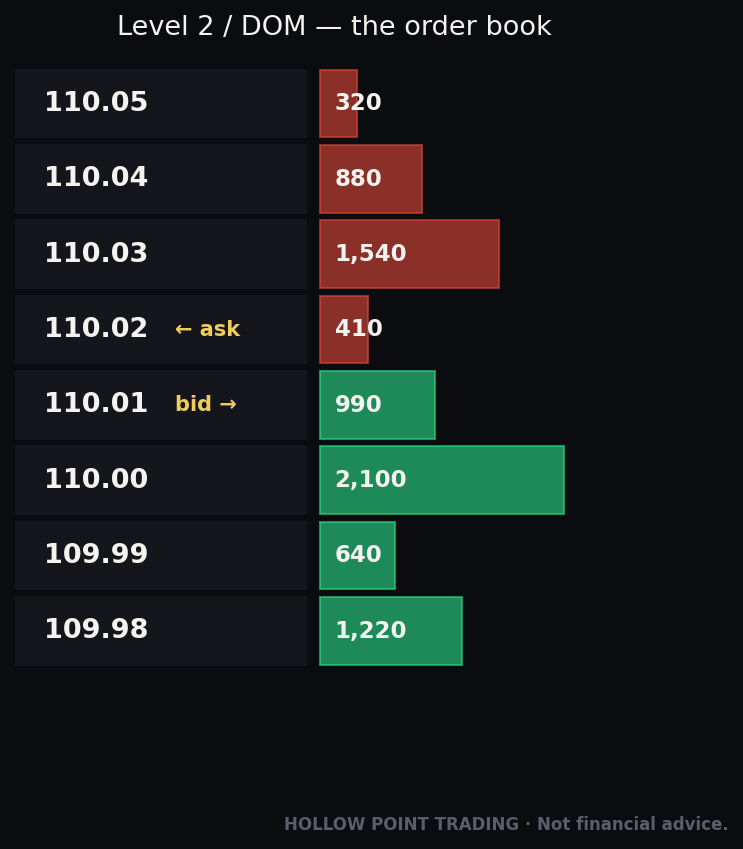
Level 1 quotes you only the best bid and best ask. Level 2 — the Depth of Market (DOM) — shows you the book: the stacked resting limit orders at each price above and below the current market. Bids stacked below, asks stacked above, with the size sitting at each level.
The DOM shows intent that hasn't executed yet. It's the supply and demand queued up waiting. A big number sitting on the bid three ticks down is a buyer saying "I'll defend here." A big number on the ask is a seller saying "you're not getting through me without a fight." The DOM is a map of where the walls are.
Reading the shape of the book
Beyond individual big orders, the shape of the book carries information. A book that is thick on both sides with evenly stacked size tells you the market is balanced and comfortable — expect chop and mean reversion. A book that thins out dramatically above the offer tells you there's a vacuum overhead: if a buyer gets aggressive, price can rip through empty air because there's little resting supply to slow it. Some of the fastest moves in NQ happen not because buying is enormous but because the offer side is empty — modest aggression into a thin book travels a long way. Learning to glance at the book and ask "is there anything up there to stop this?" is a real skill.
The book's fatal flaw
Critical caveat, and we'll hammer it again: the DOM shows displayed orders, and displayed orders can be canceled in microseconds. The book is the most easily faked of the three instruments. A number on the screen is a promise, and promises in this market are free to make and free to break. Treat the book as a hypothesis, and let the tape confirm or deny. The single most dangerous habit a new tape reader develops is falling in love with a big number on the DOM and trading it as if it were a wall of concrete, when it's really a hologram that vanishes the instant price walks up to it.
3. Delta & Footprint — The Aggregators
The tape scrolls too fast to count by eye in an active market. Delta solves that. Delta = (volume that traded at the ask) minus (volume that traded at the bid) over a period. Positive delta means aggressive buyers dominated that period; negative means aggressive sellers did.
Cumulative delta (CVD) sums this running total across the session, giving you a line you can chart against price. It's the single most useful order-flow aggregate because divergence between price and cumulative delta is one of the highest-quality signals in tape reading — more on that shortly. Think of CVD as the running scoreboard of the aggression war: it doesn't tell you the price, it tells you which side has been spending urgency all session.
Footprint charts (also called cluster or numbers-bars charts) take it further: instead of a hollow candle, each bar shows the bid volume × ask volume traded at every individual price level inside that bar. You see exactly where the aggression concentrated within the bar — where buyers stepped up, where sellers capped it, where a level absorbed a flood of orders and didn't move.
Reading a footprint bar
Take a single footprint bar. Down the left of each price row is the volume that traded at the bid (aggressive selling); down the right is the volume that traded at the ask (aggressive buying). A healthy up bar shows buying (the right numbers) building as price rises and the bar closing near its high — demand carried it. A suspicious up bar shows heavy buying at the top of the bar with price stalling there — buyers got aggressive into a ceiling and stopped going anywhere, the seed of a reversal. The footprint's superpower is that it locates aggression by price inside the bar, so you can see the exact tick where a fight was won or lost, something a normal candle throws away entirely.
A term you'll hear: unfinished auction or "unfinished business." When a bar closes with volume still printing on both bid and ask at the extreme price (rather than tapering to a single-sided print), the auction didn't fully resolve there and price often returns to that level to finish it. It's a footprint-native way of anticipating magnets.
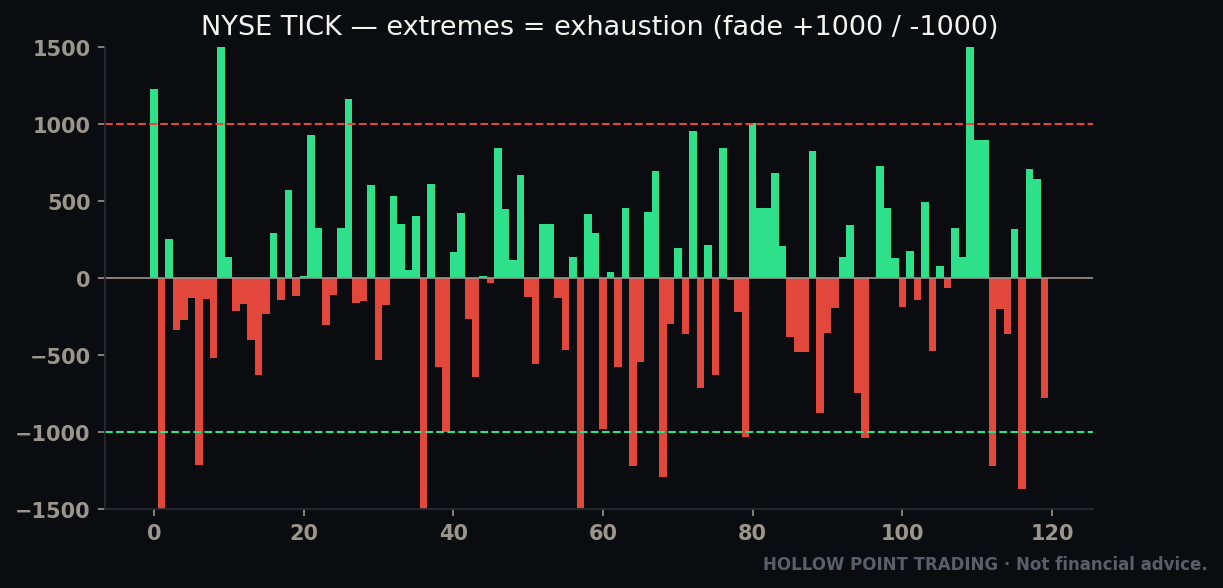
Together: the tape is the ground truth of what executed, the DOM is the map of resting intent, and delta/footprint are the instruments that make the firehose readable. You'll use all three, weighted differently depending on the market and your timeframe. The hierarchy of trust, which you should tattoo on your brain, is executed beats displayed — footprint and tape (real trades) over the book (promises) — every single time they disagree.
How to Read It: The Core Reads With Worked Examples
Here's where plumbing becomes skill. These are the recurring patterns. Each one is a specific answer to "who's winning and are they for real?" We'll walk each one with concrete numbers.
Absorption — the master read
Absorption is the single most important concept in tape reading. It happens when aggressive orders slam into a price and price refuses to move. A passive player is soaking up everything the aggressors throw — absorbing the selling with resting bids, or absorbing the buying with resting offers.
Picture NQ grinding down into a level your daily work flagged as support at 20,150. On the tape you see red, red, red — aggressive sellers hitting the bid, size going through. Normally that many contracts at the bid drops price several ticks. But it isn't dropping. The bid keeps refreshing. On the footprint, you see heavy sell volume stacking at one price with almost no downward progress. On cumulative delta, delta is making new lows but price is flat.
That is a large passive buyer absorbing the entire retail sell flood. Sellers are spending all their ammunition and getting nothing for it. When the sellers exhaust — and they will, because aggression is finite — there's no one left to sell, and price snaps up off the absorbed level. Absorption at a level you already respect is one of the cleanest long triggers that exists. The mirror image — aggressive buyers lifting offers into a ceiling that won't break, delta ripping up while price stalls — is your short.
Worked example: absorption with real numbers
Let's make it concrete. NQ is sitting at 20,148, one tick above your daily support at 20,147. Over ninety seconds you count the tape:
- A 40-lot hits the bid at 20,148. Price ticks to 20,147.
- 60 more lots hit the bid at 20,147. Price stays 20,147.
- Another 55 hit the bid at 20,147. Still 20,147.
- 30 more at 20,147. Still there.
That's roughly 185 contracts of aggressive selling absorbed at one price with a single tick of downward progress. Look at the footprint: the 20,147 row shows something like 185 on the bid side and price simply parked there. Look at CVD: it's dropped another 180-odd on the session, a fresh low. But price? One tick. Someone posted a bid at 20,147, ate 185 lots of panic, and didn't blink. Sellers just spent their urgency and bought themselves one tick. That's the tank running dry in real time. The moment the red prints slow and the first green 20-lot lifts 20,148, the read is confirmed and the trigger is live.
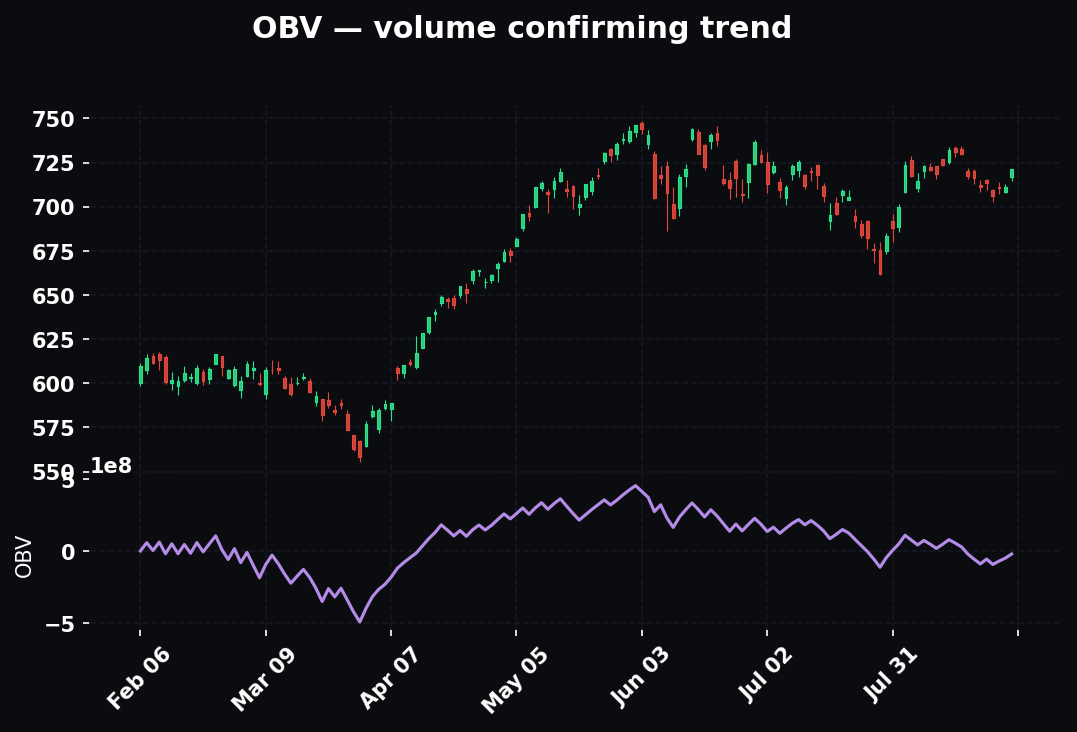
The key discipline: absorption only means something at a level that matters. Absorption in the middle of nowhere is just two algorithms trading with each other and tells you nothing about direction. This is exactly why tape reading is the bottom of the top-down stack and not the top — the higher-timeframe level gives the absorption its meaning. Absorption at 20,147 daily support is a trade. The identical absorption at 20,163 in the middle of the range is noise you skip.
Absorption versus a stop run — don't confuse them
A dangerous look-alike: a level absorbing selling looks a lot like a level about to break right before it breaks. The tell is in the follow-through. Real absorption shows aggression and no price progress followed by a reversal. A stop run shows aggression, a brief pause as resting orders get eaten, and then price accelerates through — the resting bids weren't a defending giant, they were just the last liquidity before a cliff. The way you avoid getting run over is the invalidation level: if price trades cleanly through the absorbed price and keeps going, absorption failed, and you're out immediately. You don't need to predict which one it is in advance; you need a stop that's wrong fast and cheap.
Cumulative Delta Divergence
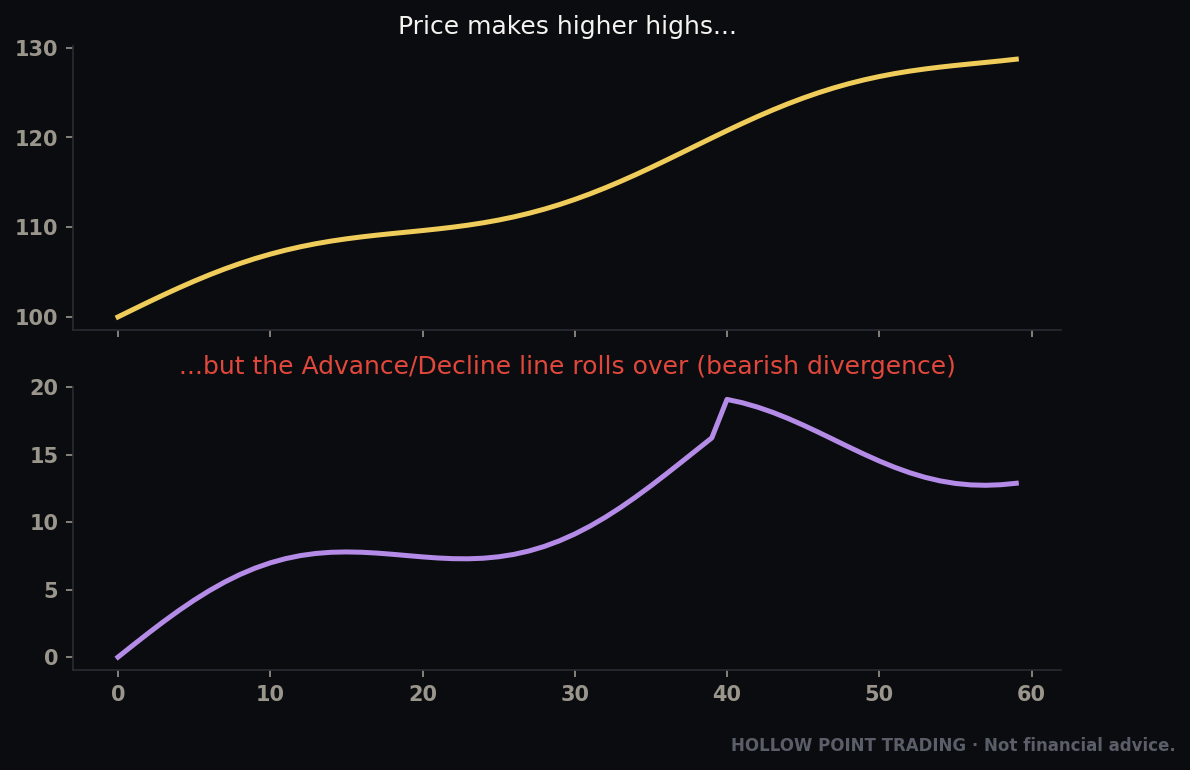
You already have the setup from above, but stated as its own tool: when price makes a new low but cumulative delta makes a higher low (or fails to confirm), the down-move is running out of aggressive sellers even though price ticked lower. The selling that pushed the new low was weaker than the selling on the prior low. That's a bullish divergence — the fuel is gone.
Worked example: price prints a fresh session low at 20,140. But the CVD line, which bottomed at −4,500 on the prior low at 20,145, only reaches −3,200 on this new low. Fewer aggressive sellers, yet a lower price — meaning passive buyers did the heavy lifting and the sellers are spent. Pair that with an absorption read on the footprint and a higher-timeframe support level, and you have three independent tools agreeing. That's timeframe-weighted confluence expressed at the microstructure level.
The other kind of divergence: effort versus result
There's a subtler cousin worth naming. Sometimes CVD rips hard positive — huge aggressive buying — and price barely moves up. That's not a bullish confirmation; it's a warning. Massive effort, tiny result, means every one of those aggressive buyers is being sold to by a passive giant. It's absorption showing up in the delta as an effort/result mismatch. The rule generalizes: whenever the aggression (delta) is large and the price result is small, the passive side is winning, and price tends to go the opposite way to the aggression. Big red delta with no downside = buyers absorbing = bullish. Big green delta with no upside = sellers absorbing = bearish. This one idea, effort versus result, is half of tape reading.
A caution on delta
CVD is powerful but it is not gospel, and in some markets it lies. In pure order-book futures like NQ and ES the tick-rule classification is fairly clean. In some venues and in fragmented equity markets, delta can be distorted by hidden orders and off-exchange prints, so a divergence that looks beautiful is partly an artifact of bad classification. Treat delta as strong evidence, not proof, and always want a price-based confirmation — the actual reversal, the actual reclaim — before you commit. Delta divergence tells you the fuel is low; the price turn tells you the car actually stopped.
Aggressive Initiative vs. Passive Response
Every move is either initiative or responsive. Initiative activity is aggressors starting something — buyers lifting offers to push into new territory, driving a breakout. Responsive activity is aggressors defending — buyers stepping in only because price got cheap at a level.
You read the difference in where the aggression happens relative to structure. Aggressive buying that appears at support and shoves price back up into the range = responsive, mean-reverting, fade-the-edge behavior. Aggressive buying that appears at resistance and punches through it = initiative, trend-continuation, breakout behavior. Same green prints, opposite meaning, decided entirely by location. Knowing which one you're watching tells you whether to fade or follow.
Worked example: the same prints, two trades
Monday, 10:15. NQ trades up to prior-day high at 20,300. The tape lights green, 30s and 40s lifting offers. If those green prints appear at 20,300 and price stalls and rolls back into the range, that was responsive buying that got trapped at resistance — a fade short back toward the middle. But if those identical green prints punch 20,300 and print 20,302, 20,305, 20,308 with the offer stack getting eaten and thinning above, that's initiative — buyers taking new territory — and you follow the breakout with stops back under 20,300. The prints are the same color and size. The location and the follow-through decide whether they mean fade or follow. Reading them backward is how you get run over, and it happens to beginners constantly.
Large Players Stepping In
You're hunting for the elephant in a market of minnows. The tells:
- Size prints on the tape that dwarf the average. If NQ has been printing 1–3 lots and suddenly a cluster of 40, 60, 90-lots crosses at one price, someone institutional just made a decision. Watch which side of the spread they hit.
- A large resting order on the DOM that keeps refreshing. When a 200-lot bid gets partially eaten and instantly refills to 200 again and again, that's an iceberg — a big player showing only a fraction of true size, refreshing the display so the market doesn't see the wall. Icebergs are a massive tell because they reveal a player big enough to hide, willing to defend. Retail can't iceberg. When you see one, an institution is in the seat.
- Speed. Genuine institutional urgency looks like a burst — the tape suddenly accelerates, prints get bigger, the spread gets crossed repeatedly in one direction in under a second. Deliberate money moves fast when it moves.
Iceberg versus spoof — the crucial difference
New readers confuse icebergs and spoofs because both involve big displayed size. They are opposites. An iceberg shows small and hides big — you see a 200-lot but there's 2,000 behind it, and you only learn it's an iceberg because it keeps absorbing and refilling, i.e., real trades happen against it. A spoof shows big and hides nothing — you see a 500-lot but there's zero intent behind it, and you learn it's a spoof because it vanishes without a single trade against it the moment price approaches. The distinguishing question is simple: is it absorbing executed volume, or is it just sitting there and then disappearing? Icebergs eat trades. Spoofs eat nothing and run. The footprint settles the argument, because it only records what actually executed.
Spoofing and Pulled Orders: The Book Lies
Now the dark side, because if you trust the DOM naively it will rob you.
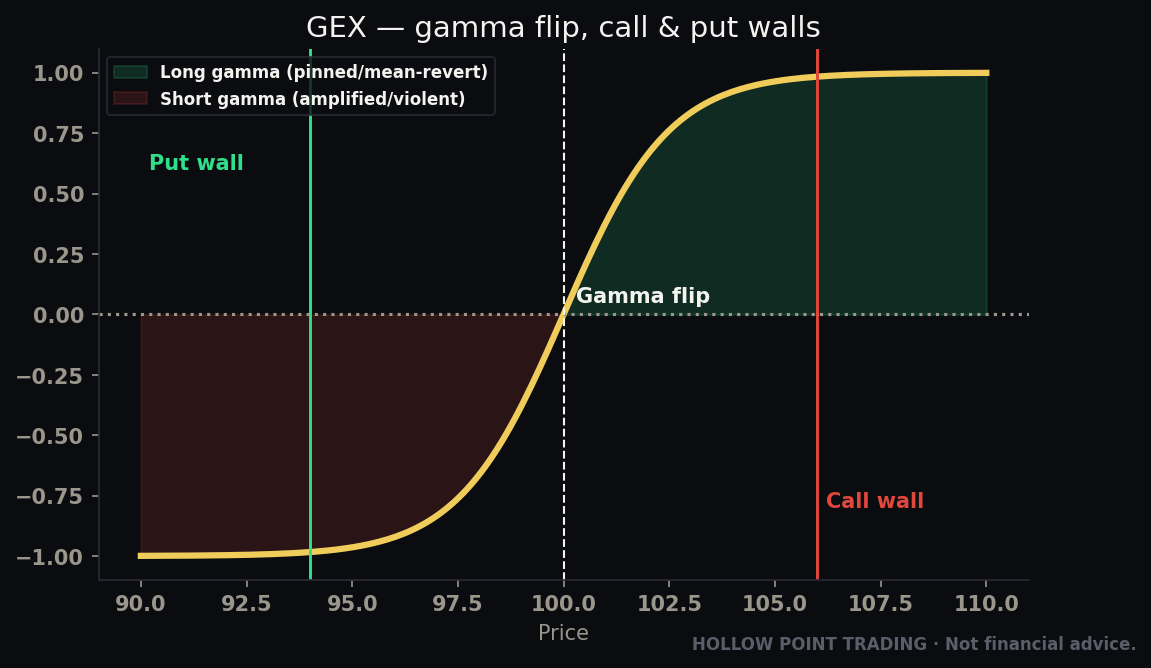
Spoofing is placing large displayed orders you never intend to execute, to create a false impression of supply or demand, then canceling them before they fill. A spoofer stacks a huge fake bid to make the book look supported, baits real buyers into chasing, then pulls the bid and sells into the demand he manufactured. It's illegal in regulated markets — Dodd-Frank explicitly outlawed it and the CFTC and DOJ have won cases with nine-figure penalties, including the 2020 JPMorgan settlement over spoofing metals markets — but it still happens, especially from fast algorithms that can place and cancel faster than you can blink.
Pulled orders (or "pulling") is the softer cousin — traders legitimately canceling resting orders as conditions change. Not illegal, just reality: the book is a statement of current intent, and intent evaporates. A market maker who posted a 300-lot bid when the tape was calm has every right to yank it when the tape turns violent. No manipulation, just risk management. But the effect on you is identical: the wall you were leaning on is gone.
How you protect yourself
The rule: the tape is truth, the book is a claim. A displayed order means nothing until it trades. Watch what actually executes. If a giant bid is sitting there but price approaches and the bid vanishes without absorbing a single contract, it was never real support — it was a fake, and now you know a manipulator wants price lower. Ironically, watching a spoof get pulled is itself a signal. When a wall you were counting on disappears the instant price tests it, get out of the way; the path just opened in that direction. Real absorption shows up as executed volume on the footprint with no price movement — that can't be faked, because the trades genuinely happened.
A worked spoof sequence
NQ is at 20,200. A 600-lot bid appears at 20,195, five ticks below. It's the biggest thing on the book by far, and the amateur reaction is "big support, get long." Watch instead. Price drifts down to 20,197, 20,196. As the market approaches 20,195, the 600-lot shrinks to 400, then 150, then vanishes — and not one contract traded against it. It never absorbed anything; it evaporated on approach. That was a lure. The real intent was to make you buy at 20,198 so someone could sell to you, and now that the bid is gone there's a hole beneath the market. Price trades 20,195, 20,192, 20,188. The trader who "bought the big bid" is underwater; the trader who watched it get pulled and stepped aside — or flipped short — got paid. The lesson isn't "spoofs are scary." It's "a resting order you never saw trade is not information you can lean on."
The rule that keeps you alive: never trade off a resting order alone. Trade off resting orders that the tape confirms are actually absorbing.
The Full-Session Read: Stitching It Together
Here's a worked sequence of a single morning to show the tools working as a system.
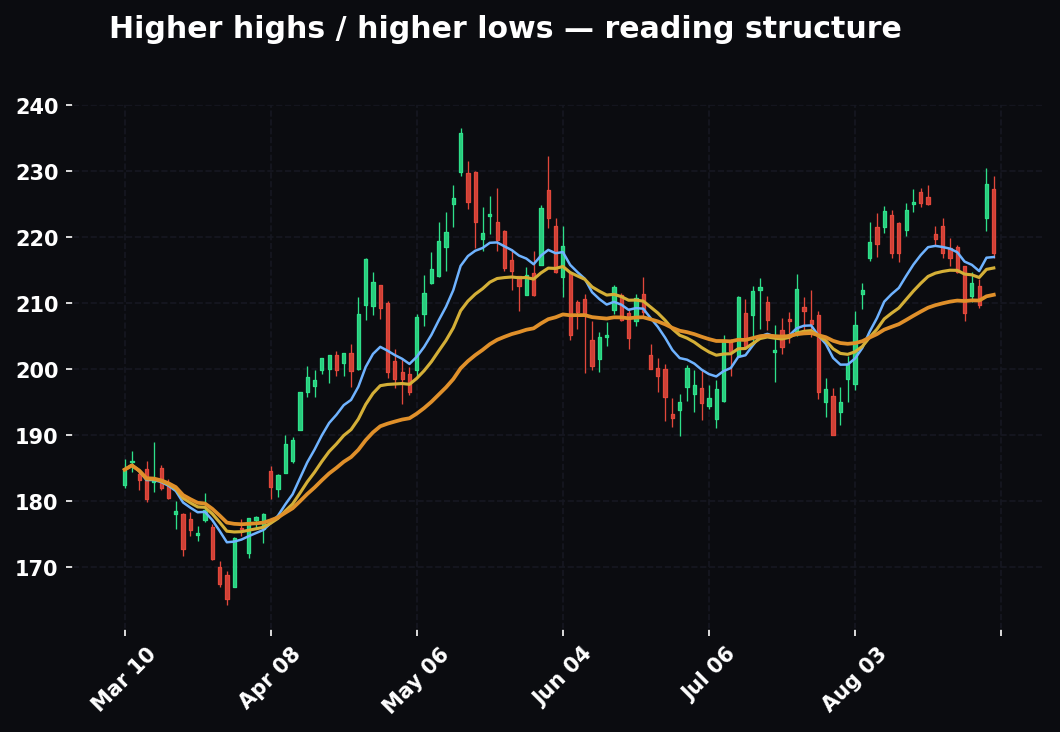
Pre-market, your top-down work has NQ bullish on the daily — price above the EMA 12/22/55 stack, trend up. Overnight it sold off into a daily support shelf at 20,150. Your bias: look for longs at support, don't short into an uptrend.
9:30. Cash open. The tape lights up red — aggressive sellers flushing into the open, price driving down toward 20,150. You do nothing. Falling into support with sellers aggressive is expected; you want to see the response, not catch the knife. This is the discipline moment most traders fail: the red is loud, it feels like you should short, and shorting into your own support level in an uptrend is exactly the trade that gets faded.
9:34. Price hits 20,148. The red prints keep coming — big size, 30s and 50s hitting the bid — but price stalls. It ticks 20,146, 20,148, 20,147. The footprint shows a fat stack of sell volume at 20,147 with no downward follow-through. Cumulative delta is making a new low; price is not. Absorption plus delta divergence at a daily level. Three tools agree.
9:36. A 120-lot bid appears at 20,146 and refreshes twice after being partially hit — an iceberg defending. The last aggressive sellers hit it and get nothing. The tape flickers green. First aggressive buyer lifts the offer at 20,150.
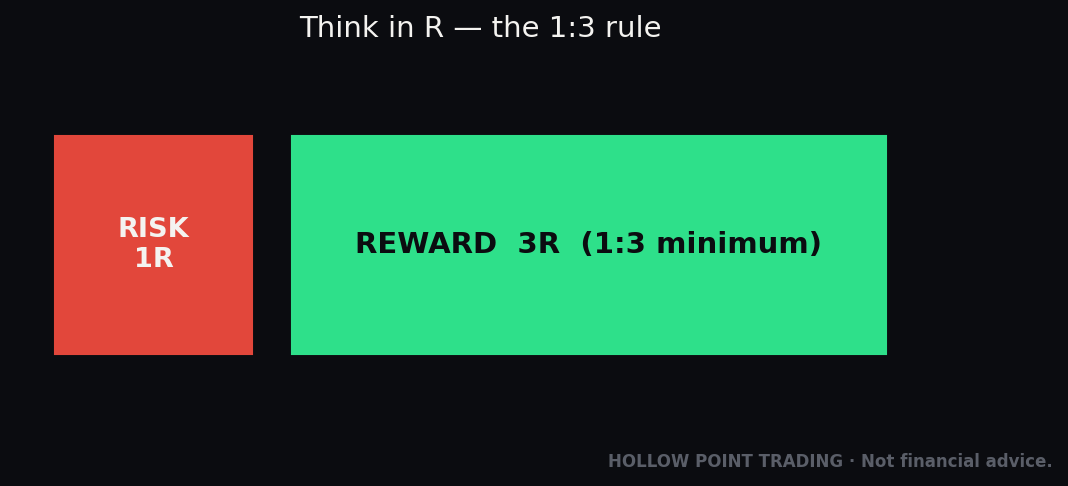
Entry: you go long at 20,152 as buyers take initiative off the absorbed level. Stop: below the absorption and the iceberg, 20,140 — if price trades through the level that absorbed all that selling, your read is simply wrong and you're out. That's an 8–12 tick risk. Target: the top of the overnight range at 20,240, with a runner toward the prior day high. That's roughly 1:3+ R/R — non-negotiable in the HPT framework. The tape gave you a precise, low-risk trigger on a level your higher timeframe already blessed.
Exit management. As price runs toward 20,240, you watch the tape for the opposite read to time your exit: green prints getting larger into the level while price slows is buyers getting aggressive and going nowhere — absorption against you, sellers stepping in up high. When you see delta stall and offers start absorbing, you take the money. The same skill that got you in gets you out, mirrored. You don't need price to hit your exact target; you need to read the tape telling you the buyers who carried you up are now the ones being absorbed.
That's the whole discipline in one trade: higher timeframe sets the where, the tape sets the when, and the R/R math sets the whether. Notice how many times in that sequence the correct action was nothing. From 9:30 to 9:34 you sat through the scariest part doing nothing but reading. That ratio — mostly watching, rarely acting — is what the job actually looks like.
Order Flow Across Market Regimes
The reads above are universal, but their reliability changes enormously with the regime. A tape reader who uses the identical playbook in a runaway trend and a dead midday range will get chopped to pieces. Adapt to what the market is.
Trending markets
In a strong trend, the dominant read is continuation, not reversal. Pullbacks against the trend are shallow, and the highest-odds trigger is absorption with the trend: in an uptrend, watch for sellers getting aggressive on a pullback into a rising level and getting absorbed by buyers, then follow the resumption. Counter-trend absorption still occurs, but it produces weaker, shorter reversals — a scalp, not a swing. Delta tends to confirm in a trend: CVD rises with price on the way up. The mistake here is fading a trend because you saw one absorption read against it; in a strong trend, against-trend signals are lower-quality and you size them down hard or skip them.
A trend-specific tell: pullbacks on declining delta that hold. In a healthy uptrend, pullbacks should come on lighter aggressive selling (delta dips modestly) and then buyers reload. When you see a pullback that holds structure while delta barely goes negative, the trend is intact and the next push is likely. When a pullback suddenly comes on heavy aggressive selling that keeps going, the trend may be ending — the character of the pullbacks is your early warning.
Range and chop
In a balanced range, the dominant read flips to reversion. Absorption at the range edges is gold: sellers get absorbed at range support, buyers get absorbed at range resistance, and price rotates back to the middle. This is the environment where fading works and initiative breakouts mostly fail (until the one that doesn't). Delta divergences at the range extremes are high-quality because the whole market is set up to reject the edges. The mistake in a range is treating every poke above the high as a breakout; most are stop runs that get absorbed and reversed. In chop, weight the book less and the footprint more, because balanced markets are where spoofing and false walls do the most damage.
The single hardest judgment in tape reading is when a range is about to stop being a range. The tell is a shift in the absorption: for days the edges have absorbed and reversed, and then one time the aggression into the edge doesn't get absorbed — it eats through, the offer stack thins, initiative appears, delta expands and confirms. That failure of absorption at a level that has held repeatedly is the birth of a trend. Respect it; the trader who keeps fading the edge because "it always holds" gets destroyed on the breakout.
High-volatility and news
When volatility explodes — a CPI print, an FOMC statement, a headline — the microstructure changes character entirely. Spreads widen, the book thins to nothing, size prints become erratic, and the book becomes almost useless because liquidity providers pull everything to avoid getting run over. In these moments, delta and tape can whipsaw so violently that normal reads generate false signal after false signal. The professional response is usually to stand down through the initial impulse and only re-engage once the tape re-establishes a readable rhythm — spreads tighten back to a tick, size normalizes, and absorption at a level becomes legible again. Trying to read absorption in the first ten seconds after a Fed statement is like trying to read lips in a hurricane. The edge in high-vol isn't faster reading; it's the patience to wait for the market to become readable again, then take the cleaner second move.
Multi-Timeframe Order Flow
Order flow is not a single timeframe. Delta and footprint exist on every bar interval, and reading them across timeframes is how you avoid getting faked out by micro-noise.
Think in three layers. Session/higher-timeframe delta (the full CVD line for the day, or delta on 15m footprint bars) tells you the dominant aggression regime — who has controlled the session. Execution-timeframe delta (1m–5m footprint) is where you find your setup — absorption, divergence, initiative at your level. The raw tape (tick by tick) is your trigger — the exact prints that confirm entry.
The power comes from alignment across the layers. A 1-minute absorption read that agrees with the session CVD regime is far stronger than one that fights it. If session delta shows buyers in control all day and you get a 1m absorption long at support, that's aligned — high odds. If session delta shows sellers grinding all day and you get the same 1m absorption long, you're fighting the dominant flow — lower odds, tighter management, take profit fast. The micro read is the trigger; the higher-timeframe flow is the permission. When they disagree, trust the higher timeframe for direction and the lower timeframe only for timing.
A concrete multi-timeframe stack for an NQ long: daily trend up (EMA 12/22/55 stacked), 15m footprint showing session CVD positive and rising, price pulled back to a 1H support level, 1m footprint showing absorption of sellers at that level, and the tape ticking green with the first initiative buyer. That's five timeframes of order flow and price agreeing at one price. That is the roar, and it's what you wait for.
Confluence: Order Flow With Your Other Tools
Order flow is a trigger layer, and a trigger is only as good as the thesis it confirms. Here is how it stacks with the tools you already run.
With EMAs (12/22/55) and the golden pocket
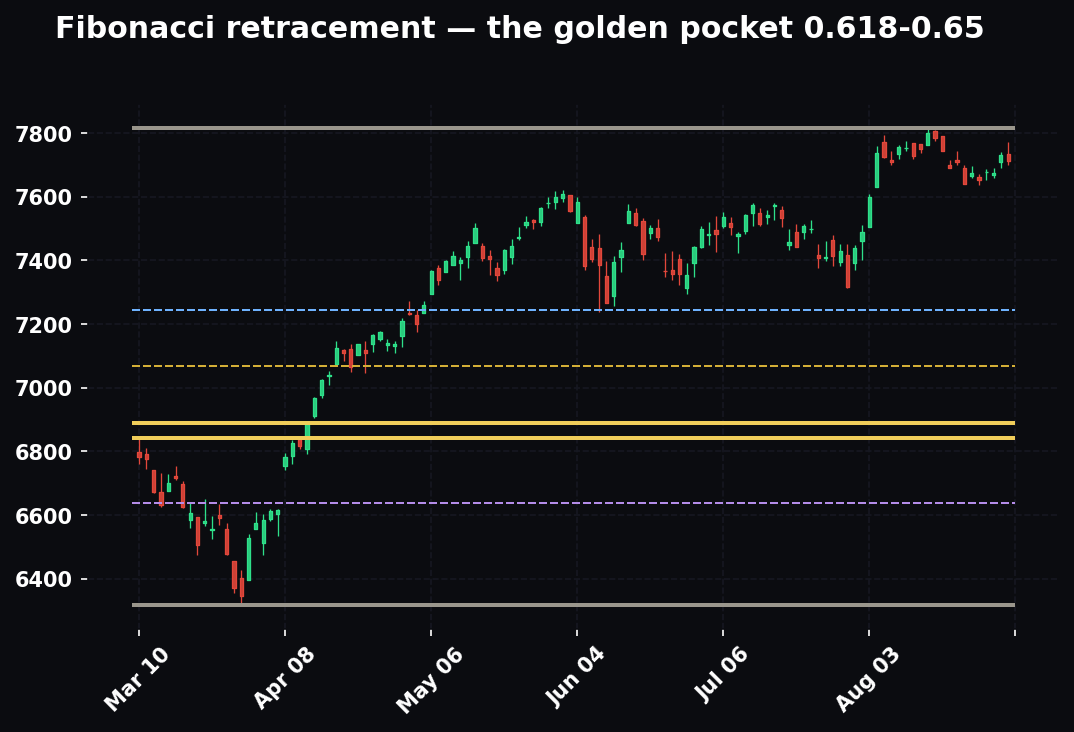
Your moving-average framework and your Fibonacci retracements define where price is likely to react. Order flow tells you whether the reaction is real. Say price pulls back in an uptrend into the golden pocket (0.618–0.65) of the last leg, and that pocket happens to sit right on the rising 55-EMA. That's a beautiful location — but a location is a hypothesis. The tape turns it into a trade: if you watch sellers get absorbed in the pocket, delta diverge, and buyers take initiative off it, the confluence zone did its job and the tape confirmed it. If instead price knifes through the pocket on expanding sell delta with no absorption, the level failed and you never took the trade. The Fib gives you the where; the tape gives you the go/no-go.
With VWAP and volume profile
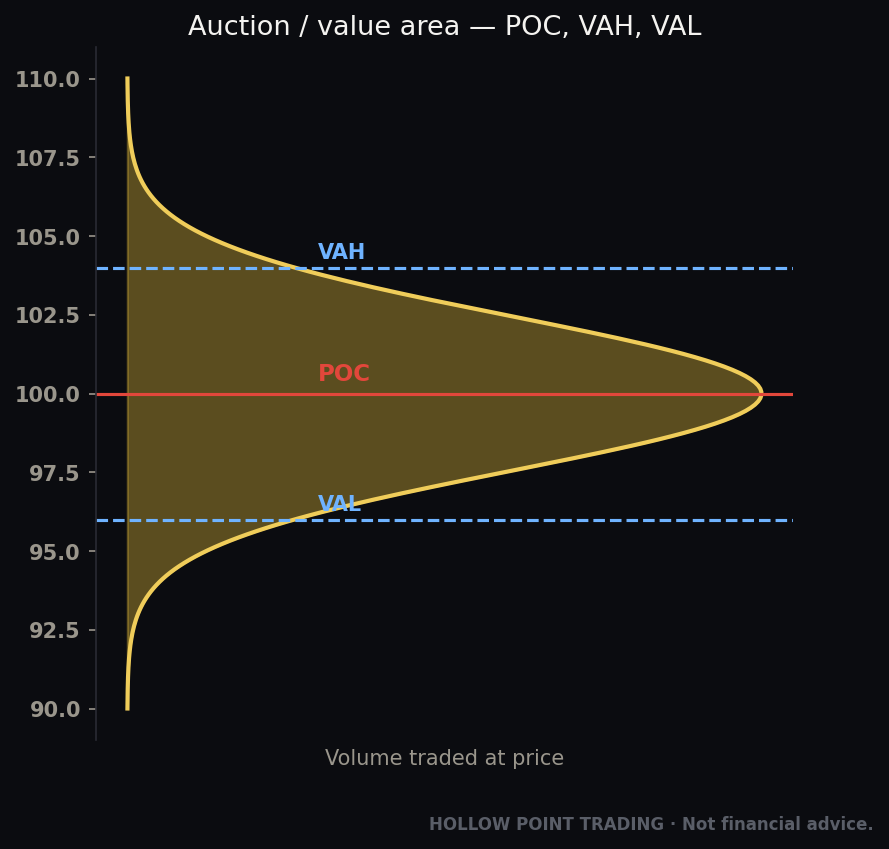
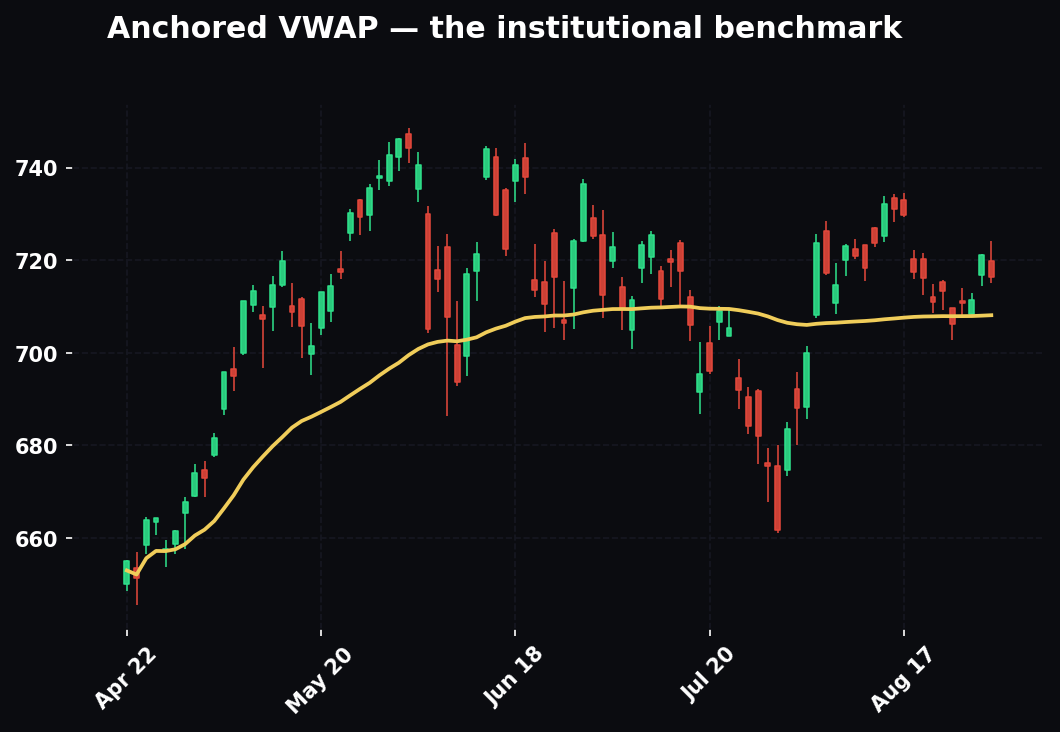
VWAP and the volume profile (POC, VAH, VAL) are magnets and decision points where lots of business has been done — which means they're exactly where absorption and large players show up. A test of VWAP from below in an uptrend is a classic spot to watch for the tape: if sellers can't push price back below VWAP because buyers absorb, VWAP holds as support and you're long with a tight stop under it. Value-area edges (VAH/VAL) behave like range edges — fade them when the tape shows absorption, follow them when initiative breaks them and delta expands. The profile tells you which prices matter; order flow tells you who's winning the fight at those prices. This is the same "no level, no trade" principle: VWAP and the profile are your levels, and the tape reads the fight at them.
With RSI / momentum divergence
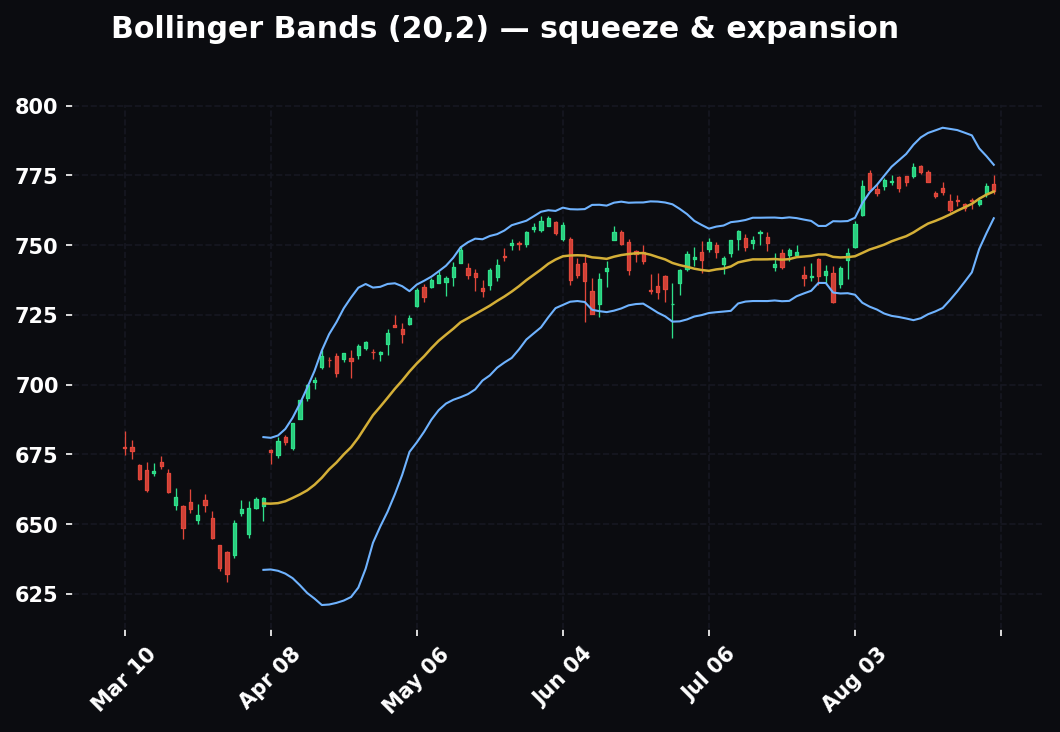
A classic momentum divergence (price new high, RSI lower high) and a cumulative delta divergence are two independent witnesses to the same phenomenon: the move is running out of fuel. When they agree — price makes a new low, RSI makes a higher low, and CVD makes a higher low — you have momentum and order flow both testifying that sellers are exhausted, at a level your structure work already flagged. Three independent tools, three different lenses, one conclusion. That's the texture of a genuinely high-conviction reversal, and it's rarer and better than any one signal screaming alone.
How the Pros Read the Tape Differently From Beginners
Two traders can stare at the same DOM and see opposite things. The gap is almost never speed of reading — it's a handful of habits.
Pros read location first, prints second. Beginners read prints first. A beginner sees a flood of green and thinks "buyers, get long." A pro sees the flood of green and instantly asks where — into resistance (fade candidate) or through it (follow candidate)? The prints are meaningless until the pro has anchored them to a level. Beginners let the tape tell them where to look; pros decide where to look first and use the tape only there.
Pros trust executed volume; beginners trust displayed size. The beginner's eye is drawn to the biggest number on the book. The pro's eye is drawn to what's trading on the footprint. The pro treats every resting order as a spoof until it absorbs, and the beginner treats every resting order as a wall until it vanishes.
Pros expect to do nothing most of the time. Beginners expect the tape to always be saying something. The professional baseline is "no edge, hands off," broken occasionally by a real read. The beginner baseline is a constant itch to act, so they manufacture signals out of noise. The single biggest performance difference between the two isn't the winning trades — it's the enormous number of trades the pro doesn't take.
Pros use the tape to manage risk; beginners use it to predict. The professional isn't asking the tape "where is price going?" — they know it can't answer that. They're asking "is my read still valid right now, and if it just broke, am I out?" The tape is a real-time invalidation monitor. The beginner wants a crystal ball and gets punished for treating a probability tool like a prophecy.
Pros size to the regime and the conviction; beginners size the same every time. A pro takes a full-size, wide-runner trade on a five-tool roar in a trend, and a quarter-size, quick-scalp on a lone against-trend absorption in chop — same skill, wildly different bet size. Beginners fire the same size at every read, so their good trades and their marginal trades pay out identically and the marginal ones bleed them.
Pros have already decided their exit read before entry; beginners improvise. Before the pro is even filled, they know what tape behavior will get them out — the mirrored absorption at the target, the invalidation trading through, the delta stalling. The beginner enters on a feeling and then negotiates with every tick, which is how a planned scalp becomes a hopeful bag-hold.
The Common Mistakes
Every one of these has emptied real accounts. Learn them cheap.
1. Trading the book instead of the tape. Beginners fall in love with big DOM orders and treat them as walls. Displayed orders are the most easily faked data in the market. Until size executes and absorbs, it's a claim, not a fact. Weight the tape and footprint over the book, always. The moment you catch yourself thinking "that big bid will hold it," ask whether a single contract has actually traded against it — usually the answer is no.
2. Reading the tape with no higher-timeframe context. Absorption in the middle of nowhere is nothing. Every order-flow signal needs a level to give it meaning. The tape is the bottom of the stack, never the top. If you find yourself trading purely off the scroll with no marked level, you're gambling, and the tape is a spectacularly expensive slot machine.
3. Overtrading the noise. The tape is always moving. There's green and red every second, and if you want to see a signal badly enough, you'll hallucinate one. This is the great danger: the granularity that makes tape reading powerful also makes it the easiest place to overtrade. Signals are rare. Most of the session, the correct read is "no clear aggression, no edge, hands off."
4. Confusing initiative and responsive activity. Same green prints mean "follow" at a breakout and "fade" at support. Location decides. Fade a breakout because you saw buying "into resistance" and get run over; chase support because you saw buying and call it a breakout, then get faded. You must know where you are before you interpret a single print.
5. Fighting absorption. If you're short and you watch a level absorb wave after wave of selling with no downward progress, the market is telling you your side is exhausted. Adding to the short because "it has to break" is how you donate to the iceberg. Respect absorption — it's smart money at work, and it's usually bigger than you.
6. Confusing an iceberg with a spoof. Both are big displayed size. One absorbs real trades and refills (institution defending, a reason to trade with it); the other vanishes without a trade (manipulation, a reason to get out of its way). Mixing them up makes you fade a real defender or lean on a fake wall. The question is always: did it absorb executed volume, or did it just disappear?
7. Ignoring the product's liquidity. These techniques shine in deep, liquid markets — index futures like ES and NQ, major FX, large-cap equities — where the book is real and size means something. In thin, illiquid names the book is sparse, spoofing is trivial, and a single order distorts everything. Don't run futures-grade tape reading on a low-float microcap; the microstructure is a different animal and the reads invert on you.
8. Marrying a read. The tape changes its mind in seconds. The buyer who was absorbing at 9:34 can be gone by 9:36. Order flow demands you hold opinions loosely and drop them the instant the transactions disagree. The moment you need to be right, the tape will punish you.
9. Reading delta as gospel. Cumulative delta is powerful but imperfect — classification errors, hidden orders, and venue fragmentation can distort it. A gorgeous divergence that isn't confirmed by an actual price reaction is a trap. Want the price turn, not just the delta line, before you commit.
10. Trading through the regime you're in. Fading in a runaway trend, or expecting breakouts to run in a dead range, is using the right read in the wrong environment. Every read has a regime where it works and a regime where it's a coin flip. Identify the regime first.
11. Chasing the size print. A 90-lot crosses and the beginner instantly slams the same direction. But you don't know if that institution is initiating or finishing — a big print at the end of a move is often the last aggressor getting filled right before the reversal. A size print is information about who's there, not a green light to chase. Wait to see whether it's absorbed.
12. No pre-defined invalidation. If you can't name the exact price that proves your read wrong before you enter, you don't have a trade, you have a hope. The tape's greatest gift is a precise invalidation level; throwing that gift away by entering without one converts your best risk tool into your worst habit.
Frequently Asked Questions
Do I need a footprint chart, or can I read the raw tape? You can start with raw Time & Sales and Level 2, and many great tape readers came up that way. But a footprint and a cumulative delta line do for the tape what a chart does for price: they aggregate a firehose into something your eye can hold. Most modern tape readers use the footprint as the primary lens and the raw tape as the trigger confirmation. Learn to read both; lean on the footprint.
What markets is this best for? Deep, centralized-order-book markets: NQ and ES futures, crude, gold, Treasury futures, major FX, and the most liquid large-cap stocks. The common thread is a real, deep order book where displayed and executed size actually mean something. Avoid running these techniques on illiquid microcaps, thin options, or fragmented markets where the book is a fiction.
How much screen time before it clicks? More than any other skill in trading. Plan on months of daily observation, most of it in replay with your levels marked first. The patterns — absorption, exhaustion, initiative — become things you feel before you can articulate, and that only comes from repetition. There is no shortcut and no indicator that replaces the reps.
Can order flow predict where price is going? No, and believing it can is the fastest way to blow up with it. Order flow tells you who is winning right now at this price. You react to the present; you don't forecast the future. Everything you do with it is probabilistic and comes with a tight, pre-defined invalidation.
Is spoofing something I'll actually see? Yes, especially from fast algos in liquid futures. You won't prove it's spoofing (that's for regulators), but you'll repeatedly see big displayed orders vanish on approach without absorbing. The practical takeaway isn't to catch the criminal — it's to never lean on a resting order that hasn't demonstrated, through executed volume, that it's real.
Should I automate any of this? Delta, CVD, footprint, and size-print alerts are worth automating — they make the firehose readable and flag candidates. But the decision — is this absorption at a level that matters, in this regime, with confluence — is judgment that lives with you. Use tools to surface candidates; make the call yourself.
How does this fit the 1:3 R/R rule? Beautifully — that's the whole mechanical payoff. Because the tape hands you a precise invalidation (the absorbed level, the iceberg price), you can set a tight, logical stop and still target a multiple. A vague chart entry might risk 40 ticks to make 40; a tape entry off absorption risks 10 to the same target. The tight stop the tape earns you is what makes 1:3 routinely achievable.
What if I don't have Level 2 or a footprint in my platform? Then trade the higher-timeframe levels and price action, and add order flow when you can access it. Don't fake it with a lagging indicator and call it tape reading. Partial tools honestly used beat full tools misunderstood.
How It Fits the Top-Down Process
Order flow is not a strategy. It's a trigger and execution layer that plugs into the bottom of the HPT top-down stack. Getting this hierarchy right is what separates a tape reader from a tape addict.
- Macro → Sector → Stock decides what you're trading and your directional lean. Tape reading never overrides this. If macro and the daily trend are up, you are hunting longs; the tape's job is to find you a great long entry, not to talk you into a short because thirty seconds looked red.
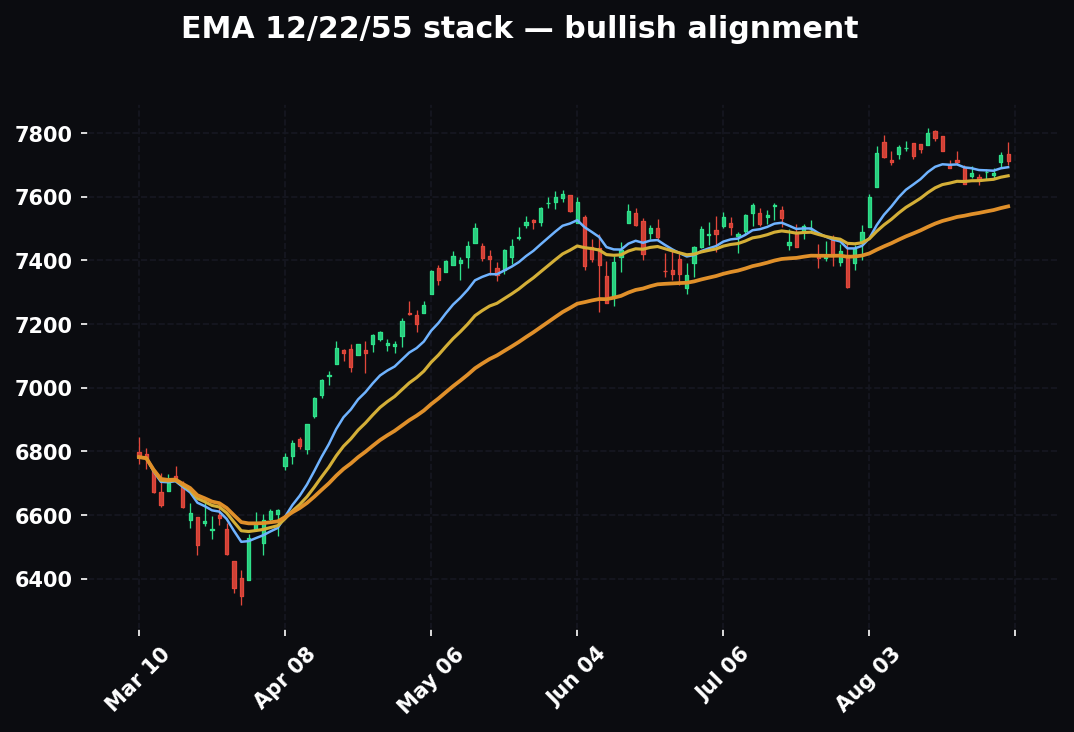
- EMA 12/22/55 on your execution timeframe defines the trend you're aligning with. Absorption with the trend (buyers defending a pullback in an uptrend) is a high-odds trigger. Absorption against the trend is a lower-odds counter-trend scalp you size down for and take profit fast.
- Timeframe-weighted confluence is the whole point. Order flow is the lightest-weighted, fastest timeframe. It gets a vote, not a veto. One tool — a delta divergence alone — is a whisper. Delta divergence plus absorption on the footprint plus an iceberg plus a daily support level plus trend alignment is a roar. You wait for the roar.
- 1:3 R/R is what tape reading earns you. Because the tape gives you such a precise trigger — you know the exact level that invalidates the read — you can place a tight, logical stop and still target a multiple. That tight stop is the mechanical payoff of the skill.
- Discipline over prediction. The tape is not a crystal ball. It doesn't tell you where price is going; it tells you who's winning right now. You react. The instant your invalidation level trades through, the read is dead and you're out — no arguing with the transactions.
Where does tape reading matter most? At decision points — your pre-marked levels, session opens, VWAP tests, prior-day high/low, breakout retests, value-area edges. It's least useful in the chop of the middle of a range with no level nearby, where it generates the most noise and the most bad trades. Use it at the edges, where the higher timeframe says something should happen. The tape is a scalpel, not a shotgun — devastating at a precise point, useless waved around at the whole session.
The Cheat-Sheet
Tape reading in one screen. Keep it next to your DOM.
The three instruments
- Time & Sales (tape): executed trades — price, size, side. Green = lifted ask (aggressive buyer). Red = hit bid (aggressive seller). Ground truth.
- DOM / Level 2: resting limit orders stacked above/below. Intent, not fact. Easily faked.
- Delta / Footprint: ask-vol minus bid-vol; per-price aggression inside each bar. Makes the firehose readable.
The core reads
- Absorption: aggression pouring in, price won't move → passive giant soaking it up → fade the exhausted aggressors at a level.
- CVD divergence: price new low, delta higher low (or vice versa) → the move is out of fuel.
- Effort vs result: big delta, tiny price move → passive side winning → price goes against the aggression.
- Iceberg: resting order that refills after being hit → institution hiding size and defending. Trade with it.
- Spoof: big order that vanishes without a trade on approach → fake; path opens that way. Get out of the way.
- Size prints: trades dwarfing the average → someone big decided something. Note the side; don't chase blindly.
- Initiative vs responsive: aggression through a level = follow; aggression at a level back into range = fade.
Regime adjustments
- Trend: favor continuation; absorption with trend is best; against-trend reads are scalps, size down.
- Range: favor reversion; fade the edges on absorption; watch for the failure of edge-absorption that births a trend.
- High-vol / news: book goes useless, reads whipsaw; stand down through the impulse, re-engage when rhythm returns.
The discipline
- Tape > footprint > book. Executed beats displayed, always.
- No level, no trade. Order flow is the trigger, the higher timeframe is the thesis.
- Location first, prints second. Know where you are before you read the flow.
- Trigger sets a tight stop at the invalidation level → that's how you earn 1:3.
- Signals are rare. Most of the session is "no edge." Sit.
- Aggression is finite. When it exhausts against a level, price goes the other way.
- Invalidation trades through → you're out. No negotiating with transactions.
Sizing the confluence — the more of these agree, the bigger the read:
- Higher-timeframe level (daily/H4 support-resistance, VWAP, value-area edge) ✓
- Trend alignment (EMA 12/22/55) ✓
- Regime is right for the read (trend→follow, range→fade) ✓
- Absorption on the footprint ✓
- Cumulative delta divergence, confirmed by the price turn ✓
- Iceberg / large passive defense ✓
- Aggressive initiative confirming the turn ✓
- A second lens agreeing (RSI divergence, golden pocket, VWAP hold) ✓
One check is a whisper. Two or three is a setup. Five or six at the same price is the roar you've been waiting for — and even then, you still risk only what the invalidation costs, and you still target the multiple.
Where to Go From Here
You don't learn the tape by reading about it — you learn it by watching it with a marked-up chart beside you, level by level, session by session, until absorption and exhaustion become things you feel before you can articulate them. Start in replay. Pull up NQ or ES, mark your levels first, then step through the tape at those levels and watch what the transactions do when price arrives. Do it a hundred times before you risk a dollar on it live. Keep a log: screenshot the footprint at your level, write what you read, write what happened, and grade whether your read was right for the right reason. The reps compound; the log makes them compound faster.
A concrete practice routine: each morning, mark three levels the higher timeframe cares about — overnight high/low, prior-day high/low, daily support/resistance, VWAP. Do nothing until price reaches one. When it does, narrate the tape out loud: who's aggressive, is it being absorbed, does the footprint agree, what does delta say, is there a big player, what's the regime, where's my invalidation. Most of the time the answer will be "no clean read, pass." That's not failure — that's you correctly refusing the ninety percent of the session that has no edge. The tape rewards patience and punishes ego more than any other tool in trading. It will show you, transaction by transaction, exactly who's winning — but only if you've done the higher-timeframe work to know where to look, and only if you have the discipline to sit on your hands the ninety percent of the time there's nothing to read.
Get that right, and you'll take entries other traders can only dream about: precise, tight-stopped, on the exact tick the big player showed his hand. That's the whole edge. Not predicting the future — hearing the present, clearly, before it becomes the past.
Bound by rules, feared by trade.