
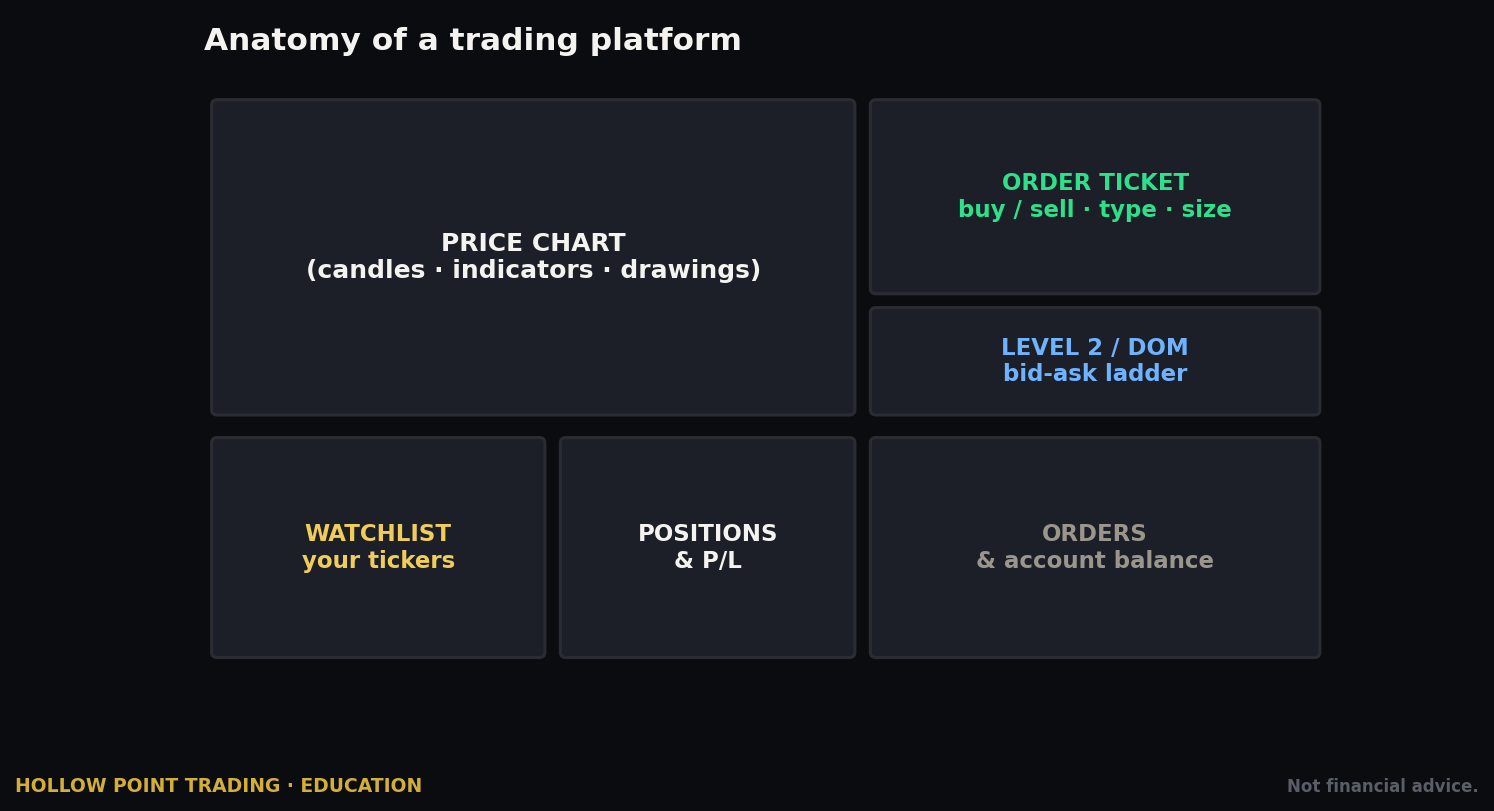
Most traders live entirely on the chart. Candles, EMAs, a couple of indicators, and a horizontal line where price bounced last Tuesday. That's fine — the chart is the map. But the chart is history. It tells you where price has been. Level 2 and Time-and-Sales tell you what's happening right now, at the level of individual orders and individual fills, before a single candle has finished printing.
This is the closest thing retail gets to watching the actual fight instead of the highlight reel. And like any fight, most of what you see is feints. The single biggest mistake new traders make is treating the order book as a list of facts. It isn't. It's a negotiation, and everyone in it is allowed to lie — except in the one place where lying is impossible, which is the tape.
This guide teaches you to read both — the ladder and the tape — the way a floor trader reads a room. We'll define every term once, build the mechanism from the ground up, walk real worked examples with real numbers, break down how the tool behaves in trending versus chopping versus high-volatility markets, show you how it stacks with volume profile, VWAP, and the EMA 12/22/55 framework, then fold all of it into the Hollow Point top-down process so the book becomes a trigger tool, not a distraction. Because here's the thesis up front, and everything that follows is a variation on it: Level 2 and the tape are execution tools, not thesis tools. They don't tell you what to trade. They tell you when to pull the trigger on a trade your top-down process already found, and where to put the stop so the loss is small when you're wrong.
Read that twice. Every mistake in this game traces back to a trader who forgot it.
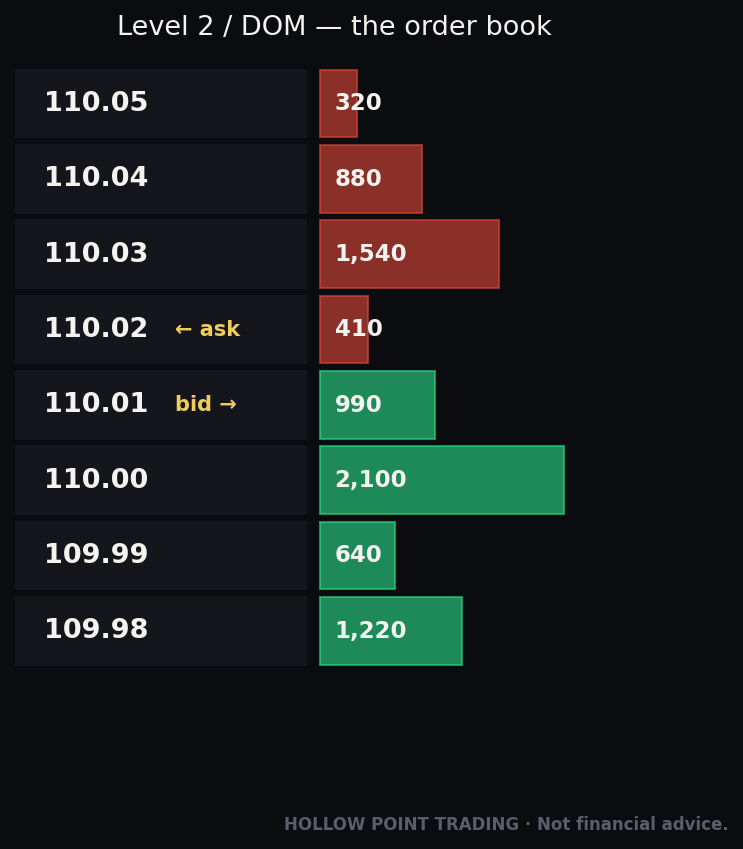
The Concept: What You're Actually Looking At
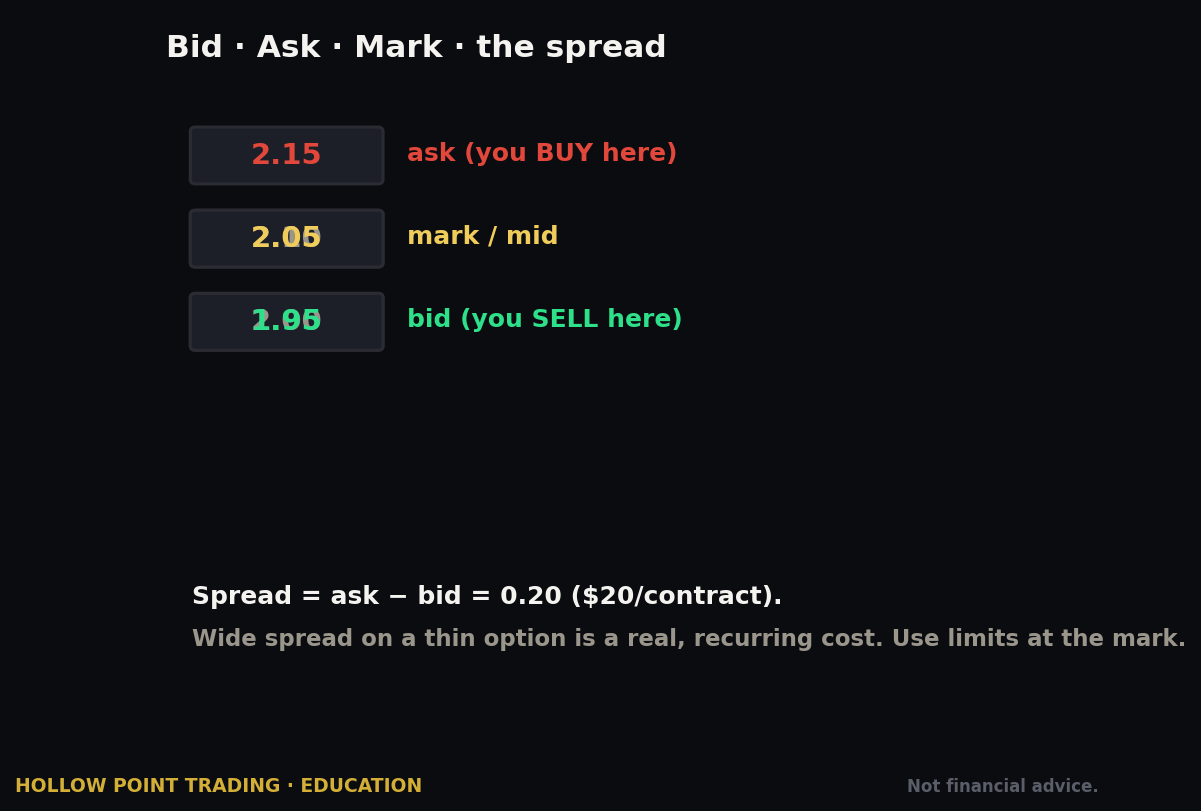
Every liquid market trades in a continuous auction. At any instant there are buyers willing to pay a certain price and sellers willing to accept a certain price. The highest price a buyer is currently advertising is the bid. The lowest price a seller is currently advertising is the ask (also called the offer). The gap between them is the spread. On a heavily traded stock like AAPL the spread might be a single penny — 189.44 bid, 189.45 ask. On a thin small-cap it might be fifteen cents. On the NQ futures contract it's usually one tick (0.25 points, worth $5). The width of that spread is your first piece of information: a tight spread means a liquid, competitive, well-populated auction; a wide spread means thin participation, more slippage, and a book you should trust less.
Level 1 versus Level 2
Level 1 data is what most people see: the best bid, the best ask, the last trade price, and the day's cumulative volume. That's the top of the book — one line on each side. It answers "what can I buy or sell at right now, and for how much." It's enough to place a trade. It is nowhere near enough to read one.
Level 2 peels the lid off. It shows you the depth — every price level with resting orders above the best ask and below the best bid, and how much size sits at each one. Instead of "best bid is 100.00," you see 100.00, 99.99, 99.98, 99.97, all the way down, each with the number of shares (or contracts) waiting there. Same going up the ask side. This stacked, two-sided display of resting limit orders is the order book, and when it's presented as a vertical price ladder with bids on one side and asks on the other, futures traders call it the DOM — Depth of Market. Most professional futures platforms center the ladder on the current price and let you click directly on a price rung to place an order there, which is why the DOM is both a reading tool and a trading tool in one window.
The tape — the only honest screen
Time-and-Sales — "the tape" — is the other half, and the more important half. Level 2 shows you intentions (orders that haven't executed yet). The tape shows you reality (trades that actually happened). Every time a buyer and seller agree and a trade executes, it prints on the tape: the price, the size, and the exact timestamp, usually color-coded green if it hit the ask (buyer was the aggressor) and red if it hit the bid (seller was the aggressor). Prints that occur between the bid and ask, or at odd sizes, are often venue-internalized or dark-pool crosses, and many platforms shade them a third color.
The tape scrolls continuously, and it is the only completely honest thing on the screen — because a print is a done deal. Nobody can fake a trade that already cleared. You can cancel a limit order. You cannot cancel a fill. This is why, when the book and the tape disagree, the tape wins every single time.
Hold those two ideas apart, because the whole discipline lives in the gap between them:
- The order book is what people are saying they'll do.* It can be a lie.
- The tape is what people actually did.* It cannot be a lie.
The skill is reading intentions against reality — watching what the book advertises, then watching the tape to see whether the advertisement was real. Everything else in this guide is a specific application of that one sentence.
The three questions the tape answers that the chart can't
Before we go deeper, understand why this is worth your screen time. A finished candle tells you the open, high, low, and close over some period. It hides three things the tape shows you live:
- Who was the aggressor. A green candle can be built by patient buyers slowly lifting offers, or by one violent market-buy sweep. The candle looks identical. The tape does not.
- Whether size was absorbed or simply absent. A doji at support could mean fierce two-sided battle (huge volume, buyers eating sellers) or dead silence (nobody trading). The chart shows the same small-bodied bar. The tape shows the difference between a war and a nap.
- The exact moment intent flipped. A candle closes at a fixed clock time. Order flow flips when it flips — sometimes 40 seconds into a 5-minute bar. The tape lets you act on the flip instead of waiting for the candle to confirm what already happened.
That's the entire value proposition. You are trading time resolution the chart cannot give you.
The Mechanism: How Orders, Quotes, and Fills Actually Work
To read the book you need to understand what's inside it. There are two fundamental order types, and everything else is a variation.
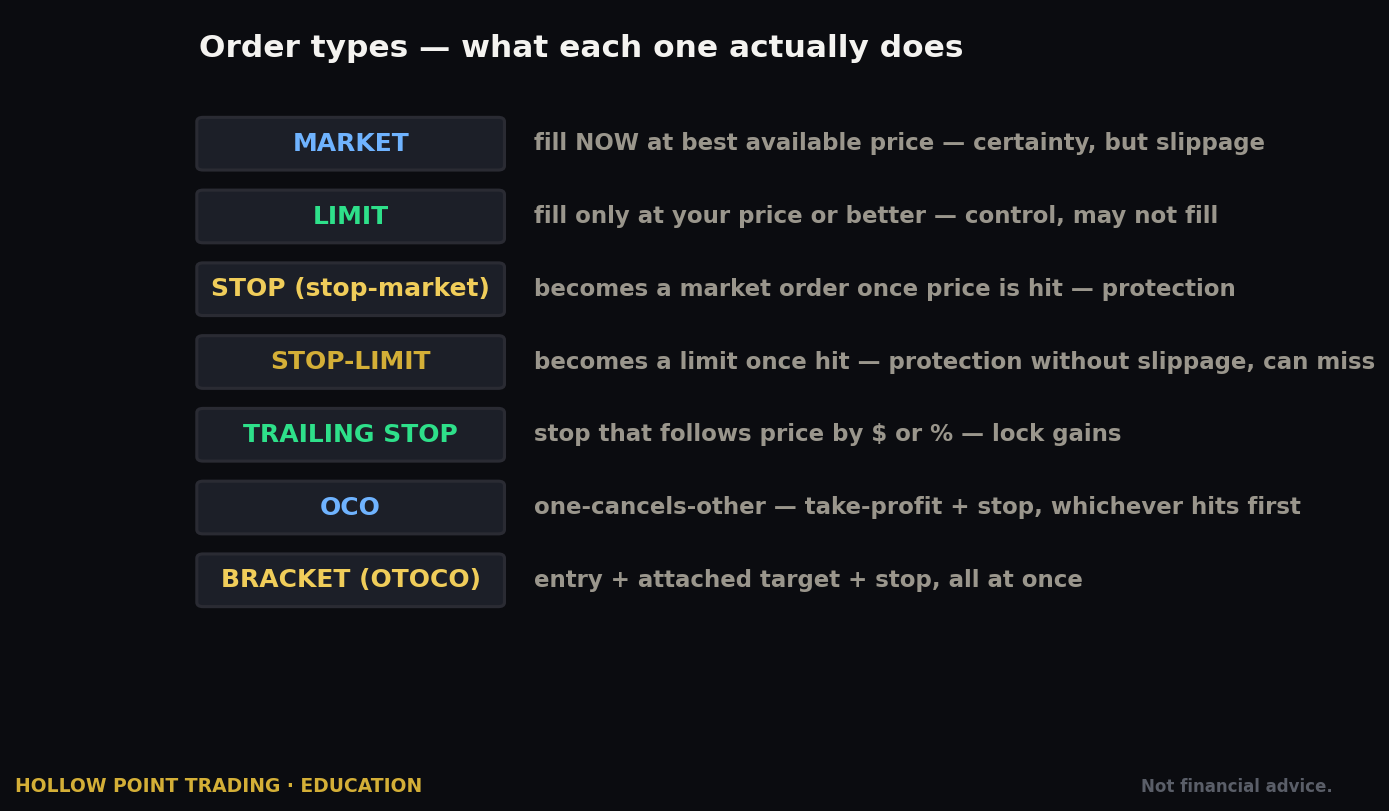
A limit order says "buy me X shares at this price or better, and wait." It rests in the book. It provides liquidity — it's a standing offer someone else can hit. A limit buy sits on the bid; a limit sell sits on the ask. These are the orders you see on Level 2. They are patient by definition: a limit order accepts the risk of never being filled in exchange for a better price and no spread cost.
A market order says "fill me now, whatever the going price is." It removes liquidity — it reaches across the spread and takes whatever's resting there. Market orders are mostly invisible on Level 2 until they execute, at which point they show up on the tape. They are impatient by definition: a market order accepts spread cost and slippage in exchange for a guaranteed, immediate fill.
This is the single most important mechanical fact in this entire guide: Level 2 shows you resting limit orders. It does not show you market orders until they hit the tape. So the book shows you the passive, patient side of the market. The tape shows you the aggressive, impatient side. A wall of size on the bid means nothing if a bigger market-sell blows through it — and you'll only see that in the tape, not in the book.
The order types that hide between the two
Between the pure limit and the pure market order sit the ones that generate most of the deception you'll read about later:
- Stop orders are invisible resting triggers that become market orders when price touches them. A cluster of stops below support is a pool of pending aggression you cannot see in the book — until it fires and the tape suddenly floods red. Reading where stops must be (just under an obvious low, just over a round number) is half of anticipating a sweep.
- Iceberg / reserve orders display a small visible tip while hiding the bulk. You see 500; there are 50,000 behind it.
- Hidden / non-displayed orders show nothing at all and simply appear on the tape when hit.
- Fill-or-kill and immediate-or-cancel orders flash in and out faster than you can perceive them, and are the raw material of algorithmic probing.
You will never see the hidden and iceberg portions directly. You infer them from tape behavior, which is exactly the skill this guide is teaching.
Who's putting orders in the book?
Historically, quotes came from market makers (MMs) — firms obligated (or incentivized) to post two-sided quotes and provide liquidity, profiting off the spread. On Nasdaq's old Level 2 you'd literally see MM identifier codes (four-letter tags) posting bids and offers, and old-timers learned to read specific firms' behavior. Alongside them are ECNs — Electronic Communication Networks like ARCA, EDGX, BATS — venues that match buyers and sellers directly and display their aggregated book.
Here's the modern reality you have to internalize, because it changes how much you can trust what you see: today's markets are fragmented across a dozen-plus exchanges and dozens of off-exchange venues, and a huge share of retail order flow never touches a public exchange at all. It's routed to wholesalers/internalizers (payment for order flow) and filled internally, or crossed in dark pools — private venues where large orders execute without displaying to the public book. Roughly half of U.S. equity volume on many days trades off the lit exchanges. That flow prints on the consolidated tape (usually flagged), but it was never visible in the order book beforehand.
Translation: the "market-maker names" nostalgia is largely gone for equities, and a large fraction of true supply and demand is never in the book you're staring at. We'll come back to what that means for retail — it's the most important honesty section in this piece.
Aggressive vs. passive — the core vocabulary of flow
Every trade has two sides, and one of them was the aggressor. If a trade prints at the ask, the buyer crossed the spread to get filled immediately — the buyer was aggressive (a "lift" or "taker"), the seller was passive (the "maker" who was resting there). If a trade prints at the bid, the seller was aggressive (a "hit"), the buyer was passive.
Reading who's aggressive is 80% of tape reading. Sustained green prints hitting the ask means buyers are paying up — they want in badly enough to pay the spread. Sustained red prints hitting the bid means sellers are hitting out — dumping into whatever bid exists. The aggressor is the one revealing urgency, and urgency is information. A passive fill tells you someone was willing to wait; an aggressive fill tells you someone couldn't.
The subtle version, and the one that separates readers from watchers: track the ratio and the trend of aggression, not any single print. Ten green prints then ten red prints is a balanced fight. Ten green prints of increasing size, each lifting a higher offer, is a buyer who is winning and accelerating. Same green count, but each print smaller than the last and stuck at the same price, is a buyer running out of gas. The color tells you direction; the size trajectory and the price progression tell you conviction.
The Illusion of Size: Spoofing, Pulling, and Why Big Numbers Lie
Now the hard part. The book displays size, and beginners assume size is intention. It often isn't.
A spoof is a large limit order placed with no intention of being filled, meant to create a false impression of supply or demand — then cancelled before it can execute. A trader who wants to buy might slap a huge fake sell order on the ask to scare weak hands into selling, buy their shares cheaply on the bid, then yank the fake offer. Spoofing is illegal (it's explicitly banned under Dodd-Frank, and firms have paid nine-figure fines for it — the Navinder Sarao case, tied to the 2010 Flash Crash, is the famous one), but a version of the behavior — placing and pulling — happens constantly and legally in the gray zone, and algorithms do it in milliseconds.
Pulling (or "fading") is the honest cousin: a real order that gets cancelled as price approaches, because the person genuinely no longer wants the fill at that price. The intent was real when it was placed; it stopped being real when conditions changed. Either way, the lesson is identical: displayed size that disappears the moment it's tested was never real liquidity you could have leaned on.
The opposite lie — hidden size
There's also the opposite deception. An iceberg order shows only a small piece of a much larger order — you see 500 shares on the ask, but there are 50,000 hidden behind it, refilling every time the visible tip gets eaten. So the book can under-state size as easily as it over-states it. A level that keeps getting hit on the tape but won't clear from the book is often an iceberg — real, patient, big-money size soaking up everything thrown at it. The tell is a mismatch between the tape and the ladder: the tape shows thousands of shares trading at 48.50, but the displayed 48.50 bid never seems to shrink. That arithmetic only works if size is hidden and refilling.
The polygraph test
This is why the tape is your polygraph. You cannot tell a spoof from real size by looking at the book alone. You tell them apart by watching what happens when the level gets tested:
- Size sits, price approaches, size vanishes before any prints hit it → spoof / pull. Fake.
- Size sits, tape hammers it with prints, size stays or refills → iceberg / real absorption. Real, and important.
The number on the ladder is a claim. The tape is the cross-examination. A claim you never cross-examine is just a rumor you decided to trade on.
A worked distinction, tick by tick
Say ES is at 5000.00 and there are 800 contracts showing on the 5001.00 offer — enormous relative to the 60–100 that usually rests there. Two futures unfold:
Scenario A (spoof). Price ticks 5000.25, 5000.50, 5000.75. The tape shows small buys lifting the tiny offers in between. At 5000.75 — one tick away — the 800 evaporates to 40 in a single refresh, no prints having hit it. Price tags 5001.00, lifts the remaining 40, and runs to 5002.50. The 800 was a wall of fog. It existed to slow the tape down and shake out longs, or to let its owner accumulate on the bid before pulling. The trade was to buy the pull, not to fear the wall.
Scenario B (iceberg). Same 800 showing. Price reaches 5001.00 and the tape lights up green — 200 lift, 300 lift, 250 lift, 400 lift. That's 1,150 contracts traded at 5001.00, which is more than the 800 that was ever displayed. Yet the offer still shows several hundred resting. It's refilling faster than it's eaten. This is a genuine seller defending 5001.00 with hidden size, and price stalls, then rolls back to 5000.00. The trade was to respect the wall — because this time the cross-examination proved it real.
Identical picture at first glance. Opposite trades. The tape is the only thing that told them apart.
Absorption and Exhaustion: Where the Tape Earns Its Keep
Two patterns are worth more than everything else combined, because they mark the moments trends turn or hold.
Absorption is when heavy aggressive volume hits a level and price refuses to move. Imagine price falling into a support zone. The tape lights up red — sellers hammering the bid, print after print, real size. Normally that pushes price down. But it doesn't. The bid keeps refilling. Every seller gets filled, and price holds. Somebody big is absorbing all that selling — sitting on the bid, eating everything, not flinching. When the sellers exhaust themselves and price snaps up off that level, you understand why: the supply got soaked up by a bigger buyer. Absorption is the fingerprint of institutional accumulation, and it's one of the few things Level 2 and the tape show you that the chart only reveals after the fact (as a long lower wick or a volume spike on a bar that closed near its high).
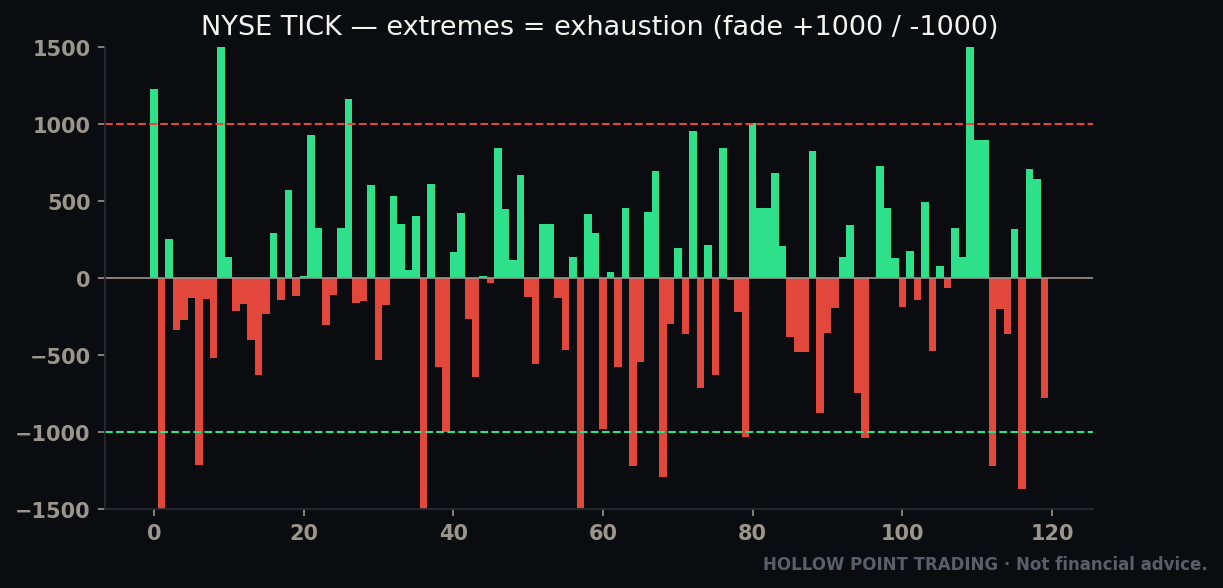
Exhaustion is the flip side of momentum: a burst of aggressive activity that empties the tank. Price is ripping up, green prints flying, and then — the pace of prints slows, the size shrinks, the ask stops getting lifted, and the buying just... stops. The aggressors ran out. No absorption needed; the fuel is simply gone. Exhaustion often shows as a climax — a sudden surge of huge volume (frequently the largest prints of the move) right at the extreme, followed by a dead tape. That surge is the last of the impatient money getting filled at the worst price. When it goes quiet after a climax, the move is vulnerable to a snap-back.
The difference matters and it's worth being precise about: absorption is active (a bigger player deliberately eating the flow at a chosen price), exhaustion is passive (the flow simply dries up on its own). Both mark turns, but they give you different things. Absorption gives you a level to lean on — the exact price where the big player defended, which becomes your stop reference. Exhaustion gives you a timing cue that a move is out of gas, but not a precise level, so it's better for taking profit or fading than for a fresh entry with a tight stop.
Block trades and the footprint of size
Block trades deserve their own paragraph. A block is a single very large print — an institution moving size, often crossed as one lot or printed from a dark pool. On the tape it stands out: a print 10x, 50x, 100x the typical size. A block hitting the bid (aggressive seller unloading) versus lifting the ask (aggressive buyer accumulating) tells you which direction big money is leaning right now. But a single block is genuinely ambiguous — a dark-pool cross can print on the tape after the fact and tell you nothing actionable, because the price was negotiated privately. What matters is the series: several blocks all hitting the same side, at or near the same level, repeatedly, is a footprint worth respecting. One elephant track could be anything. A trail of them tells you which way the elephant walked.
The two patterns as a decision tree
Put them together and you have a simple live checklist at any important level:
- Heavy aggression into the level, price holds, size refills → absorption → the defended side wins → trade with the defender, stop just past them.
- Heavy aggression away from the level that then dies at the extreme → exhaustion → the aggressor is spent → fade or take profit, don't chase.
- Heavy aggression that breaks the level clean, size on the far side pulling → acceptance / breakout → the level failed → trade the break, not the bounce.
Reading which of the three is happening, in real time, is the entire craft.
How to Read It: Worked Examples
Enough theory. Let's read some tape.
Worked Example 1 — The Fake Wall (spoof/pull)
You're watching a stock at 50.00. On the ask at 50.05 sits an enormous offer — 40,000 shares — dwarfing everything else on the book. A beginner thinks: "Massive resistance, big seller, I should short into that or wait." Watch instead.
Price grinds up. 50.01, 50.02, 50.03. The tape shows moderate green prints lifting small offers. Price reaches 50.04 — one tick from the wall — and the 40,000 offer disappears. No prints ate it. It just vanished, and price pops through 50.05 to 50.09.
That was a spoof or a pull. It was never resistance; it was a scarecrow. The read: when a wall vanishes without being traded, the direction it was "blocking" is where price wants to go — the fake order was often there precisely to slow price down while someone positioned the other way. The trade wasn't to short the wall. It was to buy the break the instant the wall pulled, with a stop back below 50.03 where the grind started. Risk 15 cents to make 45+, and the timing came from the pull, not from a candle.
Worked Example 2 — Real Absorption at Support
Same stock, later. It's selling off into 48.50, a level your daily chart flagged as the 55-EMA and prior demand. The tape goes heavy red — sellers hitting the bid, big prints, real urgency. On Level 2, the 48.50 bid shows 5,000 shares. It gets hit. It refills to 5,000. Hit again. Refills. The tape shows tens of thousands of shares trading at 48.50 over a minute, but price will not break 48.50. It ticks 48.51, 48.50, 48.51 — pinned.
That's absorption. An iceberg buyer is defending 48.50, eating every seller. You don't fight it — you join it. The read: when the selling pressure exhausts (red prints thin out, pace slows) and the first green prints start lifting the 48.55 ask, you go long, stop just below 48.50 (where the defender lives, say 48.44 to give it a few cents of noise room). If that level cracks on heavy volume, you're wrong and you're out small. That's a clean, tight-stop entry that the chart alone would never have given you — the chart would just show a hammer candle after the fact, and you'd be entering 30 cents higher with a worse stop.
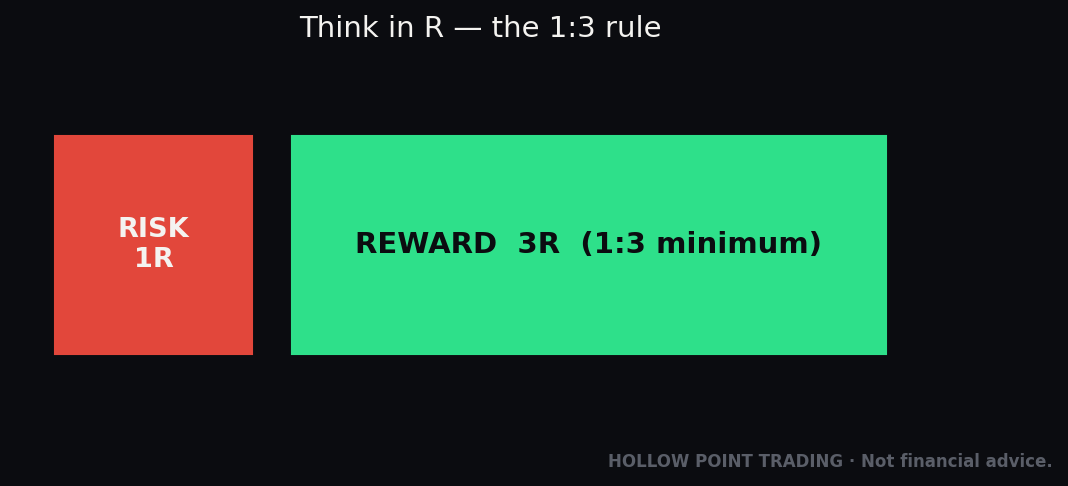
Run the R/R: entry 48.56, stop 48.44 (12 cents of risk), target back at the 50.00 round number (144 cents). That's a 1:12 on paper, and even if you only take partials into 49.40 it's comfortably past the 1:3 minimum. The tape didn't find the trade — your daily EMA and demand zone did. The tape made the entry surgical.
Worked Example 3 — Exhaustion at the Highs
The stock is now ripping. 49.80, 49.90, 50.00 — a psychological round number. Into 50.00 the tape explodes: the biggest green prints of the day, a climax of buying, 30,000 shares in a few seconds lifting every offer up to 50.02. Then silence. The prints shrink to 100-share dribbles. The ask at 50.03 sits there — nobody's lifting it. The tape goes quiet.
That's exhaustion after a climax. The impatient buyers all got filled at the top tick. There's no one left to pay up. The read: this is not a place to chase long. If you're already long from 48.50, this is where you take profit into strength — you sell your shares to the climax buyers, which is exactly what the smart money is doing. If you're flat and aggressive, the first red prints hitting the bid below 50.00, with the tape confirming supply and offers now stacking above, is a mean-reversion short back toward VWAP — but that's an execution scalp, not a swing, and only if your higher-timeframe read allows it.
Worked Example 4 — The Stop Run (sweep and reclaim)
This one appears daily in futures. NQ has been ranging with an obvious swing low at 18,000.00. Every retail chartist can see it, so stops are stacked just beneath — 17,995 and lower. Price drifts down to 18,001. The tape is thin and orderly. Then, in a two-second burst, the tape floods red: 17,999, 17,996, 17,992 — a cascade of aggressive sells far larger than anything the range produced, blowing through the resting bids. That's the stops firing, not fresh conviction.
Here's the tell that separates a sweep from a real breakdown: at 17,990 the red prints stop cold, a large bid appears and holds, and within seconds green prints reclaim 18,000. The market ran the stops, filled a big buyer at a discount using retail's own sell orders as liquidity, and reversed. The read: a sweep that reclaims the swept level is a trap, and the trade is long on the reclaim, stop below the sweep low (17,988), targeting the top of the range. The chart will later show a long-wicked candle poking below 18,000 — but by the time that candle closes, the move is already 40 points done. The tape gave it to you live.
Worked Example 5 — Chop, and the discipline of no trade
The most valuable example is the one where you do nothing. Midday, low volume, the stock oscillates 49.60–49.80. The book is thin and constantly reshuffling; size flickers on and off both sides. The tape alternates green-red-green-red with no size trajectory, no absorption, no climax — just noise. A beginner reads the flicker as "action" and scalps into it, getting chopped for spread-and-commission losses six times.
The read: there is no read. No level from your top-down work is in play, the aggression has no persistence, and the book is telling you nothing because there's nothing to tell. The professional response is to close the ladder or size down to nothing until a real level and a real flow return. Recognizing the absence of a signal is itself a signal — the signal to sit on your hands.
Notice the through-line in all five: the chart gave the level, the tape gave the timing — or told you to stand down. You didn't use Level 2 to decide what mattered — 48.50, 50.00, 18,000, the EMA. Your top-down work did that. You used the book and tape to decide the exact moment to act, where the invalidation lived, or whether to act at all.
Multi-Timeframe: The Tape Is a Microscope, Not a Telescope
A recurring beginner error is trying to make the tape do a job it physically can't. The tape and DOM operate on a horizon of seconds to a few minutes. That's the microscope. Your bias, your trade selection, and your levels come from the telescope — the daily, the 4-hour, the hourly. The two are not competitors; they're different magnifications of the same market, and you use them in sequence.
Here's the correct multi-timeframe workflow, top to bottom:
- Daily / weekly — bias and the big levels. Where's the EMA 12/22/55 stack pointing? Where are the obvious swing highs/lows, the volume-profile POC, the prior significant closes? This is where you decide long or short and roughly where. The tape has zero to say here. Do not open it.
- Hourly / 15-minute — the trade and the zone. Refine the daily level into a specific zone and a specific structure — "long the retest of the 15m demand at 48.40–48.60, invalidation under 48.30, target the prior high at 50.00." Still no tape. You're building the plan the tape will later trigger.
- 1-minute / tick — the trigger. Now, and only now, at that pre-defined zone, you drop to the tape and DOM to time the entry — absorption confirming the defense, a sweep-and-reclaim, exhaustion of the counter-flow — and to place the stop where the real orders sit.
The rule that keeps this honest: the microscope can only confirm what the telescope already framed. If the daily says short and the 1-minute tape looks explosively bullish, you do not flip. You either stand aside or you use that bullish tape as your exit on shorts and your warning that the counter-trend push has fuel — never as a reason to go long against your own higher-timeframe bias. A tape signal with no higher-timeframe home is not a trade. It's noise wearing a costume.
Different Regimes, Different Tape
The same tape behavior means different things depending on the market's mood. Reading the book without reading the regime is like reading a sentence without knowing the language.
Trend
In a clean trend, the tape has a persistent aggressor. In an uptrend, green prints dominate, pullbacks show absorption on the bid (buyers defending higher lows), and offers pull ahead of price as sellers refuse to commit — so walls above tend to be soft and breakouts run. The playbook: use absorption on pullbacks into your trend levels as entries, and distrust resistance walls (they mostly pull). The trend's aggressor is the one whose feints are real and whose walls are fake.
Chop / range
In a range, aggression is symmetrical and non-persistent — the exact picture from Worked Example 5. Absorption appears at both edges (the range boundaries are where the real players defend), and the middle is meaningless noise. The playbook: only respect the tape at the range extremes, fade climaxes back into the middle, and refuse to trade the center. Most retail losses are manufactured here, mistaking flicker for opportunity.
High volatility
In high-vol conditions — news, open, CPI, FOMC — the book thins out dramatically because market makers and algos widen and pull to avoid getting run over. Spreads gap, size vanishes, and the tape prints in violent bursts. This is the regime where the DOM is least reliable as a depth gauge (there's barely any resting size to read) and most dangerous to lean on for tight stops (a single sweep can move price further than your whole normal range). The playbook: size down or stand aside, widen your expectations, and treat any wall with extreme suspicion — thin books spoof easily and break violently. Paradoxically, this is when beginners most want to trade the tape (it's exciting) and when it's least trustworthy.
The meta-lesson: identify the regime first, from the chart, then apply the tape rules that fit it. The same 40,000-share wall is soft resistance in a trend, a real boundary defender in a range, and pure fog in high vol.
Confluence: Stacking the Tape With Other Tools
The tape is at its most powerful not alone but as the final confirmation on a level that three other tools already agree on. Here's how it combines with the core Hollow Point toolkit.
With volume profile
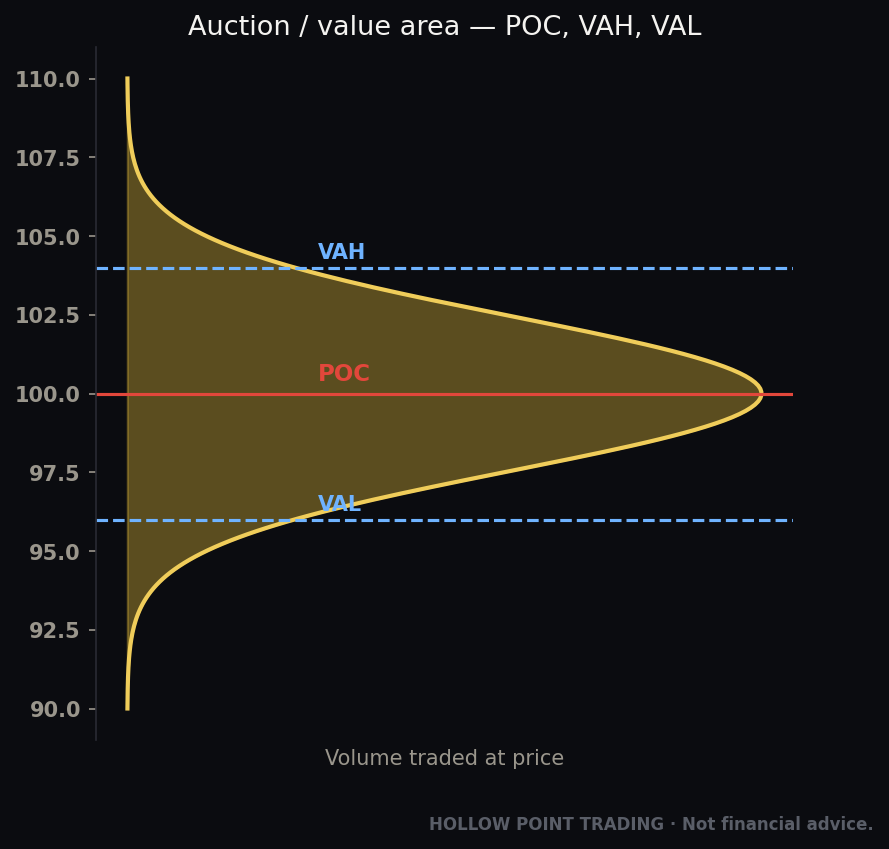
Volume profile shows you where the most trading has historically occurred — the POC (point of control, the highest-volume price), the value area (VAH/VAL, where ~70% of volume traded), and low-volume nodes (thin prices price tends to move through fast). These are magnets and shelves. The tape tells you what's happening at them right now.
The combination is potent: when price returns to a high-volume node like the POC, you expect a battle — lots of resting interest, likely absorption. When price enters a low-volume node, you expect speed and thin books — a place where walls are fake and sweeps run. So the profile tells you which behavior to anticipate, and the tape confirms whether it's playing out. Absorption at the VAL in an uptrend is a textbook long trigger; a climax into the POC from below is a textbook take-profit or fade.
With VWAP
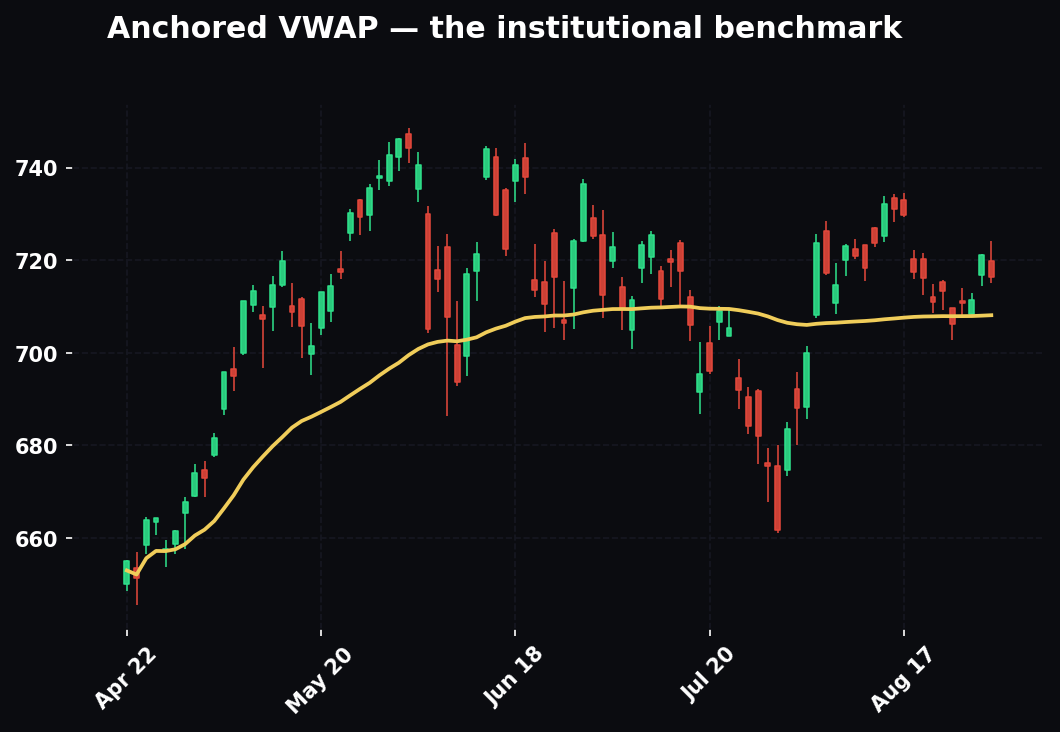
VWAP is the volume-weighted average price — the day's fair-value line and the level institutions benchmark their fills against. Price tends to revert to it and react at it. The tape sharpens VWAP two ways: first, a mean-reversion scalp back to VWAP after an exhaustion climax (Worked Example 3) is a high-probability play because institutions are leaning against extremes toward VWAP. Second, when price is testing VWAP from one side, absorption there tells you whether it holds as support/resistance or gives way. VWAP gives the level; the tape gives the verdict on whether it's being defended.
With the EMA 12/22/55 stack
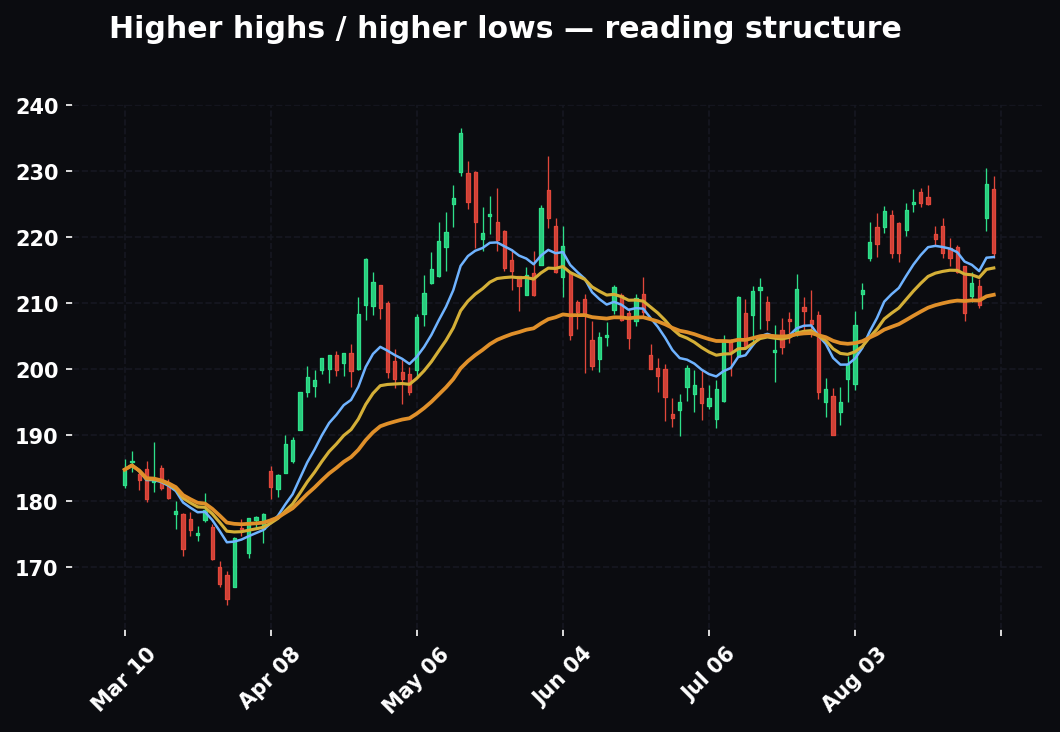
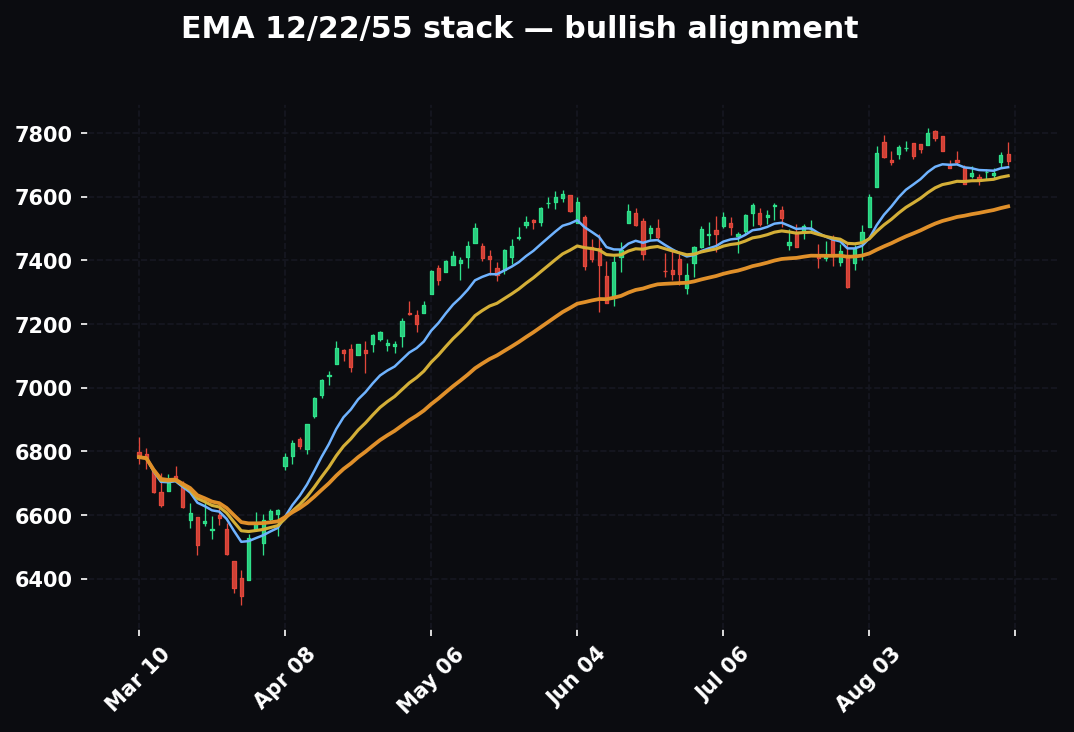
The EMA framework defines the trend and, crucially, the bias line — the 55. When price pulls back into the 12/22/55 stack in the direction of the trend, that's your zone. The tape's job is to confirm the defense of the stack: absorption on the bid as price tags the 22-EMA in an uptrend is the green light. If instead the tape shows the EMA level being swept and accepted (heavy aggression through it, size stacking on the far side), the stack is failing and you stand aside. The EMA hands you the zone and the bias; the tape tells you, in real time, whether the zone is holding or breaking — which is the difference between a great entry and a knife-catch.
The principle across all three: each tool narrows the location; the tape confirms the moment. Four things agreeing — daily bias down, price into the POC from below, tagging the 55-EMA, and the tape showing a selling climax with offers stacking — is a far higher-conviction short than any one of them alone. Confluence is not decoration; it's how you earn the right to size up.
How It Fits the Hollow Point Top-Down Process
At HPT the process is always the same shape: macro → sector → stock → timeframe-weighted confluence → execution. You start wide (what's the market regime, what's the sector doing), narrow to the name, stack your timeframes with the higher ones weighted heavier, and only then do you act. Trend is defined by the EMA 12/22/55 stack — price and the EMAs aligned up is a long environment, aligned down is a short environment, and the 55 is the line that defines the bias. Every trade wants 1:3 reward-to-risk minimum, and the whole philosophy is discipline over prediction — you don't guess the future, you wait for your rules to line up and then execute without flinching.
Where does the order book fit in that stack? Dead last, and only at the very end. Level 2 and the tape are the execution layer. They are the final gate between "my analysis says this is a spot" and "I'm clicking buy." Here's the honest hierarchy:
- Macro and sector set the bias. The tape has nothing to say about whether the Fed meets Wednesday or whether semis are leading the tape today. Don't even open Level 2 for this. If you can't state the macro and sector backdrop, you're not ready to look at the ladder.
- Higher timeframes and the EMA 12/22/55 stack define the trade and the direction. This is where you decide "long above the 55 into the 48.50 demand zone, target the prior high, stop under the zone — that's better than 1:3." The tape doesn't get a vote here either. A bullish tape in a bearish daily structure is a trap, not a signal.
- The level comes from confluence — EMA, volume profile POC/value area, VWAP, prior structure, session levels, round numbers. The chart hands you the price that matters, and ideally several tools hand you the same price.
- THEN the tape and book become the trigger. At that pre-chosen level, you watch for absorption to confirm the defense, or exhaustion to confirm the other side is done, or a sweep-and-reclaim to confirm the trap, and you use the book to place a tight, logical stop where the real order flow lives. This is how you turn a 1:2 chart trade into a 1:3+ execution — by entering at the precise flip instead of the mid-zone, your risk shrinks and your R/R expands.
The discipline rule is brutal and simple: the tape can only confirm or deny a trade your top-down process already sanctioned. It can never create one. The moment you find yourself going long because the tape looks strong — with no higher-timeframe reason — you've inverted the process and you're gambling on noise. In HPT terms, that's the opposite of "bound by rules." The order book is where discipline is won or lost, because it's the most seductive, fastest-moving screen you'll ever watch, and it will happily talk you into a hundred trades your plan never called for.
Used correctly, the tape is a timing and confidence tool that makes your rule-based entries sharper and your stops tighter, which is the entire mechanism by which good traders squeeze a 1:3 out of a setup that looked like 1:2 on the chart. Used incorrectly, it's a slot machine with a live feed.
The Honest Section: What Retail Level 2 Does and Doesn't Show
This is the part most "learn Level 2" content skips, and it's the part that will save you the most money. You have to know the limits of the tool or you'll trust it in exactly the situations where it lies most.
1. Your book is fragmented and possibly incomplete. There is no single "the order book." Every venue has its own. What you see depends on your data feed. A cheap or consolidated feed may show a partial, delayed, or netted picture — and a delayed book is worse than no book, because you'll react to size that's already gone. Even a full, real-time feed only shows the lit exchanges. Which brings us to:
2. A huge fraction of real volume never appears in the book. As covered earlier — roughly half of U.S. equity volume trades off-exchange (dark pools, internalizers, PFOF wholesalers). Those buyers and sellers are real, their size is real, and it is invisible to you until it prints on the tape after the fact. So the biggest players are frequently the ones you can't see in the ladder. When you conclude "there's no size on the offer, it'll run," you may be staring at an empty lit book while an institution quietly fills 200,000 shares in a dark pool. The absence of visible size is not the absence of size.
3. Icebergs and hidden orders mean displayed size is a floor, not a ceiling — or a lie. You already know this: the book can overstate (spoofs) and understate (icebergs) at the same time, on the same screen, in the same second. Displayed size is the least reliable number on your screen, and the more important a level is, the more likely its true size is hidden.
4. Speed. You are not fast. High-frequency trading firms see and react to the book in microseconds. By the time a spoof registers in your human eyes, the algo that placed it has already cancelled and repositioned. You will never win a speed game against the machines, so don't play one. Read the book for behavior and context over seconds and minutes, not for split-second reactions you can't execute anyway. Your edge is pattern and patience, not reflexes.
5. Level 2 is far more useful on some instruments than others. On thick, deep, heavily-fragmented large-cap equities, the retail book is often too noisy, too gamed, and too incomplete to lean on hard. Where the book is genuinely most readable is centralized, single-venue markets — futures, above all. Futures (like the NQ, ES, and other index and commodity contracts) trade on one exchange (CME for the majors), so the DOM you see is the whole book — no fragmentation, no dark pools siphoning half the flow, no PFOF internalization. That's why serious DOM/tape reading is dominated by futures traders. If you want the order book to actually mean what it appears to mean, a centralized futures market is where it's most honest. On fragmented equities, weight the tape (real prints) heavily and treat the displayed book with suspicion.
6. It rewards screen time, not shortcuts. Reading the tape is a feel skill built by watching one instrument until you know its normal rhythm — its typical print size, its usual pace, how its book behaves at the open versus midday, how it acts on news days. "Fast tape" and "big print" only mean something relative to that instrument's baseline. There is no universal setting, no magic size threshold, no indicator that replaces the hours. This is why tape readers specialize in one or two names or one contract, and why a great NQ reader can be lost on a thin biotech.
The mature stance: Level 2 and the tape are a lens, not a crystal ball. They add real edge at the execution layer, on the right instruments, in the right hands. They are not a signal generator, they are not complete, and on fragmented equities they show you a partial, gameable slice of a much larger hidden reality. Respect the limits and the tool is powerful. Ignore them and it's a very expensive way to feel informed while getting picked off by people with faster machines and a fuller picture than you'll ever have.
How the Pros Use It Differently From Beginners
The gap between a professional tape reader and a beginner isn't the software — they're often looking at the same screen. It's the frame. Here's where they diverge, point by point.
Beginners react to the book. Pros react to the tape. The novice sees a big offer and does something. The professional sees a big offer and waits to see if it trades, because they know displayed size is a claim, not a fact. The pro's default is patience; the beginner's default is reaction.
Beginners look for signals. Pros look for confirmation. A beginner opens Level 2 hoping it will tell them what to do. A professional arrives with a plan already built from the higher timeframes and uses the tape only to confirm the moment. The beginner asks the book "what should I trade?" The pro asks it "is my trade ready yet?" — completely different questions.
Beginners watch size. Pros watch the change in size and the aggression trajectory. A static snapshot means little. The pro tracks whether offers are stacking or pulling, whether prints are growing or shrinking, whether the aggressor is accelerating or fading. The information is in the derivative*, not the level.
Beginners trade every regime the same. Pros read the regime first. As covered above, the same tape means opposite things in trend, chop, and high-vol. Pros identify the environment before they interpret a single print; beginners apply range logic to a trend and trend logic to chop and lose in both.
Beginners fear walls and chase strength. Pros fade climaxes and buy absorption. The novice shorts into a big offer and buys the fast green tape — precisely backwards. The professional knows a wall in a trend usually pulls and a fast tape at an extreme is usually exhaustion, so they lean the other way: buying the absorption the crowd is selling, taking profit into the climax the crowd is chasing.
Beginners want more screen time to catch more trades. Pros use screen time to take fewer, better trades. The professional's hours on the tape are spent building the pattern recognition that lets them skip* the noise. More watching, fewer clicks. The beginner watches to justify more activity; the pro watches to justify more restraint.
Beginners think the book is the truth. Pros know the book is a story someone is telling them. The professional's baseline assumption is that a chunk of what they see is designed to manipulate their behavior, so they treat the ladder as an argument to be tested rather than a report to be believed. That single mental shift — from "this is what's happening" to "this is what someone wants me to think is happening" — is most of the edge.
Frequently Asked Questions
Do I even need Level 2 as a retail trader? Not to be profitable. Plenty of consistently profitable traders never open a DOM, especially swing traders on higher timeframes. Level 2 and the tape earn their keep specifically for intraday execution — timing entries and tightening stops on trades your chart already found. If you hold for days, the microscope adds little. If you scalp or day-trade futures, it can be a real edge. Decide based on your timeframe, not on hype.
Is Level 2 useless now that half the volume is dark? It's diminished on fragmented equities and fully intact on centralized futures. On equities, shift your weight from the book (intentions, incomplete) to the tape (real prints, including flagged off-exchange volume). On futures, the DOM is the whole book and remains genuinely readable. So the honest answer is: it depends heavily on what you trade.
Can I automate tape reading or use a footprint chart instead? Footprint / cluster charts (which show bid-vs-ask volume at each price inside each bar) are an excellent, more digestible cousin of raw tape reading, and many pros prefer them because they compress the firehose into something reviewable. Delta and cumulative-delta indicators quantify aggressor imbalance. They're legitimate tools — but they're built from the same underlying data and carry the same limits (fragmentation, hidden size). Use them as a supplement, not a shortcut past understanding the mechanism.
How do I tell a spoof from a real order in the moment? You can't, from the book alone — that's the whole point. You wait for the level to be tested and read the tape's answer: vanishes untraded = spoof/pull; holds or refills while being hammered = real/iceberg. If you're forced to guess before the test, don't trade it.
What's the single most useful thing to watch as a beginner? Aggression persistence at your pre-chosen level. Ignore everything else on the ladder. When price reaches the spot your chart flagged, watch one thing: which side is the persistent aggressor and is the level absorbing or breaking? That one read, at one price, is 90% of the practical value.
Does this work on crypto? The centralized-exchange logic applies (a single venue's book is complete for that venue), but crypto is spread across many exchanges with wildly varying liquidity, and spoofing is rampant and largely unpoliced. So treat a crypto book like a thin, heavily-gamed equity: weight the tape, deeply distrust displayed size.
How long until I can actually read a tape? Realistically, hundreds of hours on one instrument before the baseline lives in your gut. There's no compressing it, because the skill is the internalized baseline. Watch one contract, every session, until "that's unusual" becomes automatic.
The Common Mistakes
1. Trading the book instead of the tape. The book is intentions; the tape is reality. If you find yourself reacting to displayed size before it trades, you're reacting to claims, not facts. Wait for the print. This is the root error from which most of the others grow.
2. Treating size as truth. Big number ≠ big conviction. Spoofs, pulls, and icebergs mean the displayed size is the least trustworthy figure on your screen. Only size that trades — or that holds while being traded — counts. A number you haven't seen tested is a rumor.
3. Chasing the fast tape. A ripping tape feels like a signal to jump in. Usually by the time it's obvious to you, it's exhaustion in progress — you're buying the climax the smart money is selling into. Fast tape at an extreme is a fade or take-profit cue far more often than an entry.
4. Letting the tape override the top-down. The cardinal sin. A strong tape in the wrong higher-timeframe environment is a trap. The tape confirms; it never authorizes. No macro/sector/EMA reason, no trade — no matter how good the flow looks in the moment.
5. Overtrading because the screen is exciting. The order book updates hundreds of times a minute. That constant motion manufactures a feeling of opportunity that has nothing to do with actual setups. More screen action does not mean more trades. Discipline over stimulation — the ladder's job is to make you click less, not more.
6. Ignoring the instrument's baseline. Calling a print "big" or a tape "fast" without knowing that name's normal rhythm is meaningless. A 500-lot is enormous on one contract and trivial on another. Learn one instrument's baseline before you judge anything as unusual.
7. Forgetting the hidden half. Concluding "no sellers, it'll fly" off a thin lit book — while dark pools and internalizers move the real size invisibly. Absence of displayed size is not absence of size. The most important player is often the one you can't see.
8. Reacting to a delayed or partial feed. If your data is delayed even a second, or shows only a subset of venues, you're trading a photograph of a moment that's already gone. Know exactly what your feed shows and how fresh it is before you lean on it.
9. Fighting absorption instead of joining it. When a level clearly won't break despite heavy aggression, some traders keep pressing the losing side, convinced they're right and the market is wrong. Absorption is the market telling you a bigger player disagrees. Join the defender or step aside — don't argue with size that's proving itself in real time.
10. Using the tape for stops in high volatility. In thin, violent conditions a single sweep can blow through a "logical" stop by a wide margin. Leaning on tight tape-based stops during news is how you get repeatedly wicked out of trades that were ultimately right. Match your stop discipline to the regime.
11. Confusing a single block with a trend. One giant print — especially a dark-pool cross that reports after the fact — tells you almost nothing directional. Beginners see a big red block and panic-short. Wait for a series on the same side at the same level before treating it as a footprint.
12. Never defining invalidation before entering. The tape's greatest gift is showing you exactly where the real orders sit, which is exactly where your stop belongs. Entering off a tape read without pre-defining the price that proves you wrong throws away the tool's best feature and turns a disciplined entry into a hopeful one.
Cheat-Sheet: The Ladder and the Tape at a Glance
The two screens
- Level 2 / DOM = resting limit orders (intentions). Can lie. Shows the passive, patient side.
- Time-and-Sales / tape = executed trades (reality). Can't lie. Shows the aggressive, urgent side.
- Market orders are invisible on the book until they print on the tape. Stops are invisible until they fire.
Core vocabulary
- Bid = highest price buyers advertise. Ask/offer = lowest price sellers advertise. Spread = the gap between them (and a live read on liquidity).
- Aggressive/taker = crossed the spread for an immediate fill (prints at ask if buying, bid if selling).
- Passive/maker = rested in the book and got hit.
- Green print = buyer lifted the ask (bullish urgency). Red print = seller hit the bid (bearish urgency). Watch the size trajectory, not just the color.
Reading size (the polygraph test)
- Size vanishes before it's traded → spoof/pull. Fake. Price often goes toward where the wall was.
- Size holds/refills while being hammered → iceberg/absorption. Real. Big money defending.
- One giant print = block (often ambiguous, esp. dark-pool crosses). A series on one side at one level = a footprint. Respect the series, not the single.
The three outcomes at any level
- Aggression in, price holds, size refills → absorption → trade with the defender, stop just past them.
- Aggression peaks then dies at the extreme → exhaustion → fade or take profit, don't chase.
- Aggression breaks clean, far side pulling → acceptance/breakout → trade the break, not the bounce.
Regime overlay
- Trend: persistent aggressor; walls ahead usually pull; buy absorption on pullbacks.
- Chop: symmetrical, non-persistent flow; respect only the range extremes; refuse the middle.
- High-vol: thin book, violent bursts; least reliable; size down or stand aside.
The HPT placement (non-negotiable order)
- Macro + sector → bias.
- Higher timeframes + EMA 12/22/55 → the trade and direction (55 = the bias line).
- Confluence (EMA, VWAP, volume profile POC/value area, structure) → the level.
- Tape + book → the trigger and the stop, at that pre-chosen level only.
- Tape confirms or denies. It never creates a trade. Aim to sharpen a chart trade into 1:3+ R/R by entering at the exact flip.
The honesty rules
- Your book is fragmented and incomplete. ~Half of equity volume trades off-exchange (dark pools/PFOF) — invisible until it prints.
- Displayed size can overstate (spoof) and understate (iceberg) at once — least reliable number on screen.
- You can't out-speed HFT. Read behavior over seconds/minutes, not microseconds.
- Most honest book = centralized markets (futures on one exchange). Fragmented equities = weight the tape, suspect the book.
- It's a feel skill. Learn one instrument's baseline. Screen time, not shortcuts.
When in doubt: the chart gives the level, the tape gives the timing. If you can't name the top-down reason you're at this level, close the ladder and walk away.
Level 2 and the tape are the most intimate view retail ever gets of the auction — and the most easily abused. Handled with respect, they turn a good chart level into a surgical entry with a stop where the real orders live and an R/R your plan can love. Handled without discipline, they're a firehose of feints that will drown a good process in noise. The book bluffs. The tape doesn't. Your job is to know which one you're looking at, to read the regime before you read the print, to let your higher timeframes frame every trade the tape only triggers — and to never, ever let either screen talk you out of your rules.
Bound by rules, feared by trade.