
Start Here: What This Guide Gives You
Imagine you're standing at the edge of a river. Before you throw anything in — a stick, a toy boat, a message in a bottle — you'd want to know one simple thing first: which way is the water flowing? Once you know that, everything gets easier. Throw your boat in going with the current, and it glides. Throw it in against the current, and you fight the whole way.
Trading is exactly the same. Before you buy or sell anything, before you look at a single fancy indicator, before you read a headline, there's one question that comes first: which way is price flowing right now? That flow has a name. We call it the trend.
This guide teaches you how to read the trend from scratch — no experience needed. By the time you finish, you'll be able to open any price chart, look at it for thirty seconds, and say out loud, "This is going up," "This is going down," or "This is going sideways." That single skill is the foundation everything else in trading is built on top of. Get this right, and the rest of your education has somewhere solid to stand.
What Is a Trend? (Plain English)
A trend is simply the general direction that price is moving over time. That's it. Not the wiggle from one minute to the next — the overall lean of the whole picture.
Here's the thing that trips up every beginner: price never moves in a straight line. Ever. It doesn't go up smoothly like an elevator. It moves more like a person walking up a staircase while playing with a yo-yo — up a bit, down a bit, up a bit more, down a bit — but if you step back and look, they're clearly climbing. The yo-yo is the noise. The staircase is the trend.
Let me give you the three flavors of trend, because there are only three, and you'll be using these words for the rest of your trading life:
- Uptrend — price is generally moving up over time. Higher over the weeks, higher over the days. Buyers are in control.
- Downtrend — price is generally moving down over time. Lower and lower. Sellers are in control.
- Sideways (also called a "range" or "consolidation") — price is going nowhere in particular, bouncing between a rough ceiling and a rough floor. Nobody's in control. It's a tug-of-war with no winner yet.
That's the entire universe. Up, down, or sideways. Every chart you will ever look at is doing one of those three things on any given timeframe.
Why a Beginner Should Care (This Is the Whole Game)
There's an old saying in markets, probably the most repeated phrase in all of trading: "The trend is your friend." Beginners hear it, nod, and then completely ignore it — usually right up until it costs them money.
Here's why it matters so much. When you trade with the trend, the overall flow of the market is helping you. Even if your timing is a little off, the current is still carrying your boat in the right direction. When you trade against the trend, you need to be nearly perfect, because the whole market is pushing back against you. You're swimming upstream.
Think about which is the easier way to make money: with the crowd's momentum behind you, or fighting it? A beginner who does nothing but learn to identify a trend and trade in that same direction is already ahead of a huge number of people who never bother.
And here's the part nobody tells new traders: you do not need to predict the future to make money. You just need to notice what is already happening and go along with it. The trend is happening right now, in front of your eyes. You don't have to be a fortune teller. You have to be a good observer. That's a much easier job, and it's one you can actually get good at.
At Hollow Point Trading, we have a phrase for this mindset: discipline over prediction. The trend rewards the patient observer, not the confident guesser. Reading the trend is where that discipline starts.
The Building Blocks: Highs, Lows, and Swings
To read a trend properly, you need to understand four small words. Learn these four and you're 80% of the way there. They are: higher high, higher low, lower high, lower low. Let's build them up slowly, because everything depends on it.
First, understand what a swing is. As price moves, it creates little peaks and little valleys — like a mountain range drawn on the chart. A peak is a point where price rose, then turned around and fell. A valley is a point where price fell, then turned around and rose.
- A swing high is one of those peaks. The highest point before price turned back down.
- A swing low is one of those valleys. The lowest point before price turned back up.
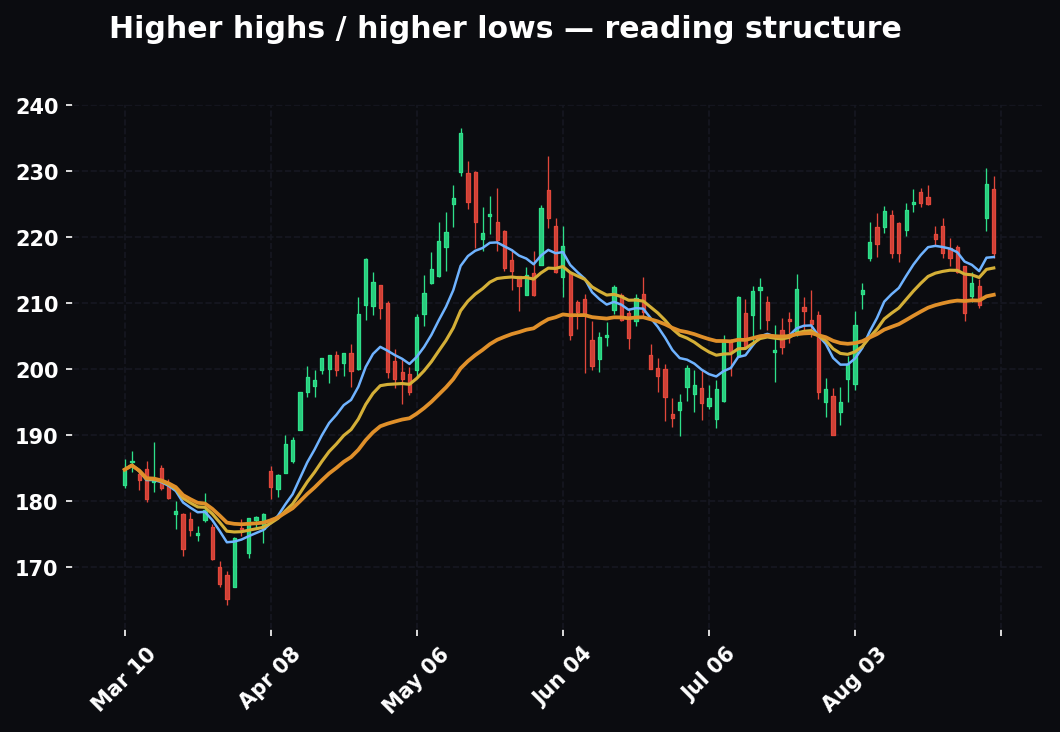
Now here's where the magic happens. We compare each new peak to the peak before it, and each new valley to the valley before it. That comparison tells us the trend.
- A higher high (HH) — the new peak is taller than the last peak.
- A higher low (HL) — the new valley is higher up than the last valley.
- A lower high (LH) — the new peak is shorter than the last peak.
- A lower low (LL) — the new valley is deeper than the last valley.
Read those four again slowly. They're just comparisons. Is this peak taller or shorter than the last one? Is this valley higher or lower than the last one? A child can do this comparison. You are looking for a pattern, and the pattern is the trend.
Here's the rule, and it's the single most important sentence in this entire guide:
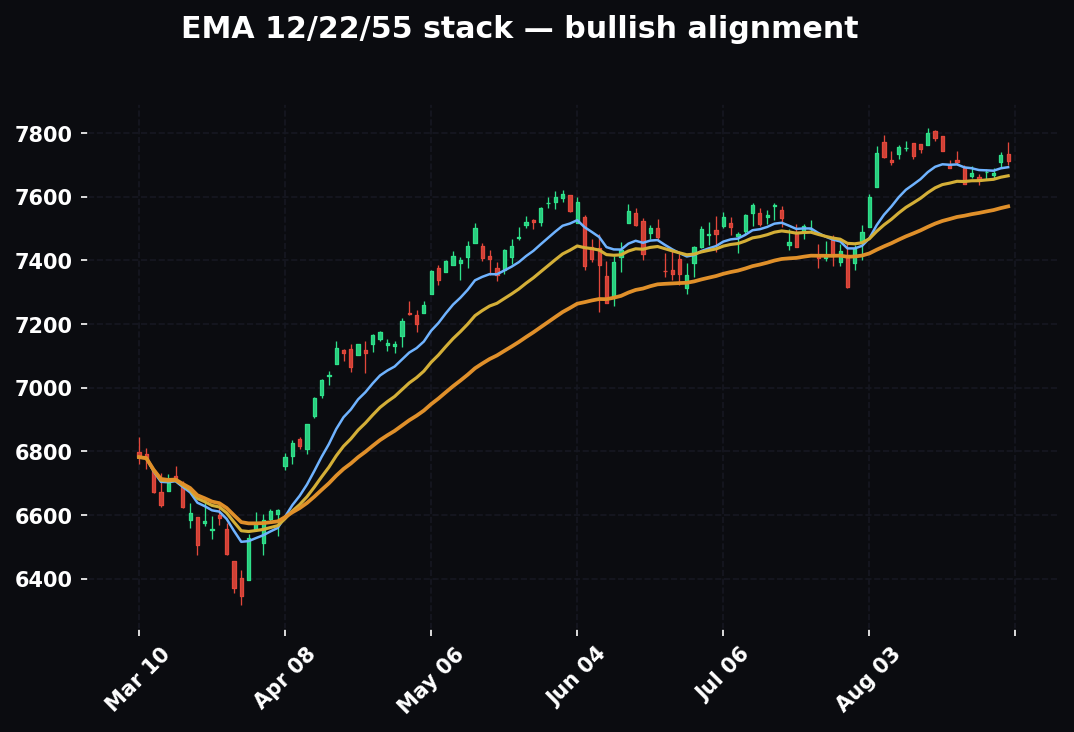
An uptrend is a series of higher highs AND higher lows. A downtrend is a series of lower highs AND lower lows.
That's it. That's the whole definition of trend, written in plain math. Let me show you why it works.
Why Higher Highs and Higher Lows Mean "Up"
Let's think about what's actually happening when price makes a higher high and a higher low.
A higher low means: when sellers pushed price down this time, they couldn't push it as low as last time. Buyers stepped in earlier and more eagerly. The floor is rising. Then a higher high means: when buyers pushed price up, they pushed it even further than before. The ceiling is rising too.
Put those together and you have a story: buyers are getting stronger, sellers are getting weaker, and the whole staircase is climbing. That is an uptrend, and now you understand why it's an uptrend — not because someone told you, but because you can read the intention behind the moves.
The exact opposite is a downtrend. A lower high means buyers couldn't push price as high as before — they're getting tired. A lower low means sellers drove price even deeper than before — they're getting stronger. The staircase is descending. Sellers are winning.
And when you get a mix — a higher high but then a lower low, no clean pattern, peaks and valleys all over the place with no clear rise or fall — that's your sideways market. The two sides are evenly matched. There's no friend to follow yet, so there's often no trade worth taking.
How to Tell the Trend, Step by Step
Let's turn all of this into a simple procedure you can run on any chart. Follow these steps in order and you will never be confused about direction again.
Step 1 — Pick your timeframe and zoom out. A chart can be set to show one candle per minute, per hour, per day, and so on. (A "candle" is just the little bar that shows the price movement for one chunk of time — we'll keep it simple; think of each candle as one "step" on the staircase.) Before you judge a trend, zoom out so you can see the bigger picture, not just the last few wiggles. Beginners lose the trend constantly because they're staring at a magnified corner of it. Step back first.
Step 2 — Find the obvious peaks and valleys. Don't overthink this. Look for the clear, prominent peaks and the clear, prominent valleys. Ignore the tiny jitters. If you squint slightly, the noise blurs and only the real swings stay visible. That squint is a real technique — use it.
Step 3 — Mark the most recent two peaks and two valleys. You only need a handful of points to read direction. Find the last two swing highs and the last two swing lows.
Step 4 — Compare them. Is the newer peak higher or lower than the older peak? Is the newer valley higher or lower than the older valley?
Step 5 — Read the verdict:
- Higher peaks and higher valleys → uptrend → your friend points up.
- Lower peaks and lower valleys → downtrend → your friend points down.
- Mixed, or price stuck between a flat ceiling and floor → sideways → no friend yet, stand aside.
That's the whole method. Five steps, thirty seconds, any chart on earth.
The Trend Line: Drawing the Friend
There's a simple tool that makes the trend jump off the page: the trend line. It's exactly what it sounds like — a straight line you draw along the trend to make its direction obvious.
Here's how, and it's beautifully simple:
- In an uptrend, you draw a line connecting the valleys — the higher lows. Because the lows are rising, this line slopes up. It acts like a rising floor that price keeps bouncing off of.
- In a downtrend, you draw a line connecting the peaks — the lower highs. Because the highs are falling, this line slopes down. It acts like a falling ceiling that keeps knocking price back.
You need at least two points to draw any line, but a trend line gets more trustworthy every time price touches it and respects it. A line touched three or four times is telling you something real: this floor (or ceiling) matters, and a lot of people are watching it.
Why is this useful? Because that line gives you two things a beginner desperately needs. First, it gives you a clean picture of direction — no squinting required. Second, it gives you a line in the sand. As long as price stays above a rising trend line, the uptrend is intact and your friend is still walking with you. The moment price clearly breaks below it, something has changed and you need to pay attention. We'll use that "line in the sand" idea again in a minute, because it's how you protect your money.
A Fully Worked Beginner Example
Let's walk through a complete, realistic example with real-ish numbers so you can see the whole thing click into place. We'll invent a stock and call it BlueRiver Corp, trading under the ticker "BRVR." (A "ticker" is just the short code that identifies something you can trade.) We'll look at its daily chart — one candle per day.
Here's what BRVR did over several weeks. I'll walk the price through its swings:
- It rose to $50, then pulled back down to $46. (First peak: $50. First valley: $46.)
- It rose again, this time to $54, then pulled back to $49. (Second peak: $54. Second valley: $49.)
- It rose once more to $59, then pulled back to $53. (Third peak: $59. Third valley: $53.)
Now let's read it like an analyst. Line up the peaks: $50, then $54, then $59. Each peak is taller than the last. Higher highs. Now line up the valleys: $46, then $49, then $53. Each valley is higher than the last. Higher lows.
Higher highs and higher lows. This is a textbook uptrend. The trend is your friend, and your friend is pointing up. We would draw a rising trend line under $46, $49, and $53 — that upward-sloping floor.
Now, suppose BRVR pulls back again and this time it stops around $55 — still above the last valley of $53 — and turns back up. That's another higher low forming. The uptrend is healthy. If price then pushes above $59 to a new higher high, the staircase takes another step up and the story continues. This is what a beginner wants to see: the pattern repeating. When you trade with a trend, repetition is your income.
Now let's watch how a beginner would use this. You'd want to buy on the pullbacks, in the direction of the trend — that is, buy near the rising floor when price dips toward the trend line, not chase it at the top of a spike. Say price pulls back toward $55, near your rising trend line. That's a spot where buyers have repeatedly shown up. You buy there.
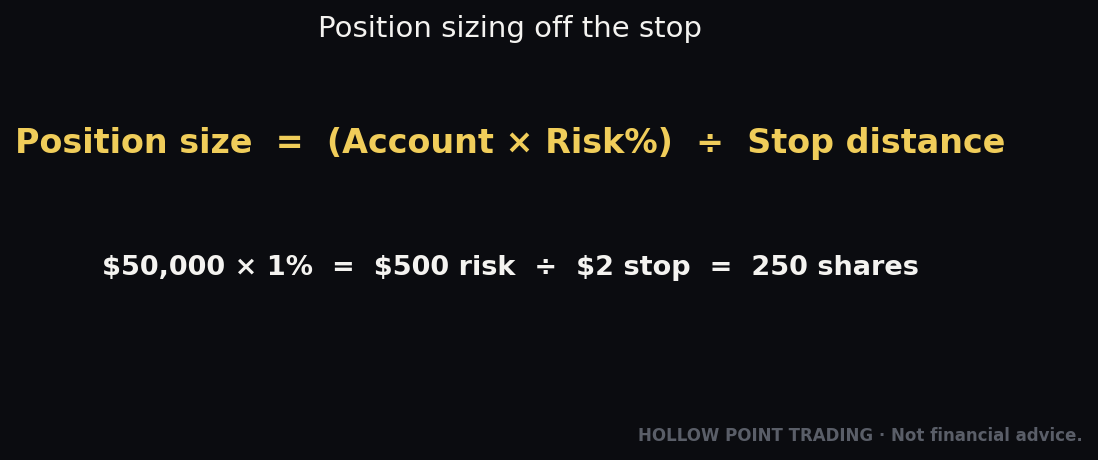
But — and this is the discipline part — you decide before you buy where you'll admit you're wrong. The last higher low was $53. If price falls below $53, the pattern of higher lows is broken, and your reason for buying is gone. So you set your stop (an automatic exit that caps your loss) just below $53, say at $52.50. Your risk is $55 minus $52.50 = $2.50 per share.
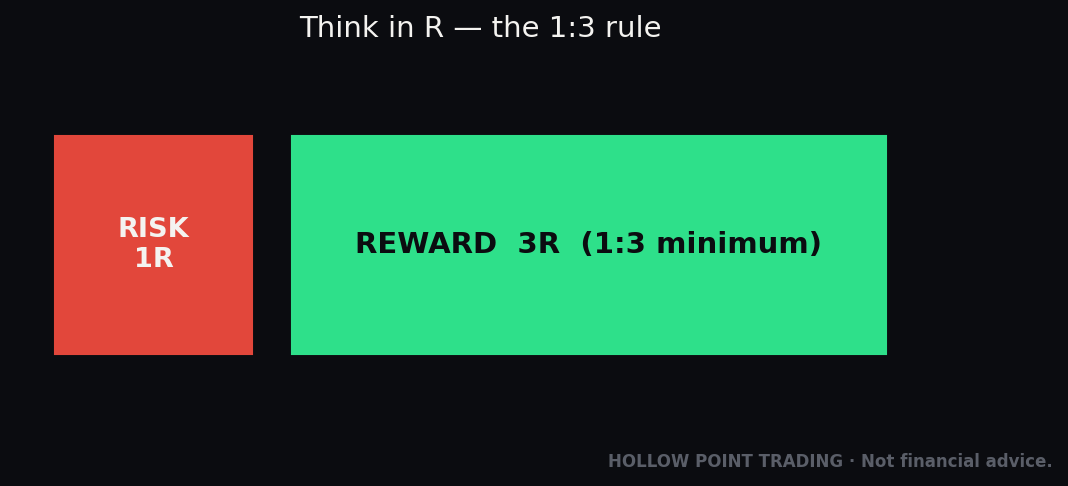
Now you set your target using Hollow Point Trading's core rule: 1:3 reward-to-risk. You're risking $2.50, so you want to make at least three times that — $7.50. Your target is $55 + $7.50 = $62.50, comfortably above the last high, right in line with the uptrend continuing. If it works, you make $7.50. If you're wrong, you lose $2.50. You can be wrong more than half the time and still come out ahead, because your wins are three times the size of your losses. That is the entire reason we obsess over trading with the trend and over reward-to-risk: it lets you be imperfect and still profitable.
Now the flip side. Imagine instead BRVR breaks that pattern. It falls to $51 — below the $53 valley. Then it bounces only to $56 (a lower high than $59), and then sinks to $48 (a lower low). Read it: lower high, lower low. The friend has turned around. The uptrend is over and a downtrend may be starting. A disciplined trader is already out — the stop at $52.50 took them out cleanly on the way down, protecting their capital. That's not a failure. That's the system working. Protecting your money on the trades that don't work is exactly how you survive long enough to catch the ones that do.
The "Trend Is Your Friend" — But Which Friend?
Here's something that confuses almost every beginner, and once you get it, you'll feel like you've been let in on a secret: a chart can be in an uptrend and a downtrend at the same time. How? Because it depends on the timeframe you're looking at.
A stock might be marching up over months on the daily chart, while this afternoon it's pulling back and making lower highs on the 5-minute chart. Both are true. They're just different-sized staircases. The big staircase climbs; one of its steps happens to dip down close-up.
This is why professionals talk about the higher timeframe trend as the boss. The bigger the timeframe, the more powerful and reliable the trend. A trend on the weekly chart is a stronger friend than a trend on the 1-minute chart, because it represents the settled opinion of far more people over far more time.
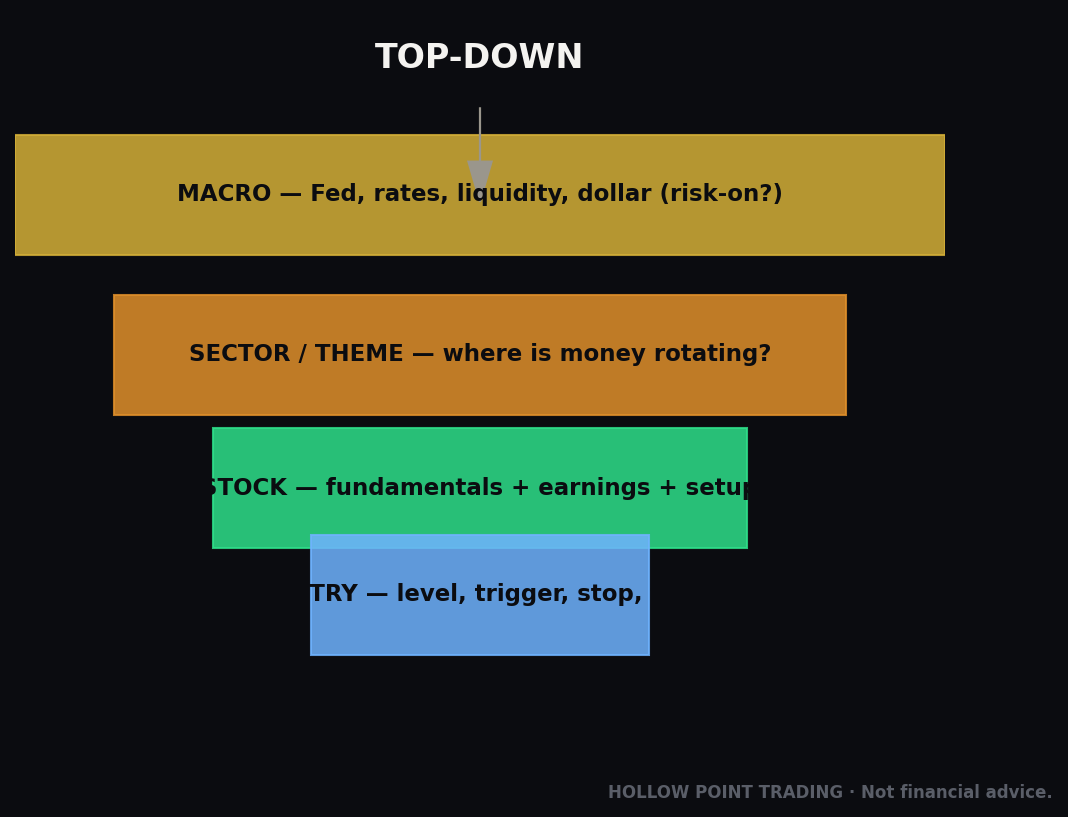
The beginner rule that keeps you out of trouble: find the trend on a bigger timeframe first, then trade in that same direction on a smaller one. If the daily chart is a clean uptrend, you look to buy pullbacks on the hourly chart — you don't go looking for shorts just because the last twenty minutes dipped. You let the big friend lead. This is the same logic behind Hollow Point Trading's macro → sector → stock approach: you start with the biggest picture (the overall market and economy), narrow to the sector, then the individual stock. Big trend first, small trend second. Never the tail wagging the dog.
The Beginner Mistakes to Avoid
Let me save you months of pain. These are the exact mistakes new traders make with trends, over and over. Read them twice.
Mistake 1 — Fighting the trend because it "has to turn around." Price is falling, it feels too cheap, so you buy, expecting a bounce. This is called trying to "catch a falling knife," and it earns that name honestly. A downtrend can keep going far longer than feels reasonable. Never buy into a downtrend just because it looks cheap. Wait for the pattern to actually change — for the lower lows to stop.
Mistake 2 — Zooming in too far and mistaking noise for trend. A tiny 30-second wiggle is not a trend. If you're making decisions off the last three candles, you're reacting to yo-yo noise, not the staircase. Zoom out. Always zoom out.
Mistake 3 — Calling a trend off a single swing. One higher high does not make an uptrend. You want to see the pattern repeat — at least two higher highs and two higher lows — before you trust it. One data point is a coincidence; a pattern is a trend.
Mistake 4 — Chasing the top of a move. Price rockets up, you get excited, you buy at the very peak of the spike — and it immediately pulls back to a higher low, right where you should have bought. Buy the calm pullbacks toward the trend line, not the loud spikes away from it. The best entries feel a little boring.
Mistake 5 — Ignoring where you're wrong. If you buy without deciding, in advance, the price that proves the trend is broken (and where your stop goes), you have no plan — you have a hope. Hope is not a strategy. Every trade needs a line in the sand before you enter.
Mistake 6 — Trading a sideways market like it's trending. When price is bouncing in a flat range with no higher highs and no lower lows, there's no friend to follow. Beginners force trades here and get chopped up. Sometimes the correct move is to sit on your hands. "No trade" is a position, and often the smartest one.
Mistake 7 — Trend line drawn to fit your wish. It's tempting to draw the line where you want the trend to be. Draw it honestly, touching the real swing points. The chart doesn't care what you're hoping for.
How Do I Know the Trend Has Ended?
You don't need to guess the exact top or bottom — trying to is another beginner trap. You just need to notice when the pattern breaks. Here's the plain-English tell:
- An uptrend is in trouble when price makes a lower low — when it falls below the previous valley. That's the first crack. The rising staircase just took a step down it shouldn't have.
- A downtrend is in trouble when price makes a higher high — when it rises above the previous peak. The falling staircase just took a step up.
A broken trend line points to the same thing: when price decisively closes on the wrong side of your line in the sand, the friendship may be ending. Notice the word decisively — a tiny poke through the line that immediately snaps back is often just noise. You're looking for a clear, convincing break, not a nervous flicker.
When a trend breaks, you don't have to instantly flip and bet the other way. The safest beginner move is simpler: stop trading in the old direction. If your uptrend just made a lower low, stop buying. Wait. Let the chart show you a new, clear pattern before you commit again. Patience between trades is where discipline lives.
Your Trend Cheat-Sheet
Print this. Tape it next to your screen. This is everything above, boiled down to what you'll actually use Monday morning.
The four building blocks:
- Higher High (HH) = new peak taller than the last peak
- Higher Low (HL) = new valley higher than the last valley
- Lower High (LH) = new peak shorter than the last peak
- Lower Low (LL) = new valley lower than the last valley
The verdict:
- HH + HL = UPTREND → look to buy pullbacks
- LH + LL = DOWNTREND → look to sell / stand aside
- Mixed / flat = SIDEWAYS → no trade, wait
The 30-second routine:
- Zoom out.
- Find the last two peaks and last two valleys.
- Compare them (taller/shorter, higher/lower).
- Name the trend out loud.
- Draw the trend line — under the valleys (up) or over the peaks (down).
The trading rules:
- Trade with the trend, not against it.
- Find the trend on the bigger timeframe first.
- Buy the calm pullbacks, not the loud spikes.
- Decide your stop (line in the sand) before you enter.
- Aim to make 3x what you risk (1:3 reward-to-risk).
- Trend broken? Stop trading the old direction. Wait for a new pattern.
The trend is over when: an uptrend makes a lower low, or a downtrend makes a higher high, or price decisively breaks the trend line.
How Trend Fits the Bigger Hollow Point Picture
Everything you'll ever learn in trading stacks on top of this one skill. Support and resistance, moving averages, momentum indicators, chart patterns, options positioning — all of it is more useful when you already know which way the river flows. An indicator that says "buy" means something completely different in an uptrend than in a downtrend. The trend is the context that gives every other signal its meaning.
At Hollow Point Trading, the trend is the first filter, not the last. We work top-down: macro → sector → stock. First, which way is the overall market trending? Then, which sectors are trending with it? Then, and only then, which individual stock offers a clean trend to trade in that same direction? By the time we get to a single ticker, we're stacking trends on top of trends — the market's friend, the sector's friend, and the stock's friend all pointing the same way. That alignment is what we call confluence, and it's far more powerful than any one chart alone.
And notice what the trend does not ask of you: it never asks you to predict the future. It asks you to observe the present honestly and respond with discipline. That's the whole Hollow Point ethos in a sentence. Protect your capital first. Trade with the flow, cap your loss with a stop, size your reward to three times your risk, and let the trend — your friend — do the heavy lifting. You don't need to be right about tomorrow. You need to be honest about today and disciplined about your exits.
Master the trend, and you've built the floor the whole house stands on. Everything else we teach you gets easier from here.
Bound by rules, feared by trade.