
You have probably seen a stock chart and thought it looked like random scribble. A jagged line going up, down, sideways, with no rhyme or reason. It feels like chaos. It feels like gambling.
It is not random. Price moves between invisible floors and ceilings, and once you learn to see them, the scribble turns into a map. Those floors and ceilings have a name: support and resistance. They are the single most useful idea a brand-new trader can learn, because they answer the two questions that actually matter with real money on the line: Where is price likely to stop? and Where is it likely to turn?
This guide assumes you have never placed a trade in your life. We will define every word the first time it shows up. We will walk through real-ish numbers, slowly, more than once. And by the end you will be able to open a chart on Monday morning and mark the levels that matter yourself.
Let's build the map.
What Support and Resistance Actually Are (Plain English)
Imagine bouncing a rubber ball inside a room. It falls, hits the floor, and bounces back up. It flies up, hits the ceiling, and comes back down. The ball doesn't pass through the floor or the ceiling — those surfaces stop it and push it the other way.
A price chart works the same way.
- Support is the floor. It is a price level where falling prices tend to stop falling and bounce back up. Buyers show up here. Think of it as the price where enough people say, "That's cheap, I'll buy," and their buying halts the drop.
- Resistance is the ceiling. It is a price level where rising prices tend to stop rising and turn back down. Sellers show up here. Think of it as the price where enough people say, "That's expensive enough, I'll sell," and their selling caps the climb.
That is the whole idea in one breath: support = floor where buyers step in; resistance = ceiling where sellers step in.
Before we go further, a couple of plain definitions so nothing trips you up:
- A chart is just a picture of price over time. The up-and-down axis (vertical) is the price in dollars. The left-to-right axis (horizontal) is time. Older is on the left, newer on the right.
- A level is simply a specific price — a horizontal line drawn straight across the chart at, say, $100. Support and resistance are levels. That's why traders draw them as flat horizontal lines.
So when a trader says "there's support at $50," they mean: down around the $50 price, the stock has stopped falling before and probably will again. When they say "resistance at $58," they mean: up around $58, the stock has stopped rising before and probably will again. Price is the ball, bouncing between the two.
Why Levels Exist in the First Place
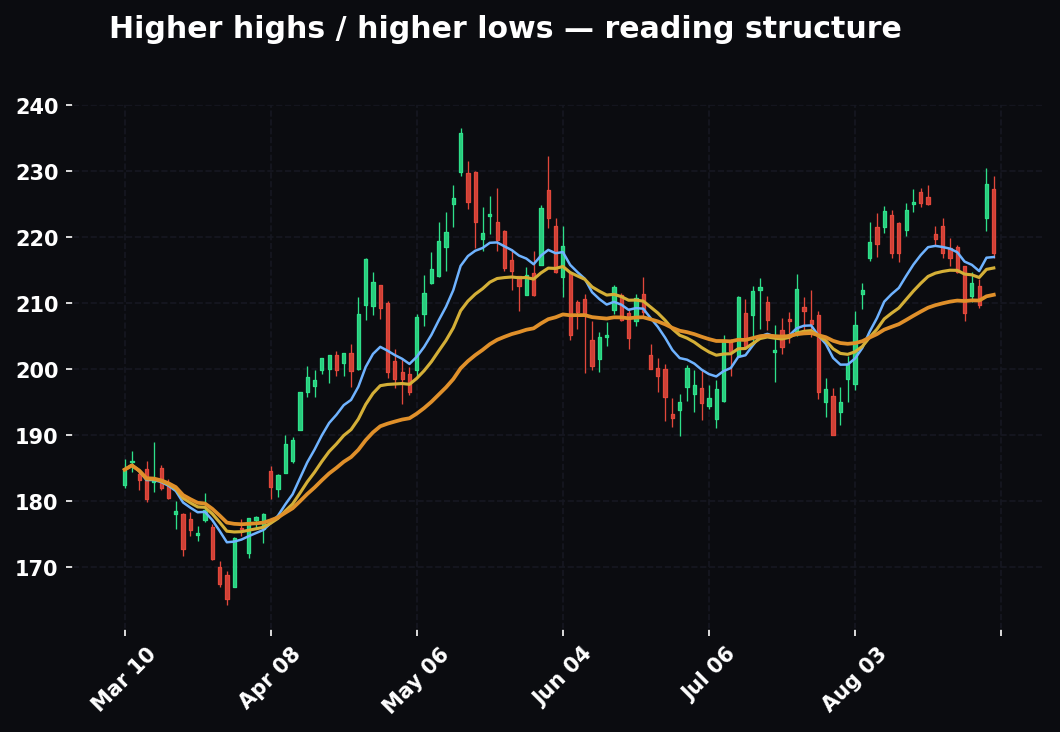
Here is the part most beginners skip, and it is the part that makes everything else click. Support and resistance are not magic lines. They exist because of human behavior and memory. Three simple forces create them.
1. Memory of pain and profit. Suppose a stock rose to $60, then crashed down to $45. Everyone who bought near $60 is now sitting on a loss — they're "underwater." They feel that pain every day. Many of them promise themselves: "If it just gets back to $60, I'll sell and get my money back." So when price climbs back toward $60, a wave of those relieved sellers dumps their shares. All that selling caps the price. That is why $60 becomes resistance — it's where a crowd of trapped buyers is waiting to escape.
2. Bargain hunting. Now flip it. Say a stock bounced off $45 three separate times. Traders remember that. They think, "Every time it hits $45, it goes back up — I'll buy there." So the next time price falls to $45, buyers rush in because they remember the last bounce. Their buying creates the very bounce they expected. The level works partly because people believe it works. This is a self-fulfilling prophecy, and it's real.
3. Round numbers. Humans love round numbers. $100, $50, $200, $1.00. Big institutions place orders at these psychological marks — "sell if it hits $100" — simply because they're clean and easy. That clustering of orders turns round numbers into natural floors and ceilings all by itself.
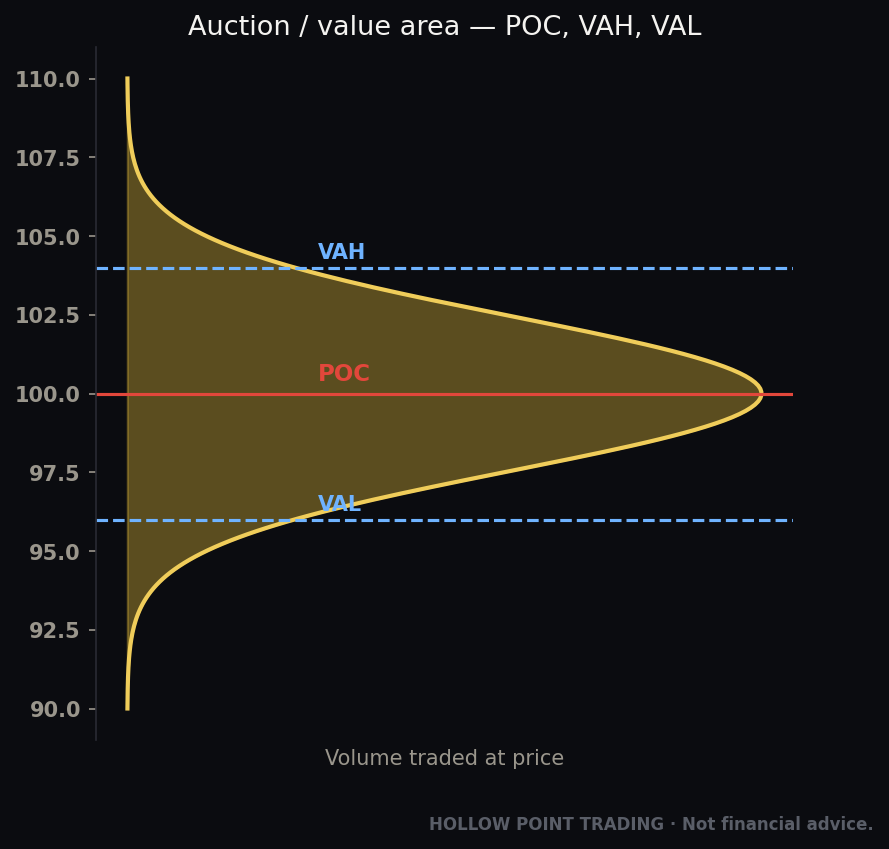
So a level is really just a price where a lot of people have decided, in advance, to do something — buy or sell. The more people who remember a price and act on it, the stronger the floor or ceiling. You are not reading tea leaves. You are reading a crowd's memory.
Why a Beginner Should Care (This Is the Whole Point)
You might be thinking, "Fine, floors and ceilings, cute. Why does this matter for me?"
Because support and resistance give you the two things a beginner desperately needs and almost never has: a plan and a boundary.
Without levels, trading is pure guessing. You buy because it "feels" like it's going up, you sell because you got scared, and you have no idea when you were wrong. That's not trading, that's flipping a coin while paying fees.
With levels, everything gets concrete:
- You know where to consider getting in (near a floor, if you expect a bounce).
- You know where the idea is proven wrong (if price slices straight through the floor, you were mistaken — get out).
- You know where price might travel to (the next ceiling above).
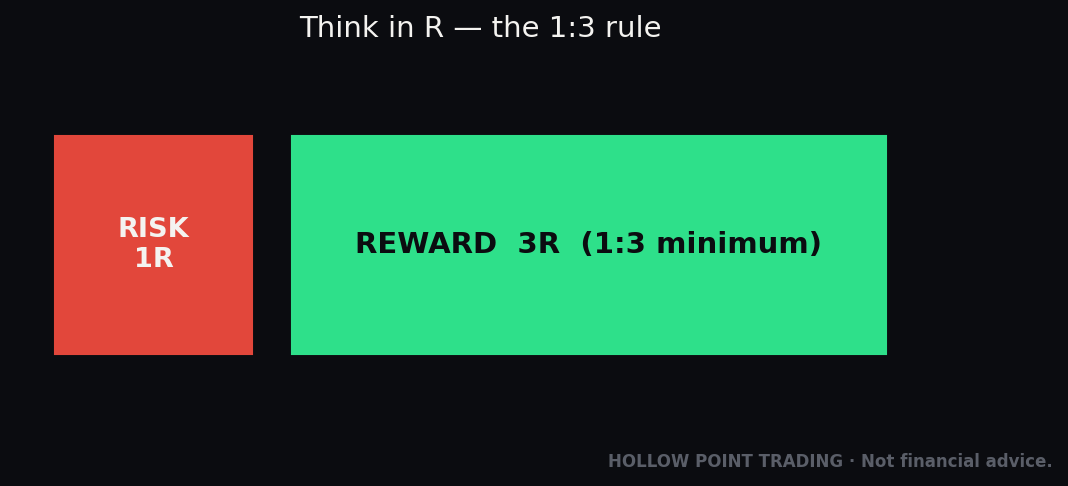
That third point is the seed of the most important rule at Hollow Point Trading: risk a little to make a lot. We aim for at least a 1:3 reward-to-risk ratio — meaning for every $1 we're willing to lose if we're wrong, we want the chance to make $3 if we're right. You literally cannot calculate that ratio without knowing your levels. Support and resistance are what make the math possible. We'll do that math together in a bit.
Protecting your money comes first, always. Levels are the tool that lets you protect it, because they tell you exactly where to admit you're wrong before a small loss becomes a big one.
How It Works, Step by Step
Let's turn theory into something you can actually do. Here is how support and resistance behave in the wild, in the order you'll encounter it.
Step 1: Price approaches a level
Say a stock has been climbing all morning and is now nearing $58 — a price where it got rejected twice last week. As a trader you're not surprised; you already drew a line at $58 and labeled it resistance. You expected price to reach a decision point here.
Step 2: Price reacts
One of two things happens at the level. Either price respects it or price breaks it.
- Respects (bounces): Price touches $58, sellers pile in, and it turns back down. The ceiling held. This is the more common outcome, and it's the one beginners should focus on first.
- Breaks (breaks through): Price pushes through $58 and keeps going, to $59, $60. The ceiling failed. When a level breaks, it usually breaks for a reason — a burst of buying strong enough to overwhelm all those sellers.
Step 3: You read the reaction — you don't predict it
This is the single most important sentence in this entire guide, so read it twice:
You do not bet on what price will do. You wait to see what it does at the level, then act on the reaction.
Beginners lose money by predicting: "It'll definitely bounce at $50, I'll buy now on the way down." Sometimes it bounces. Sometimes it plows straight through and they're down 8% in an hour. Prediction is guessing dressed up in confidence.
The professional move is reaction. You wait at the level. If price actually shows you a bounce — it slows, stalls, and turns up — then you act. You let the market prove your idea before you risk a dollar. It's the difference between catching a falling knife and picking it up after it's landed on the floor.
Step 4: You know your invalidation
Invalidation is a fancy word for "the price that proves me wrong." If you bought expecting support at $50 to hold, and price closes clearly below $50 — say $48.50 — the floor is gone. Your reason for the trade no longer exists. You get out. No hoping, no "it'll come back." The level broke; the idea's dead. This is where you place your stop-loss — an order that automatically sells you out at a set price to cap your loss. We'll define that more fully soon.
The Flip: When Support Becomes Resistance (and Vice Versa)
Here is the concept that makes people feel like they finally get charts. It's called the flip or role reversal, and it sounds strange until you see why it's obvious.
A broken floor becomes a ceiling. A broken ceiling becomes a floor.
Let's walk it slowly, because this is where the money is.
Picture $50 acting as support — the floor. Price bounced off it a few times. Then one day sellers overwhelm it, and price breaks down through $50, falling to $46. That floor is now broken.
Now here's the human part. Think about everyone who bought at $50 on the way down, expecting the usual bounce. They're now trapped, underwater, holding losses at $46. What do they want? To get back to $50 and break even. So the next time price rallies back up toward $50, that whole crowd sells to escape. Their selling stops the rally right at $50 — the exact level that used to be a floor. The old support is now resistance. The floor became a ceiling.
It works the other way too. Say $58 was resistance — a ceiling. Price finally breaks up through it to $62. Everyone who wanted to buy but was scared now thinks, "It broke out, I missed it, I'll buy on any dip back to $58." So when price pulls back to $58, buyers rush in and it bounces. The old resistance is now support. The ceiling became a floor.
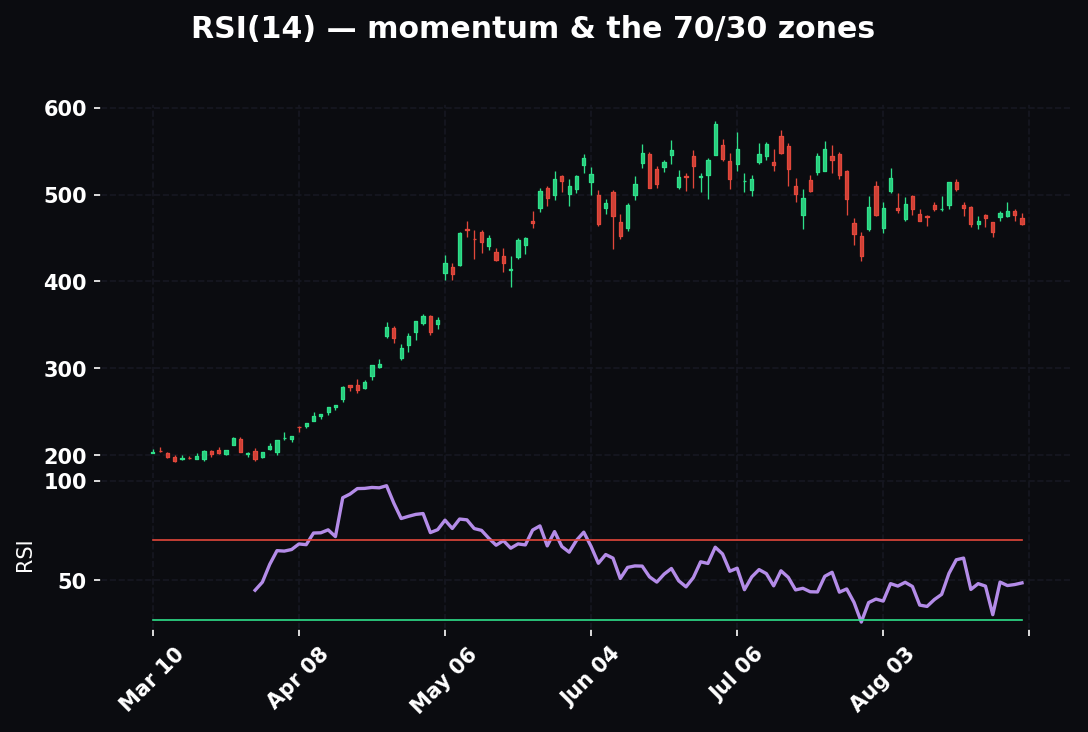
Why does this matter so much for a beginner? Because the flip gives you fresh, high-quality levels to trade. A recently broken level that price comes back to "retest" is one of the cleanest setups there is. When price breaks above $58 and then gently pulls back to $58 and holds, you're watching an old ceiling do its new job as a floor in real time. That "retest" — price returning to touch a broken level — is often a lower-risk place to get in, because your invalidation is close by (just below the level) and the reaction is easy to read.
Remember the rule: the level is the level. Whether it's acting as floor or ceiling depends only on which side price is on right now. Same line, two jobs.
A Fully Worked Beginner Example
Let's put every piece together with one clean story and real-ish numbers. Meet a made-up stock, BluePeak Corp, ticker BPK. (A ticker is just the short symbol a stock trades under.)
Marking the levels. You open BPK's chart. Looking back over the last couple of months, you notice:
- Price bounced up off $40 three separate times. That's a floor. You draw a horizontal line: support at $40.
- Price got rejected and turned down from $50 twice. That's a ceiling. You draw a line: resistance at $50.
BPK has basically been bouncing between $40 and $50 — this sideways floor-to-ceiling zone is called a range. (A range is when price chops back and forth between the same support and resistance instead of trending up or down.)
The setup. Today BPK has fallen to $40.20, right at your support floor. You do not buy immediately — remember, we trade the reaction, not the prediction. You wait and watch what price does at $40.
The reaction. Over the next hour, BPK stops falling. It dips to $39.90, then pushes back up to $40.50, then $41. Buyers are clearly stepping in. The floor is holding, and price is showing you a bounce. Now you have a reason to act.
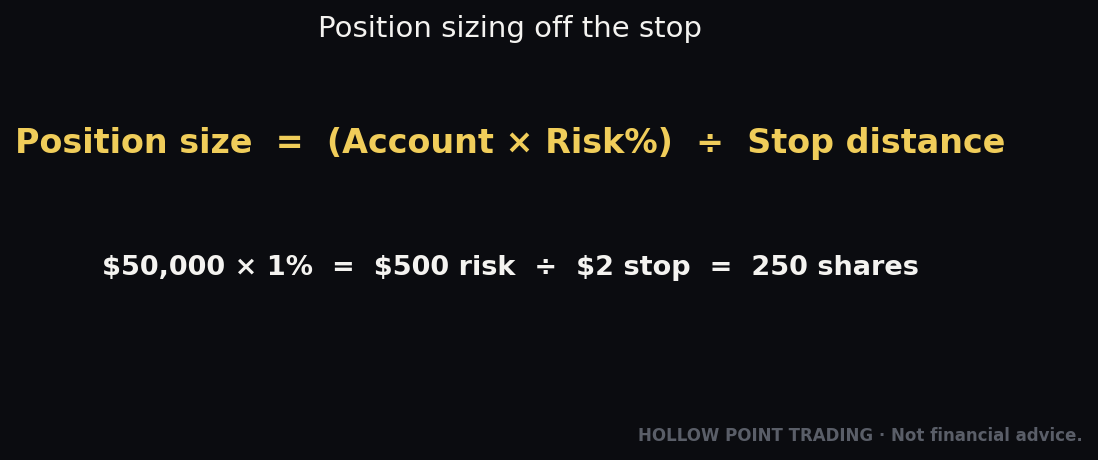
The plan (this is the important part). You build the trade around the level:
- Entry: You buy at $41, once the bounce is confirmed.
- Stop-loss (invalidation): You place your stop just below the floor at $39.50. If price closes down there, the $40 support is broken and your whole reason for the trade is gone. Your risk is $41 − $39.50 = $1.50 per share.
- Target (where you'll take profit): The next ceiling up is resistance at $50. But you don't need to be greedy. Let's aim for $45.50. Your reward is $45.50 − $41 = $4.50 per share.
Now do the ratio: you're risking $1.50 to make $4.50. That's 1:3 reward-to-risk — exactly the Hollow Point standard. For every dollar at risk, three dollars of potential reward. You didn't guess that number; the levels handed it to you.
How it plays out — two endings.
Ending A (you're right): BPK bounces off $40, climbs steadily, and hits $45.50. You sell. You made $4.50 a share. The floor did its job.
Ending B (you're wrong): BPK bounces weakly to $41, then rolls over and slices down through $40 to $39.40. Your stop at $39.50 triggers and sells you out. You lost $1.50 a share — a small, planned, survivable loss. And notice what likely happens next: that broken $40 floor may now flip into resistance. If price rallies back to $40 and gets rejected, the flip just confirmed itself, and you're glad you're out.
Here is the beautiful part of the 1:3 math: you can be wrong more often than you're right and still make money. If you take four trades like this and win just two, you make $9.00 on the winners ($4.50 × 2) and lose $3.00 on the losers ($1.50 × 2). Net: +$6.00, while being right only half the time. That is why levels plus reward-to-risk beats trying to be a fortune-teller. You don't need to predict well. You need to manage well.
The Beginner Mistakes to Avoid
Everyone makes these. You'll make some of them anyway. But knowing them shrinks the damage.
1. Drawing levels too precisely. Beginners treat $50.00 like a laser line and panic when price hits $50.14. Support and resistance are zones, not exact pennies. Think of a level as a small band — say $49.80 to $50.20 — not a single number. Price often overshoots a level by a little before turning. Give it room to breathe.
2. Predicting instead of reacting. We've hammered this, and we'll hammer it once more: buying before the level confirms a bounce is guessing. Wait for the reaction. Missing a trade costs you nothing. Guessing wrong costs you money.
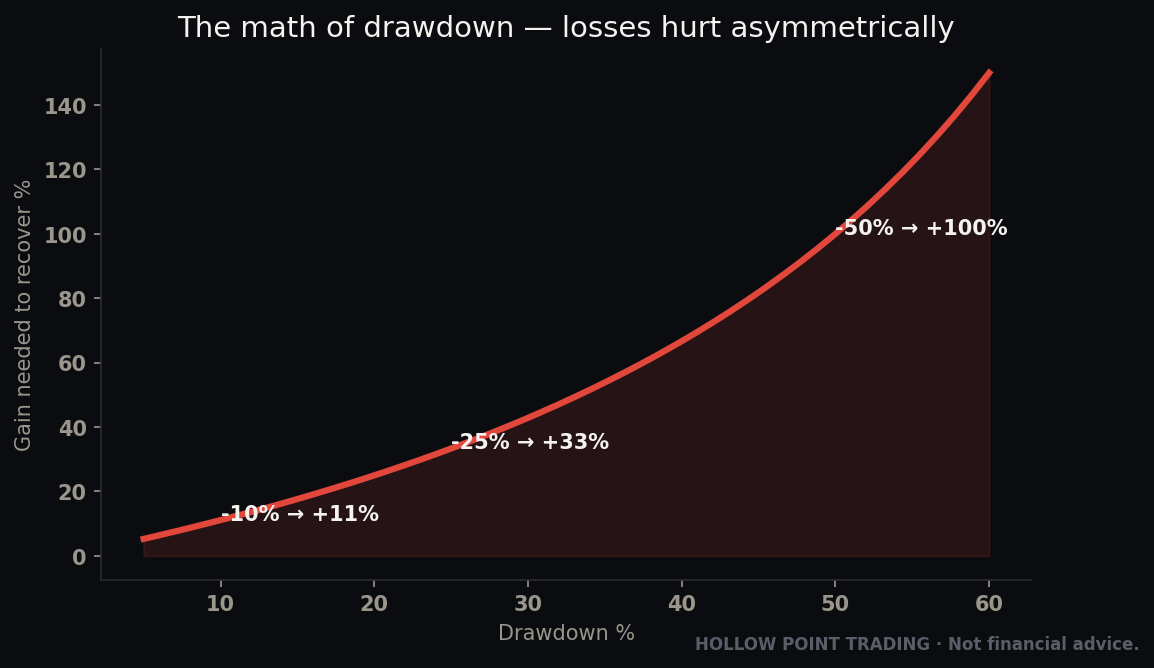
3. Trading with no stop-loss. The number one account-killer for beginners. Without a stop, a small planned loss becomes "I'll just hold and hope," which becomes a 40% loss you can't recover from. Protect capital first. Every single trade gets a stop, placed at your invalidation level, before you enter.
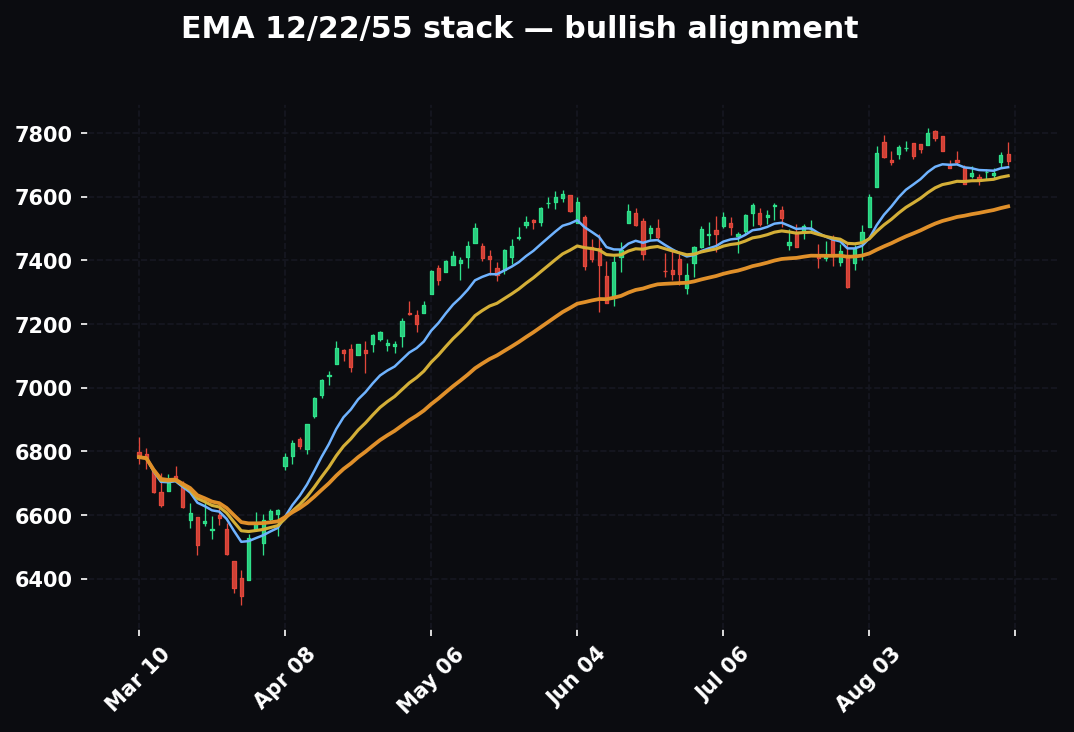
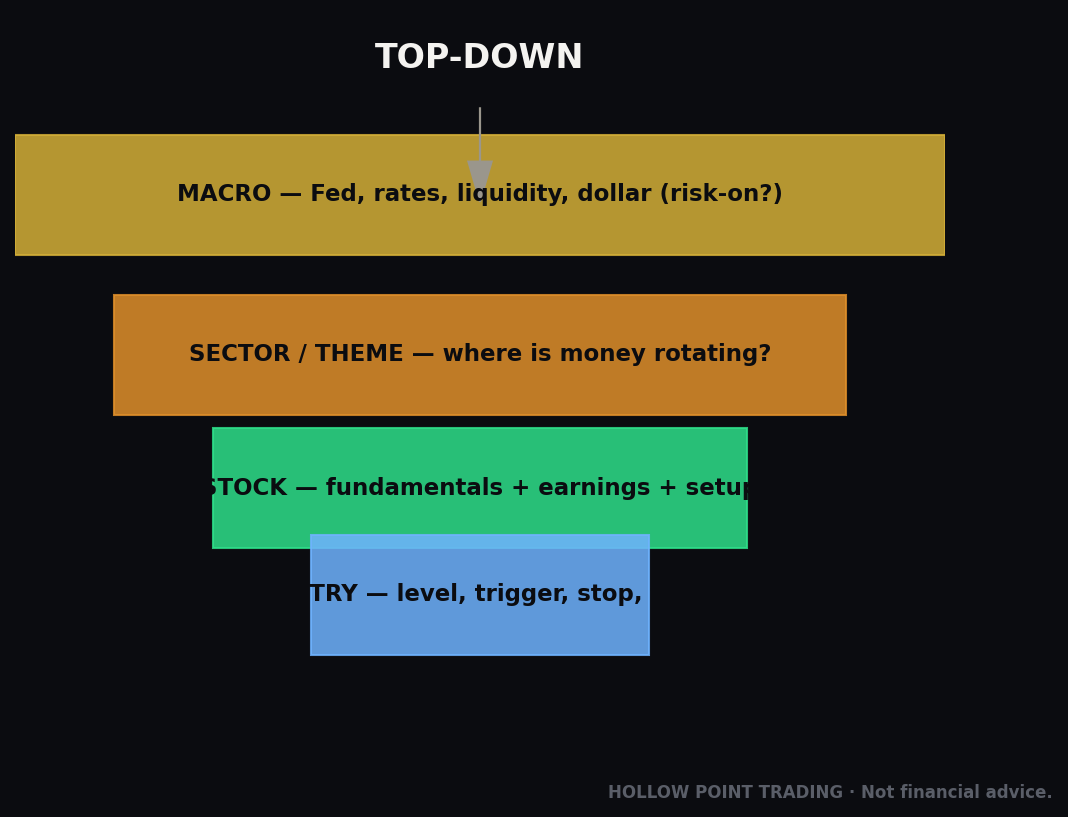
4. Ignoring the direction of the bigger picture. A floor is much more likely to hold if the overall trend is up, and much more likely to break if everything's falling apart. Which brings in the Hollow Point way of seeing markets: macro → sector → stock. First check the big picture (is the whole market healthy or scared?), then the sector (is this industry strong?), then the individual stock's level. Buying a bounce at support while the entire market is crashing is fighting the tide.
5. Forcing levels that aren't there. If you have to squint and use your imagination to find support, it isn't real support. The best levels are obvious — price clearly bounced or reversed there more than once. At Hollow Point we call a weak setup weak. A shaky level with one soft touch is not the same as a level price has respected four times on heavy activity. Don't manufacture confidence you haven't earned.
6. Chasing a level that already ran. If price already bounced hard off $40 and is now at $44, you missed the low-risk entry. Chasing it up here means your stop is now far away and your reward-to-risk is ruined. Let it go. There is always another setup. Discipline over FOMO (fear of missing out).
7. Marking too many lines. A chart with twenty levels on it is useless — everything looks important, so nothing is. Mark the three to five levels that clearly matter and ignore the noise. Clean chart, clear mind.
What Makes a Level Strong vs. Weak
Not all floors and ceilings are created equal. Before you trust a level, run it through four quick questions. The more "yes" answers, the stronger the level.
- How many times has price reacted here? One touch is a maybe. Two or three clean bounces or rejections is a real level. More touches = stronger.
- How much activity was there? Volume is the number of shares traded. A bounce on heavy volume (lots of people buying the floor) is far more meaningful than a bounce on a quiet, sleepy afternoon. Big reaction = big conviction.
- How recent is it? A level respected last week matters more than one from two years ago that everyone's forgotten. Fresh memory is stronger memory.
- Is it a round or obvious number? $50, $100, a prior all-time high — these carry extra psychological weight because everyone's watching them.
A level that's been hit four times, recently, on heavy volume, at a round number is one you sit up and pay attention to. A level with one soft touch three months ago is one you note quietly and don't bet the farm on.
Your Simple Cheat-Sheet
Print this. Tape it near your screen. This is the whole guide compressed into something you can run through in sixty seconds before any trade.
FINDING LEVELS
- Support = floor where price bounced UP before (draw a horizontal line).
- Resistance = ceiling where price turned DOWN before (draw a horizontal line).
- Look left on the chart. Where did price clearly stop and reverse? Mark those.
- Treat levels as zones, not exact pennies.
- Mark only the 3–5 clearest levels. Delete the noise.
JUDGING A LEVEL
- More touches = stronger. Heavy volume = stronger. Recent = stronger. Round number = stronger.
- If you have to squint to see it, it isn't there.
TRADING A LEVEL
- Wait for price to REACT at the level. Never predict — react.
- Support bounce = potential buy. Resistance rejection = potential sell / stay out.
- Broken floor → it flips to a ceiling. Broken ceiling → it flips to a floor. Retests of flipped levels are prime setups.
MANAGING THE TRADE (non-negotiable)
- Set your STOP-LOSS at invalidation (just past the level) BEFORE you enter.
- Set your TARGET at the next level.
- Only take the trade if reward is at least 3× your risk (1:3).
- Check the bigger picture first: macro → sector → stock.
- Small planned loss is fine. Hoping is not a plan.
How This Fits the Bigger Hollow Point Picture
Support and resistance aren't a trick or a standalone system. They're the foundation everything else at Hollow Point Trading stands on. Here's how this one skill connects to the whole philosophy.
It makes discipline possible. Our creed is discipline over prediction. You cannot be disciplined without rules, and you cannot have rules without objective lines on a chart. Levels are those lines. They turn "I feel like it's going up" into "I buy the confirmed bounce off $40, stop at $39.50, target $45.50, and I'm out if it breaks." Feelings become a checklist. That's discipline you can actually follow when your heart is pounding.
It makes the 1:3 math real. Reward-to-risk is the engine that lets you profit while being wrong half the time — but the engine needs fuel, and the fuel is knowing your levels. Your stop lives just past one level; your target lives at the next. Without support and resistance there's no way to measure risk or reward, and the 1:3 rule is just a slogan. With them, it's arithmetic.
It protects your capital. Protect capital first is the first commandment for a reason: you can't trade tomorrow if you blow up today. Levels give you a pre-decided exit — the invalidation price — so every loss is small and planned instead of large and emotional. Support and resistance are, above all, a risk-management tool wearing an entry-signal costume.
It slots into macro → sector → stock. A single level is stronger or weaker depending on the world around it. Before you trust a floor on one stock, you zoom out: Is the overall market (macro) healthy or fearful? Is the sector strong or sagging? Then you judge the stock's level. Support and resistance is the final, ground-level layer of a top-down view — the place where the big picture meets a specific price you can act on.
Master this one skill and you've built the base. Every fancier tool you'll ever learn — trends, moving averages, patterns, momentum — is really just a more sophisticated way of asking the same two questions support and resistance already answer: Where will price stop? Where will it turn? Get the floor and the ceiling right, wait for the reaction, manage the risk, and you're no longer gambling. You're trading.
Start Monday with one chart and one job: find three clear floors and ceilings. Don't trade them yet — just mark them, then watch what price does when it arrives. Do that for a week and the scribble becomes a map. That's the whole beginning.
Bound by rules, feared by trade.