
If you have ever watched a stock rip higher and thought, "Is it too late to buy?" — or watched one fall and wondered, "Is it cheap yet, or is it about to get cheaper?" — then you have already asked the exact question RSI was built to help answer.
RSI is one of the first tools almost every new trader meets. It is also one of the most misunderstood. Beginners fall in love with it because it looks like a magic overbought/oversold button, then lose money because they use it exactly the wrong way. This guide fixes that. By the end, you will understand what RSI actually measures, how to read it, the one mistake that blows up new traders, and how it fits into the bigger Hollow Point Trading way of thinking. You will be able to open a chart Monday morning and use it — carefully, correctly, and with your capital protected.
Let's start from zero.
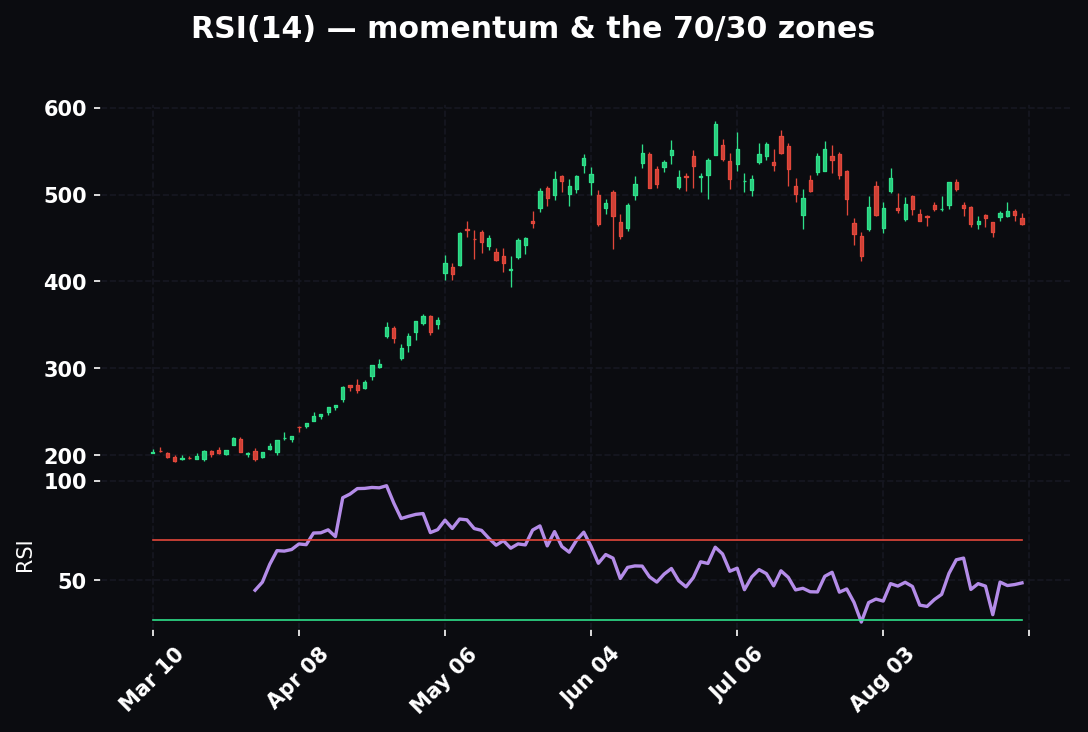
What RSI Actually Is (In Plain English)
RSI stands for Relative Strength Index. Ignore the fancy name for a second. Here is what it really is:
RSI is a speedometer for price. It does not tell you where price is going. It tells you how fast and how hard price has been moving in one direction recently, and whether that push is strong or getting tired.
Think about driving a car. Your speedometer does not tell you your destination. It tells you how fast you are going right now. If you have been flooring the gas for a while, the speedometer reads high — but you also know, instinctively, that you cannot floor it forever. Eventually you ease off, or you run out of road. RSI is that speedometer, but for a stock's price.
The number RSI produces is always between 0 and 100.
- A high number (say, 70 or above) means price has been pushing up hard and fast recently. Lots of green candles, few red ones.
- A low number (say, 30 or below) means price has been pushing down hard and fast recently. Lots of red candles, few green ones.
- A middle number (around 50) means buyers and sellers have been roughly even. No strong push either way.
That is the whole core idea. RSI takes the recent tug-of-war between buyers and sellers and boils it down to a single number from 0 to 100 that tells you which side has been winning, and by how much.
One term to define right now, because you will see it constantly: momentum. In trading, momentum just means the strength and speed of a price move. Strong momentum = price moving decisively in one direction. Weak momentum = price drifting, hesitating, or stalling. RSI is a momentum indicator — a tool designed to measure exactly that strength and speed. Whenever someone says "momentum," picture a ball rolling: is it speeding up, holding steady, or slowing down before it stops?
RSI was created by a man named J. Welles Wilder Jr. back in 1978 — long before computers were on every desk. It has survived almost fifty years for one simple reason: measuring momentum genuinely helps, as long as you know what it can and cannot do.
Why a Beginner Should Care About RSI
You might be thinking, "I can already see on the chart when something has gone up a lot. Why do I need a number for it?"
Fair question. Here is why RSI earns its place on your screen.
1. It removes the emotion from "a lot." Your eyes lie. When you are excited about a stock, a small move looks huge. When you are scared, a normal dip looks like a crash. RSI gives you a cold, unemotional number. "Price feels overheated" becomes "RSI is 78." That is a fact you can act on with rules instead of feelings — and rules are the whole Hollow Point Trading game.
2. It warns you when a move is getting tired before the price turns. This is RSI's superpower, and we will spend real time on it later (it is called divergence*). Sometimes price makes a shiny new high, but the momentum behind it is quietly fading. RSI can show you that fading engine while the price still looks strong — like a runner whose legs are giving out even though they are still moving forward.
3. It keeps you from buying at the worst possible moment. New traders love to buy things that have already rocketed straight up. It feels safe because "it's clearly going up." RSI is a gentle hand on your shoulder saying, "This has run hard and fast — maybe wait for a better price." Protecting your capital by not chasing is one of the most valuable habits you can build.
4. It works on any market and any timeframe. Stocks, futures, crypto, forex — RSI reads them all. A 5-minute chart or a weekly chart — same tool, same rules. Learn it once, use it everywhere.
A word of honest warning before we go further, because Hollow Point does not sell fantasies: RSI is a helper, not a crystal ball. It will not predict the future. Used alone, it will get you hurt. Used within a bigger plan — the way we will teach it here — it becomes a genuinely useful piece of the puzzle. Keep that expectation set correctly and RSI will serve you for years.
How RSI Works, Step by Step
You do not need to calculate RSI by hand. Every charting platform (TradingView, ThinkorSwim, your broker's app) does it for you instantly. But understanding what is happening under the hood — just once, in plain terms — will make you far better at reading it. So let's peek inside the engine, gently.
RSI looks at a set number of recent candles. The standard setting is 14 — that means "the last 14 bars." On a daily chart, that's the last 14 days. On a 5-minute chart, the last 14 five-minute bars. (We will talk about that number later; 14 is the default and a fine place to start.)
Over those last 14 bars, RSI asks two simple questions:
- On the days price went up, how much did it go up on average? (Call this the average gain.)
- On the days price went down, how much did it go down on average? (Call this the average loss.)
Then it compares them. That comparison is the "relative strength" in the name — it is literally comparing the strength of the up-moves against the strength of the down-moves.
Here is the intuition without any scary math:
- If the up-moves have been much bigger than the down-moves, buyers are dominating. RSI reads high.
- If the down-moves have been much bigger than the up-moves, sellers are dominating. RSI reads low.
- If they are roughly equal, RSI sits near 50 — a balanced fight.
The actual formula squeezes that comparison into the 0-to-100 range so it is easy to read. If you are curious, here it is, and then we will never do arithmetic again:
RSI = 100 − (100 ÷ (1 + RS)), where RS = average gain ÷ average loss.
Let's make that concrete with tiny, clean numbers so it clicks.
Imagine over the last 14 days, the average up day gained $2, and the average down day lost $1.
- RS = average gain ÷ average loss = 2 ÷ 1 = 2.
- RSI = 100 − (100 ÷ (1 + 2)) = 100 − (100 ÷ 3) = 100 − 33.3 = 66.7.
So RSI is about 67 — leaning high, because up-moves were twice as strong as down-moves. Buyers have been winning.
Now flip it. Suppose the average up day gained $1 and the average down day lost $3.
- RS = 1 ÷ 3 = 0.33.
- RSI = 100 − (100 ÷ 1.33) = 100 − 75 = 25.
RSI is about 25 — leaning low, because sellers have been three times stronger. Sellers have been winning.
That is the entire mechanism. Big up-moves relative to down-moves push the number up; big down-moves relative to up-moves push it down; balance sits near the middle. You will never do this by hand in real life — the platform draws it as a wavy line in a little window below your price chart, updating live. But now, when that line climbs, you know it means "up-moves are dominating lately," and when it drops, you know it means "down-moves are dominating." That understanding is what separates a trader who reads RSI from one who just stares at a squiggle.
The Three Zones: Overbought, Oversold, and the Middle
The RSI line lives in a small panel under your price chart, wiggling between 0 and 100. Most platforms draw two dotted horizontal lines across that panel: one at 70 and one at 30. Those two lines split RSI into three zones. Learn these and you are 80% of the way there.
The Overbought Zone (70 and above)
"Overbought" means price has risen far and fast, and buyers may be getting exhausted. Think of it as stretched to the upside — like a rubber band pulled tight.
Here is the single most important thing a beginner can learn about this word: overbought does NOT mean "sell now" or "it's about to crash." It means "this has run hard; be careful chasing it." A strong stock can stay overbought for a long time while it keeps climbing. We will hammer this point again in the mistakes section because it is where most beginners lose money.
The Oversold Zone (30 and below)
"Oversold" is the mirror image. It means price has fallen far and fast, and sellers may be getting exhausted. The rubber band is now stretched tight to the downside.
And the same warning applies, flipped: oversold does NOT mean "buy now" or "it's about to bounce." It means "this has dropped hard; a bounce is possible, but a falling knife can keep falling." A weak stock can stay oversold for a long, painful time.
The Middle Zone (roughly 30 to 70)
This is the neutral ground, the everyday battlefield. Most of the time, RSI lives here. Inside this zone, one level matters more than any other: the 50 line.
The 50 line is the tie-breaker between buyers and sellers.
- RSI holding above 50 = buyers generally in control. Momentum leans up.
- RSI holding below 50 = sellers generally in control. Momentum leans down.
Many experienced traders care more about which side of 50 the RSI is on than about the 70/30 extremes. It is a quiet, underrated signal: in an uptrend, RSI tends to bounce off the 50 area and head back up; in a downtrend, RSI tends to reject the 50 area and head back down. Watching that 50 line is a beginner habit worth building early.
A Fully Worked Beginner Example
Let's walk through a realistic example from start to finish, the way you would actually experience it. We will use a made-up company, BrightPath Foods (ticker: BPF), on a daily chart. (The numbers are illustrative, but they behave the way real charts behave.)
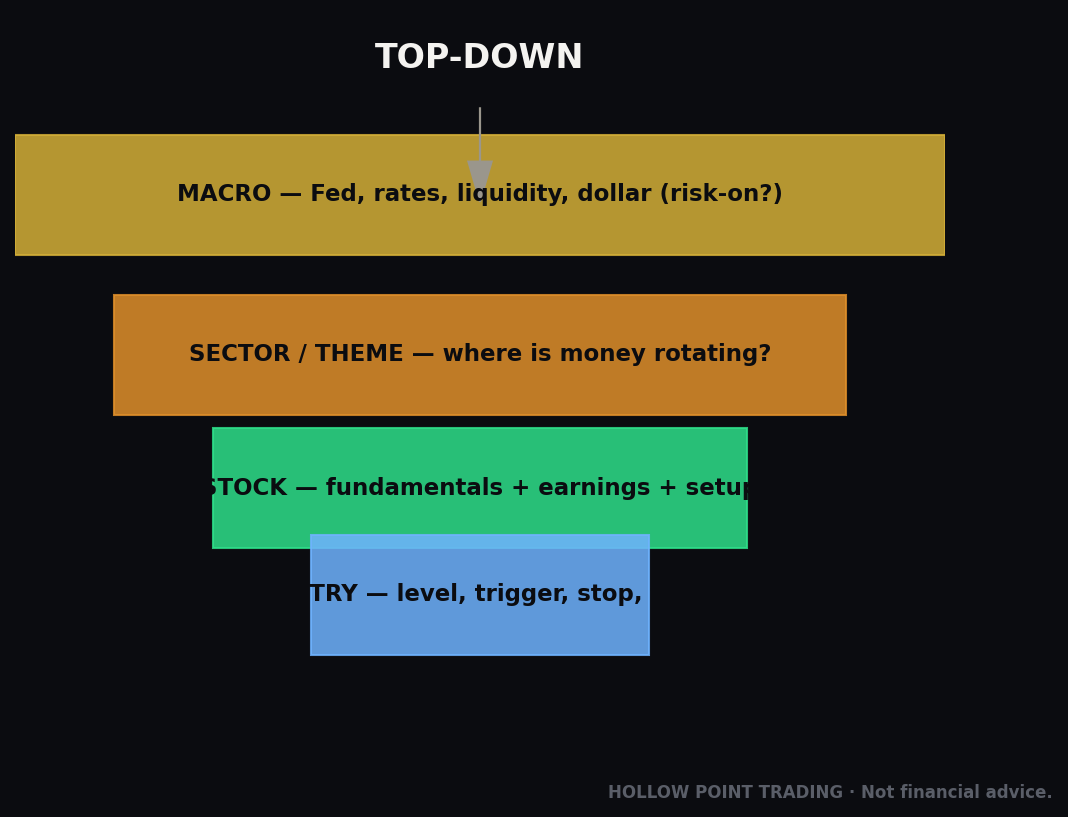
The setup. BPF has been climbing steadily from $40 to $52 over three weeks. Nice, healthy uptrend — higher highs and higher lows. You are watching it because your broader read is bullish: the overall market is strong, the food sector is holding up, and BPF is a leader within it. (That top-down order — market first, then sector, then the individual stock — is the Hollow Point way, and we will circle back to it.)
Step 1 — Check the trend first, RSI second. Before you even glance at RSI, you note the trend is clearly up. This matters enormously. RSI signals mean different things depending on the trend, so you always establish the trend first.
Step 2 — Read the RSI. You look at the RSI panel. Over the climb from $40 to $52, RSI has been riding between 55 and 68 — comfortably above 50, occasionally poking toward overbought but never staying there. Translation: buyers are firmly in control, and the move has been strong but not yet reckless. This is a healthy uptrend. Good.
Step 3 — The pullback. BPF dips from $52 back to $48 over four days. Red candles. Scary if you are new. But you check RSI: it has dropped from 66 down to about 48 — just under the 50 line. It did not crash to oversold; it just cooled off. In a strong uptrend, a pullback that brings RSI down to the 40–50 area is often the market catching its breath, not the trend breaking. This is exactly the kind of spot where a trend-following trader gets interested in joining the move at a better price, rather than chasing the top.
Step 4 — The bounce and the signal. BPF holds $48, and over the next two days RSI curls back up and crosses back above 50, while price starts making higher lows again. Momentum is re-asserting to the upside, in the direction of the established trend. This is a far higher-quality signal than blindly buying because "RSI touched 30."
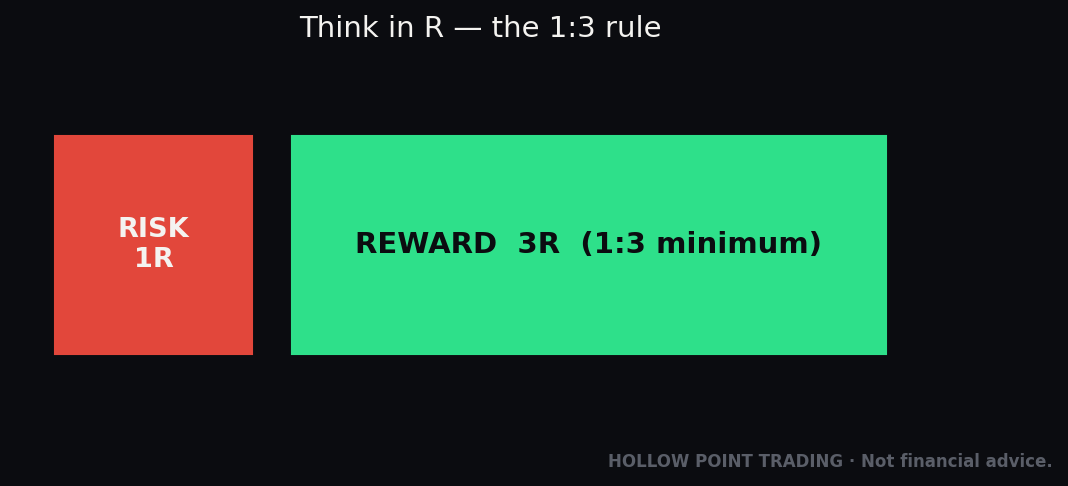
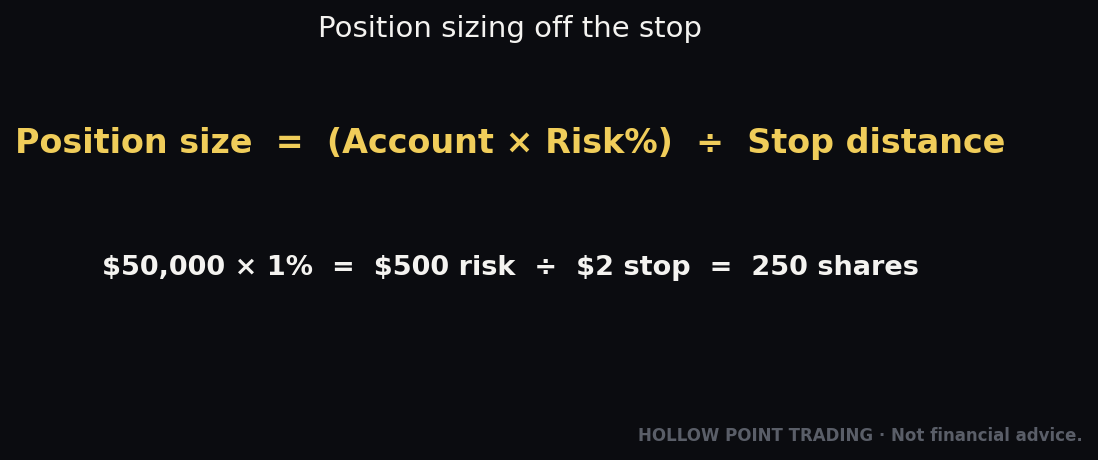
Step 5 — Now the risk plan (the most important step). Say you decide this is a setup you like. You would buy near $48.50 as it turns back up. You place a stop-loss — an automatic exit order that caps your loss if you are wrong — just below the pullback low, say at $47.30. That risk is about $1.20 per share. Hollow Point insists on at least a 1:3 reward-to-risk ratio, meaning your profit target should be at least three times your risk: 3 × $1.20 = $3.60, so your target is around $52.10 or higher. You are risking $1.20 to make $3.60. Even if you are right only half the time, that math keeps you profitable. RSI helped you find the spot; the risk plan is what actually keeps you alive.
Step 6 — What would have made you pass. Suppose instead that when BPF pushed to a new high of $53, RSI made a lower high than it did at $52 — momentum fading while price climbed. That is a warning sign called divergence, and it would make you far more cautious about buying. Let's learn that now, because it is RSI at its most useful.
Divergence, Explained Simply
Divergence is a big word for a simple idea: price and RSI disagreeing. When they disagree, it is a hint that the current move is running out of fuel.
Remember the runner whose legs are giving out even though they are still moving forward? That is divergence. The price is the runner's position on the track — still inching forward. The RSI is the runner's energy level — quietly draining. When the position keeps advancing but the energy keeps dropping, you start to suspect the runner is about to stop. Divergence spots that gap.
There are two kinds, and you only need these two.
Bearish Divergence (a warning for uptrends)
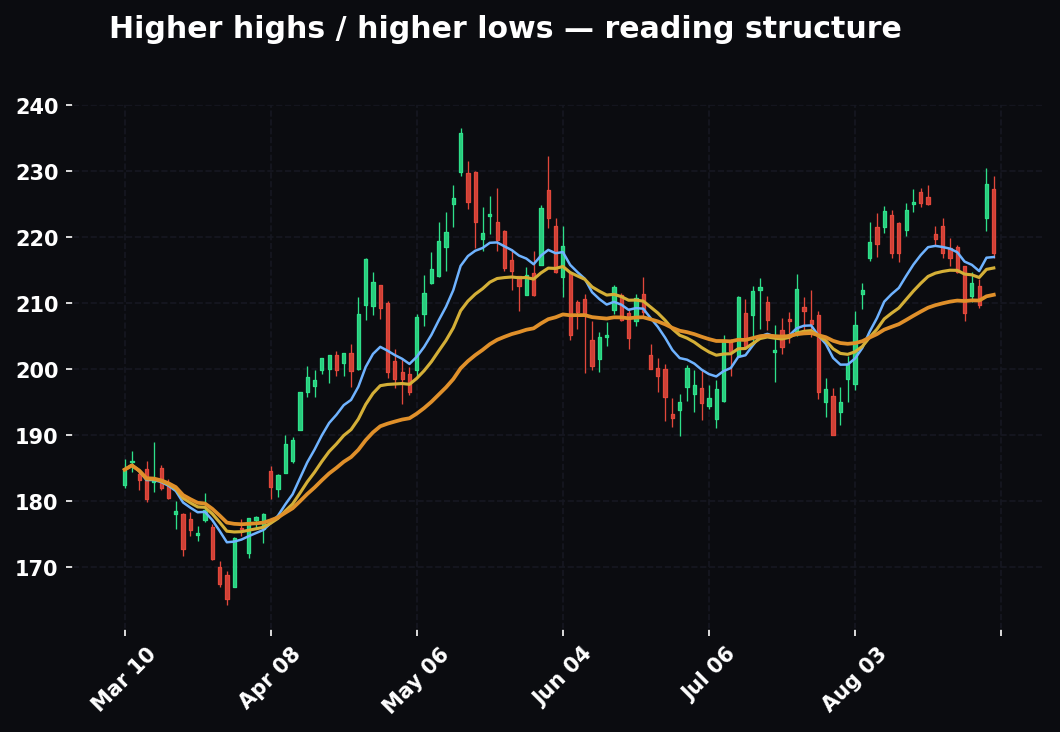
This happens when price makes a higher high, but RSI makes a lower high.
In plain English: the price pushed to a new peak, but the momentum behind that push was weaker than the last peak. The engine is fading even though the car is still creeping forward. It is an early warning that the uptrend may be tiring and a pullback or reversal could be coming.
Example. Stock ZephyrTech hits $100 with RSI at 75. It pulls back, then rallies to a new high of $104 — but this time RSI only reaches 68. Price said "new high!" while RSI said "...but with less strength than before." That is bearish divergence. It does not mean sell everything this second. It means the buyers are getting tired — tighten your stop, take some profit, stop adding, and be ready.
Bullish Divergence (a warning for downtrends)
The mirror image: price makes a lower low, but RSI makes a higher low.
Price dropped to a new bottom, but the selling behind that drop was weaker than the last bottom. The sellers are running out of ammunition. It is an early hint that a downtrend may be exhausting itself and a bounce could be near.
Example. Stock Harbor Metals falls to $30 with RSI at 22. It bounces, then sinks to a new low of $28 — but RSI only drops to 29 this time. New price low, but less downside momentum. That is bullish divergence: the sellers are exhausting themselves. Again — not a "buy right now" button, but a "the down-move is losing steam, start watching for a turn" signal.
Divergence is genuinely one of RSI's most respected uses, because it can warn you before the price actually turns. But — and this is critical — divergence can persist for a long time before anything happens, and sometimes it just fizzles with no reversal at all. A strong trend can flash divergence repeatedly and keep right on going. So divergence is a yellow flag, not a green light. It tells you to pay attention and manage risk, never to bet the farm on a top or bottom. Wait for the price itself to confirm — a break of a trendline, a lower low forming, a support level giving way — before you act.
The Beginner Mistakes to Avoid
This is the most valuable section in the guide. Read it twice. Nearly every dollar beginners lose with RSI comes from one of these.
Mistake #1: Treating overbought as an automatic "sell" and oversold as an automatic "buy"
This is the big one. New traders see RSI hit 72 and immediately short or sell, or see it hit 28 and immediately buy. Then they get run over.
Why? Because in a strong trend, RSI can stay overbought or oversold for a very long time. A powerful stock in a raging uptrend can pin RSI above 70 for weeks while it keeps climbing 30% higher. If you shorted every time it hit 70, you would be crushed repeatedly. The same is true in reverse: a collapsing stock can sit under 30 the whole way down as it loses half its value. "Oversold" bought you a falling knife.
The fix: Overbought and oversold are context, not commands. In a strong uptrend, treat overbought as strength confirmed, not a sell signal. Only look for oversold bounces when the bigger trend actually supports an up-move. Never trade an RSI extreme against a strong trend just because of the number.
Mistake #2: Using RSI all by itself
RSI is one instrument in the cockpit. Flying on it alone is how you crash. RSI does not know about the trend, support and resistance levels, volume, the sector, the overall market, or the news. It only knows recent momentum.
The fix: Always combine RSI with at least one other piece of information — the trend direction, a key support or resistance level, or the broader market picture. RSI should confirm a decision you are already leaning toward for other reasons, not make the decision alone.
Mistake #3: Fighting the trend
This is really mistakes #1 and #2 combined, but it deserves its own line because it is so common. Beginners use RSI to pick tops and bottoms against a strong trend — the single hardest, lowest-odds thing you can do in trading. "This has gone up too far, I'll short it" is a sentence that has bankrupted more new traders than almost any other.
The fix: Trade with the trend, not against it. Use RSI to find good entry timing in the direction the market is already going — buying pullbacks in an uptrend, for instance — rather than to bet on reversals of a healthy trend.
Mistake #4: Changing the settings until you get the answer you want
New traders discover you can change RSI from 14 to some other number, and they start fiddling — dropping it to 5 to get more signals, or hunting for the "perfect" setting that would have called every past top. This is a trap. A shorter setting (like 7) makes RSI jumpier and noisier — more signals, but more false ones. A longer setting (like 21) makes it smoother and slower — fewer signals, but they lag.
The fix: Start with the standard 14 and leave it there while you learn. There is no magic number. Consistency beats fiddling. Once you have a year of experience, you can experiment — but as a beginner, 14 is your friend.
Mistake #5: Ignoring the timeframe
RSI on a 1-minute chart and RSI on a weekly chart are telling you about completely different things — a momentary blip versus a months-long tide. Beginners get whipsawed by trading tiny-timeframe RSI signals that mean almost nothing for a position they intend to hold for days.
The fix: Match the RSI timeframe to your trading style, and let higher timeframes lead. A common, sturdy approach: check RSI on the higher timeframe (say, the daily) to understand the bigger momentum picture, then use a lower timeframe (say, the 1-hour) to time your entry — but only in the direction the higher timeframe supports.
Mistake #6: Forgetting that RSI is about the past
RSI is calculated entirely from candles that have already closed. It describes what momentum has been, not a guarantee of what it will be. It is a rear-view and side-mirror tool, not a windshield. Respect it as evidence, not prophecy.
Your RSI Cheat-Sheet
Screenshot this. It is everything above, compressed into something you can glance at Monday morning.
What it is: A momentum speedometer for price, scored 0 to 100.
The zones:
- 70+ = Overbought (run hard to the upside; be careful chasing) — not an automatic sell.
- 30 and below = Oversold (dropped hard; possible bounce) — not an automatic buy.
- Around 50 = The tie-breaker. Above 50 = buyers in control. Below 50 = sellers in control.
The two divergences (yellow flags, not green lights):
- Bearish: price higher high + RSI lower high = uptrend tiring.
- Bullish: price lower low + RSI higher low = downtrend tiring.
The rules that keep you safe:
- Establish the trend first. RSI second.
- Never trade an RSI extreme against a strong trend.
- RSI confirms, it never decides alone. Pair it with trend, levels, or the market picture.
- Keep the setting at 14 while you learn.
- Match RSI to your timeframe; let higher timeframes lead.
- Every trade gets a stop-loss and at least a 1:3 reward-to-risk plan — no exceptions.
The five-second read, every time you look at RSI:
- Which way is the trend? (Up / down / sideways)
- Which side of 50 is RSI on? (Buyers or sellers in control)
- Is it at an extreme (70+/30−), and does that agree with the trend?
- Any divergence — is price and RSI disagreeing?
- If I acted, where is my stop, and is my target at least 3× my risk?
Run those five questions and you are already trading RSI more thoughtfully than most beginners ever will.
How RSI Fits the Bigger Hollow Point Picture
Here is where we zoom out, because a tool only matters inside a process. RSI is not the strategy. It is one gauge on a much larger dashboard, and Hollow Point Trading has a specific philosophy about how that dashboard gets read.
First, top-down. We never start with the individual stock. We start with the overall market — is the broad tide rising or falling? Then the sector — is this stock's neighborhood strong or weak? Only then the individual stock. RSI enters at that final stage, helping you time your involvement in a name you already like for bigger reasons. An oversold RSI on a stock in a weak sector inside a falling market is not a gift — it is a warning you are fighting the current. Context first, always.
Second, discipline over prediction. Notice how many times this guide said RSI is not a crystal ball. That is not accidental. The Hollow Point way is not about predicting the future — nobody can. It is about following a repeatable set of rules that puts the odds and the math on your side, then executing them without ego. RSI gives you rule-based, unemotional readings ("RSI is 74, above 50, no divergence, trend up") instead of feelings ("I think it's gonna moon"). Use it to reinforce discipline, never to justify a gamble.
Third, protect capital first. RSI's most valuable everyday job for a beginner is defensive: keeping you from chasing overheated moves, warning you when momentum is fading under a position you hold, and helping you find lower-risk entry points closer to your stop-loss. Every idea RSI helps you find still has to clear the same gate: a defined stop-loss and at least a 1:3 reward-to-risk ratio. The tool finds the opportunity; the risk rules decide whether it is worth taking. Survival comes before profit, every single time.
So where does RSI actually sit? It is a momentum confirmation tool near the end of your decision process — after the market read, after the sector read, after you have identified a stock and a level you care about. It helps answer the last question: "Is momentum on my side right now, and is this a smart moment to act?" That is a genuinely useful question. It is just not the only question, and RSI was never meant to be the only answer.
Master it in that role — one honest gauge among several, inside a disciplined, capital-first process — and RSI will quietly make you a sharper trader for the rest of your career. Misuse it as a magic buy/sell button, and it will teach you expensive lessons. The choice, as always, comes down to rules.
Start with 14. Read the trend first. Let RSI confirm, never command. Put a stop on every trade. Do that, and you are already ahead of the crowd.
Bound by rules, feared by trade.