
Most traders learn to buy first. You buy a stock, it goes up, you win. Simple. Shorting flips the whole thing upside down — you sell first, buy back later, and you profit when the price falls. That inversion sounds like a neat symmetry, but it isn't symmetric at all. When you buy a stock, the worst that happens is it goes to zero and you lose 100%. When you short a stock, there is no ceiling on how high it can run against you. That single fact governs everything about how a professional approaches the short side — the position sizing, the stop placement, the choice of which stocks to short in the first place, and the ice-cold rule about never adding to a loser.
This guide walks the whole machine, and it walks it slowly, because the short side is where sloppy understanding turns expensive. We'll cover how a short actually gets built out of borrowed shares, what the borrow fee and "hard-to-borrow" really mean for your P&L, how short interest and days-to-cover are read as a crowd gauge, and then the main event — how a short squeeze is born, why gamma pours gasoline on it, how the whole thing behaves differently in a trending tape versus a chop versus a high-volatility blowoff, and how to structure the trade across timeframes so you're never the last one standing when the door slams. By the end you should be able to look at a heavily shorted name and know, within a minute, whether you're looking at an opportunity, a trap, or a thing to leave completely alone.
The Concept: Selling What You Don't Own
When you short a stock, you are selling shares you do not currently own, with a binding promise to buy them back and return them later. You borrow the shares from someone who does own them — routed through your broker — sell them into the open market at today's price, and pocket the cash. Your hope is that the price drops. If it does, you buy the shares back cheaper, hand them back to the lender, and keep the difference.
The core idea in one line: you sell high, then buy low — but in that order.
The base case, in dollars
Say XYZ trades at $100. You believe it's overvalued and heading down. You borrow 100 shares and sell them, collecting $10,000. Two weeks later XYZ has fallen to $70. You buy 100 shares back for $7,000, return them to the lender, and keep $3,000 (before fees). You never owned the company. You rented its shares, sold the rental, and replaced it cheaper. Your return on the trade was a clean 30% of the notional, achieved by being right about direction and patient about timing.
Now flip it. XYZ rises to $130 instead. To close, you must buy 100 shares back at $130 — that's $13,000 out of pocket to replace shares you sold for $10,000. You lose $3,000. And it can keep going. At $200 you're down $10,000 — you've lost your entire original position value and you're still on the hook. At $300 you've lost $20,000 on a trade that started at $10,000 of exposure. There is no natural stopping point, because there is no cap on how high a price can climb.
Why the asymmetry is the whole personality of the trade
That asymmetry is the whole personality of the trade. A long position can gain infinitely and lose 100%. A short position can gain 100% (if the stock goes to zero) and lose infinitely. You are picking up capped reward in exchange for uncapped risk. Put the two payoff shapes next to each other and the long looks like a hockey stick pointing up-right with a floor at −100%, while the short looks like a hockey stick pointing down-right with a floor at +100% and no ceiling on the loss side.
There are good reasons to accept that trade anyway. Overvalued companies do fall. Frauds get exposed. Weak sectors bleed for months. Short sellers are often the only participants doing the unglamorous work of pricing in bad news that the crowd wants to ignore. But you never take the short casually, and you never take it without a defined exit, because the payoff geometry does not forgive the way the long side does. On a long, a frozen, hope-driven trader eventually hits a floor — the stock can only go to zero. On a short, a frozen trader has no floor at all. The math itself removes the safety net, and the trader's discipline has to replace it.
The mental reframe: you are borrowing a liability
A useful reframe that keeps beginners honest: when you go long, you own an asset that can rise. When you go short, you have created a liability — a debt denominated in shares that grows more expensive to repay every time the stock ticks up. You wouldn't casually take out a loan whose balance could triple overnight with no cap. That's exactly what an unhedged, unstopped short is. Treating the position as a liability to be managed, rather than a bet to be nursed, is the single largest mindset difference between traders who short for a living and traders who blow up doing it once.
The Mechanism: Borrow, Sell, Buy Back, Return
Let's slow down and walk the plumbing, because the mechanics are where most of the danger hides. Every one of these four steps has a hidden cost or a hidden risk that the price chart doesn't show you.
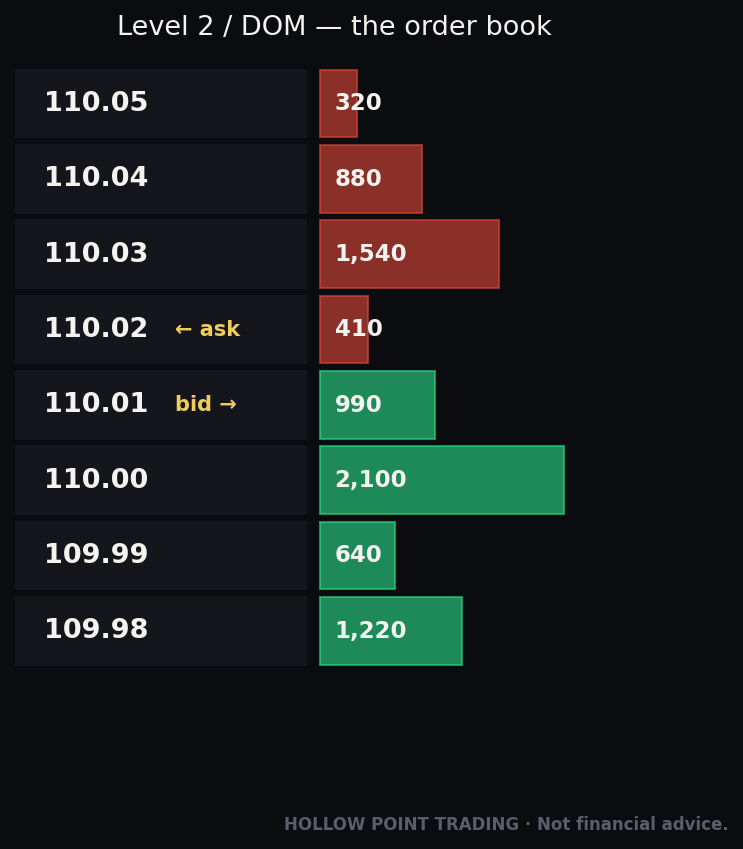
Step 1 — The locate and the borrow. Before your broker lets you short, it must "locate" the shares — confirm they can actually be borrowed. The lender is usually a big institutional holder (a pension fund, an index fund, a prime broker's pool) that owns the stock long-term and is happy to earn a little extra by lending it out. Your broker arranges the loan, often without you ever seeing the counterparty. You post collateral — this is a margin transaction by definition, meaning you're borrowing an asset, not just cash. If a locate can't be found, you simply can't short the name at that broker, full stop. This is why two traders at two brokers can have completely different experiences with the same ticker on the same day: one has shares to lend, the other doesn't.
Step 2 — The short sale. You sell the borrowed shares into the market. Cash lands in your account, but it isn't free money — it's held against the obligation to return the shares. Your account now shows a negative share balance: you are "short 100 shares," a debt denominated in shares, not dollars. The cash proceeds sit as collateral; you don't get to spend them, and depending on the broker you may earn little or no interest on them while the borrow fee bleeds out the other side.
Step 3 — The carry. While the position is open, you pay a borrow fee (more on this next) and, critically, you owe any dividends the stock pays. If XYZ pays a $1 dividend while you're short 100 shares, you pay $100 to the lender — because the person who bought your borrowed shares is entitled to that dividend, and so is the original lender. You cover both sides. There are also occasional special situations — spin-offs, rights offerings, special dividends — where the short is on the hook for the economic value of the corporate action. Time is not your friend on a short. Every day the position sits open, it costs you something, and around dividend dates and corporate events the cost can spike.
Step 4 — Buy to cover. To close, you "buy to cover" — buy the shares back on the open market and return them to the lender. Your profit or loss is the sale price minus the buyback price, minus fees, minus dividends paid. Once the shares are returned, the loan is closed and your obligation ends. The phrase buy to cover is worth sitting with, because it's the only exit that exists. A long can be closed with a sell that meets an eager buyer. A short can only be closed by buying — and if everyone needs to buy at once, you're all competing for the same shares.
The word to burn into memory is cover. Every open short is a future buy order that must eventually happen. This is not optional. Every share sold short is a share that has to be bought back someday. Hold that thought — it's the seed of the squeeze, and everything in the next several sections builds on it.
The buy-in: the risk that has nothing to do with price
There's a mechanic here that beginners never see coming because it isn't on the chart at all. Because your shares are borrowed, the lender can demand them back. If the lender wants to sell their position, or the broker can no longer source the loan (availability dried up), the broker can force you to close — a forced buy-in — at whatever the market price happens to be, whether you like it or not. You can be completely right on direction and still get mechanically ejected from the trade at the worst possible moment, because you never truly controlled the shares. You rented them, and the landlord called. Buy-ins cluster exactly when a name is getting hard to borrow — which is exactly when it's most crowded and most squeeze-prone — so the buy-in risk and the squeeze risk tend to arrive together.
The Borrow Fee and "Hard-to-Borrow"
Borrowing shares isn't free, and the price of borrowing tells you an enormous amount about the trade before you ever place it. The borrow fee is not a nuisance line item — it's a live sentiment gauge and a countdown clock, both at once.
The borrow fee (or "borrow rate") is an annualized interest rate you pay on the value of the shares you've borrowed. For a large, liquid, easy-to-borrow stock — think a mega-cap tech name — the fee might be a fraction of a percent per year. Nearly free. These are called easy-to-borrow (ETB) securities. There are so many shares available to lend that the loan is a commodity, and it barely registers on your P&L.
But when a lot of traders want to short the same name and shares get scarce, the fee climbs — sometimes to 20%, 50%, 100%, even several hundred percent annualized. These are hard-to-borrow (HTB) stocks. A high borrow fee is the market's way of saying "everyone already wants to be short this, and the shares to do it with are running out."
Doing the math on the bleed
Do the math on what that costs, because the annualized quote hides the daily sting. A 50% annual borrow fee on a $10,000 short position is roughly $13–14 per day bleeding out of your account, regardless of what the price does. If the stock goes sideways for three weeks — fifteen trading days — you've paid over $200 just to hold the seat. Push that to a 200% borrow rate and the same $10,000 position bleeds roughly $55 a day; a two-week hold costs you more than $500 before the price has moved a dime. The fee is quoted annualized but charged daily, and it can change daily as availability shifts. A borrow that was 30% when you entered can be 120% a week later if the crowd piles in behind you.
Here's a concrete worked example of the fee flipping a correct call into a loser. You short 500 shares of a $40 hard-to-borrow name — $20,000 notional — because you're convinced it drops. Borrow fee is 90%. That's about $49 a day. You're right, eventually: over 40 calendar days the stock grinds from $40 to $37, a $3 move, $1,500 of gross gain. But you paid roughly $49 × 40 ≈ $1,960 in borrow over those 40 days. Net, you lost about $460 on a trade where your directional read was correct. The chart said you won. The carry said you lost. On hard-to-borrow names, the carry has the final say.
The two things the fee is really telling you
- Crowding. A screaming-high borrow rate means the short trade is crowded. Crowded shorts are exactly the ones that squeeze, because they're packed with people who all have to cover through the same narrow door. The fee is, in effect, a real-time auction price for the privilege of being short — and when that price is sky-high, you are paying a premium to stand in the most dangerous spot in the market.
- Cost of being wrong slowly. Even if your thesis is right eventually, a fat borrow fee can turn a correct call into a losing trade if it takes too long to play out — exactly as the example above shows. Shorting isn't just "am I right?" — it's "am I right before the carry eats me?" The borrow fee turns every short into a trade against a clock, and the higher the fee, the faster the clock runs.
The practical rule of thumb: if the borrow fee is punishing, the market is already telling you the trade is crowded and dangerous. That's not a reason to feel smart about finding a hot short — it's a reason to be cautious, size down, or often to look for the trade from the other side entirely.
Short Interest and Days-to-Cover: Reading the Crowd
If every short is a future buy order, then the aggregate size of that pending-buy pile is a number worth watching. Two metrics measure it, and reading them together — with the borrow fee and the price action — is how you gauge whether a name is a safe short, a coiled squeeze, or something in between.
Short interest is the total number of shares currently sold short in a stock. It's often expressed as short interest as a percent of float — the float being the shares actually available to trade publicly (excluding locked-up insider and institutional holdings). If a stock has 100 million shares of float and 20 million are short, short interest is 20% of float. That's high. Anything in the 20%+ range gets attention; 30–40%+ is extreme and rare; occasionally a name prints over 100% of float short, meaning shares were borrowed, sold, borrowed again by the next short, and sold again — the same shares counted through multiple loans. That is a powder keg, because the number of shares that must eventually be bought back exceeds the number of shares freely available to buy.
Days-to-cover (also called the short ratio) is short interest divided by the stock's average daily trading volume. It answers a devastatingly simple question: if every short wanted out at once, how many days of normal volume would it take them to all buy back? If 20 million shares are short and the stock trades 5 million shares a day, days-to-cover is 4. If it trades only 1 million a day, days-to-cover is 20 — twenty days of buying crammed through a tiny door.
High days-to-cover is the single most important squeeze ingredient, because it measures trapped demand. A high number means the exits are narrow relative to the crowd trying to reach them. When shorts start covering, they can't all get out at once — they compete with each other for the same limited shares, and that competition drives price up, which forces more shorts to cover, which drives price up further.
Why the data is stale, and what to triangulate with
A caveat on the data that trips up a lot of beginners: in most markets short interest is reported on a lag — often twice a month with a settlement delay — so the published figure can be a couple of weeks stale. A stock that shows 25% short interest on the official print might be at 10% or 40% by the time you read it, depending on what's happened since. Borrow fee and availability, by contrast, update in near-real-time and are a live read on short crowding. Smart short-side analysis triangulates: stale-but-official short interest, live borrow fee, days-to-cover, and price behavior together. No single number is the tell. When the official short interest is old but the borrow fee just spiked and the stock is grinding up, the live signal is telling you the crowd is bigger than the last official print showed.
Reading the four dials as a combination
Here's how to read the combination, because the individual numbers matter far less than the pattern they form together:
- High short interest + high days-to-cover + high borrow fee + a rising price = squeeze conditions loading. The crowd is trapped, the door is narrow, holding costs are punishing, and price is already moving against them. This is the setup you either play from the long side or stay away from entirely — it is the worst possible place to initiate a fresh short.
- High short interest + low days-to-cover = crowded but liquid. Shorts can exit fast because volume is heavy relative to the short pile; the squeeze mechanism is weaker because the exit door is wide. A short here is still crowded, but the trapped-demand dynamic is muted.
- Moderate short interest + falling price + easy borrow = a workable short environment. The crowd isn't extreme, the carry is cheap, and price confirms the thesis. This is the quiet, unglamorous short that actually pays.
- Low short interest = whatever's moving this stock, a squeeze isn't the mechanism. Don't force the narrative. If a low-short-interest name is falling, it's falling on real selling, not on trapped shorts — which, ironically, can make it a cleaner short because there's no coiled spring underneath it.
How a Squeeze Is Born: The Feedback Loop
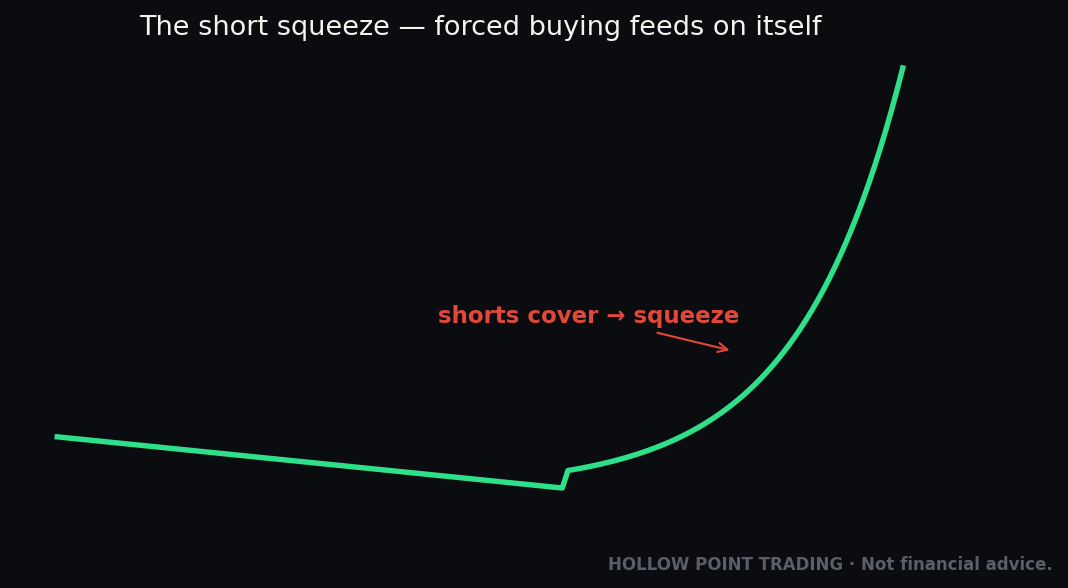
A short squeeze is a self-feeding loop where rising prices force shorts to buy, and that buying makes prices rise more. Understanding it as a mechanism rather than a mood is what separates people who trade it from people who get run over by it. A squeeze is not "the stock went up a lot." It's a specific chain reaction with specific fuel and a specific ending.
Start with the setup: a heavily shorted stock, high days-to-cover, expensive borrow. Every one of those shorts is sitting on a position that loses money as the stock rises, and each has a mental or margin-enforced pain threshold. The crowd looks calm from the outside, but it's a room full of people standing near the same small exit, each with a private number in their head at which they'll bolt.
Now a catalyst hits — earnings that weren't as bad as feared, a surprise buyer, a viral wave of retail buying, an insider purchase, a short-seller report getting debunked, anything that pushes price up. As price rises, the chain reaction begins:
- Shorts start losing money. The ones with the least conviction — or the least margin cushion — hit their pain point and buy to cover.
- That covering is buying pressure. It pushes the price higher.
- The higher price puts the next tier of shorts underwater and triggers margin calls — the broker demands more collateral or forces the position closed.
- Forced covering is more buying. Price rises again. Repeat.
Why the chart goes vertical: the sellers become buyers
This is a reflexive loop: the covering causes the rally that causes more covering. And notice what's happening to supply — this is the part beginners never internalize. The natural sellers who would normally cap a rally — the shorts — have flipped to the buy side. In a normal stock, when price rises, sellers step in and provide overhead resistance; that's what caps rallies. In a squeeze, the very people who'd normally be that resistance have become forced buyers instead. Sellers vanish, buyers stampede, and price goes vertical on air. A squeeze rally often looks insane on a chart precisely because there's no natural seller to absorb it — the shorts who'd sell are the ones being forced to buy, and the long holders who might take profit are watching a rocket and refusing to sell into it.
Squeezes are events, not trends
The fuel is finite, though, and this is the part that matters most for survival on both sides. A squeeze burns until the trapped shorts are mostly covered. Once the forced buying exhausts itself, the artificial demand evaporates and the stock frequently collapses back toward — or below — where it started, because the run was never built on real ownership demand. It was built on a debt being repaid in a panic. Squeezes are events, not trends. The move up is violent and the move back down is often just as violent. Traders who buy a squeeze late — after the vertical is already screaming — are buying the last of the forced demand, and they become the bagholders when the artificial bid disappears. The same discipline that keeps you from shorting into the vertical keeps you from chasing the long into the exhaustion.
Gamma: The Accelerant
Short covering alone can make a fierce squeeze. Add options, and you get a gamma squeeze stacked on top — the thing that turns a fire into a firestorm. The two are separate mechanisms that happen to point the same direction, and when they combine, the result is the kind of move that ends up in headlines.
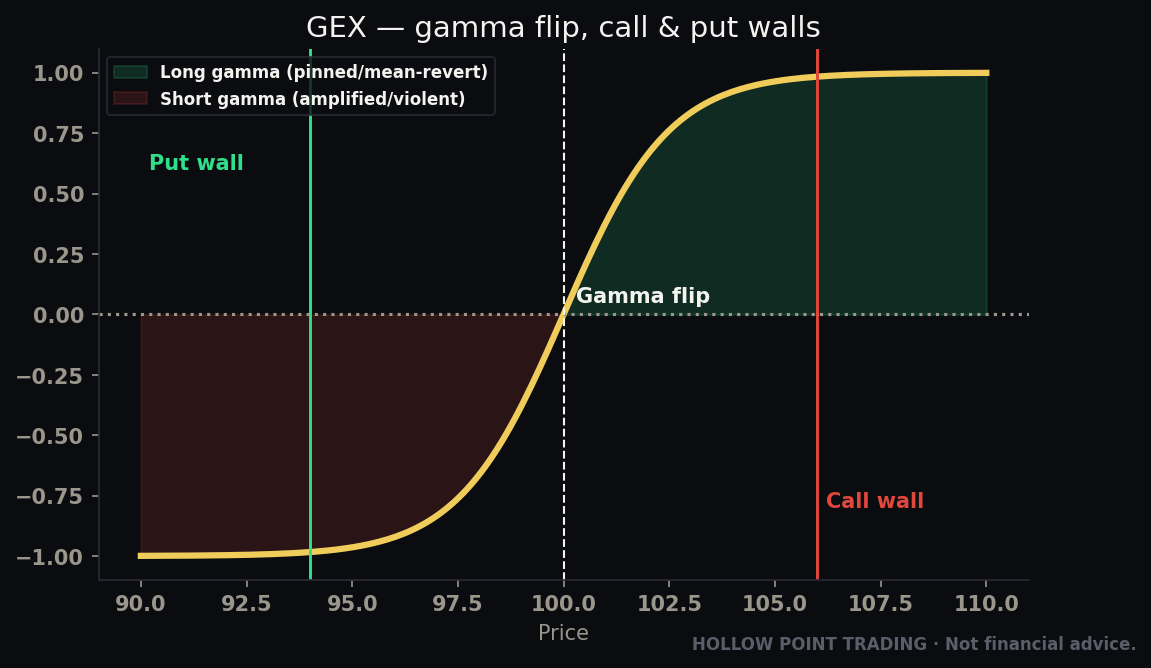
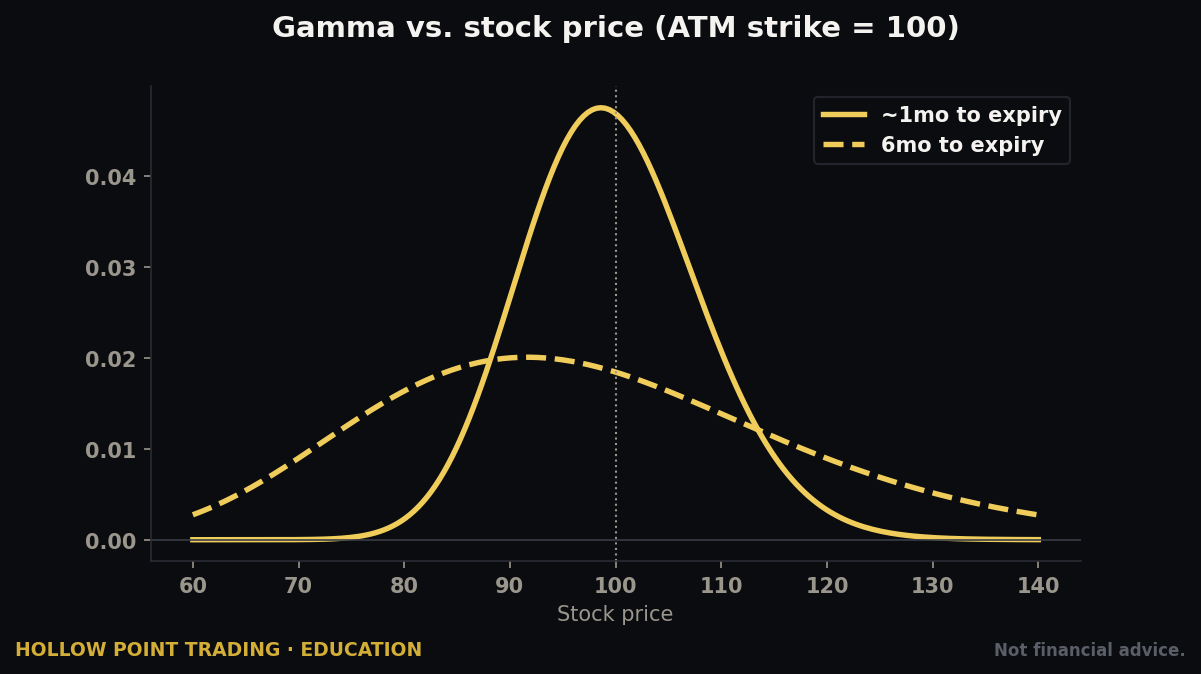
Here's the mechanism in plain English. When traders buy call options (bets that a stock rises), the market makers who sell them those calls are now short those calls and exposed to the stock rising. To stay neutral, the market maker hedges by buying shares of the underlying stock. The more the stock rises and the closer it gets to the call strike prices, the more shares they must buy to stay hedged — this sensitivity to price is called gamma. As price climbs into a wall of call strikes, dealer buying accelerates, because gamma is highest near the strikes and near expiration. It's not a linear hedge; it's a hedge that gets more aggressive exactly as price approaches the strikes where the most calls are stacked.
Two forced-buyer armies marching together
Stack that on a short squeeze and you have two forced-buyer armies marching in the same direction at once: shorts covering and dealers hedging, both mechanically buying more as the price rises, each feeding the other. Rising price forces shorts to cover, which pushes price higher, which drags price into the call strikes, which forces dealers to buy, which pushes price higher still, which forces the next tier of shorts to cover. This is the anatomy behind the most famous squeezes — a crowded short base lit by a catalyst, then supercharged by a flood of call buying that drags dealer hedging into the vertical. Neither army wants the stock to go up. Both are buying because the mechanics of their positions force them to. That's what makes the move so unnatural and so hard to fade.
Reading it through the GEX / options lens
For HPT purposes, this is where the GEX / options positioning read earns its keep. Call walls above price — strikes with large call open interest — become magnets first and then accelerants in a squeeze. Price gets drawn toward the big strike, and once it presses through, the dealer hedging above it can turn into a vacuum of buying. The gamma flip level marks where dealer behavior shifts from dampening moves (selling rallies, buying dips to stay hedged) to amplifying them (buying rallies, selling dips). Below the flip, dealers cushion the tape; above it, they add fuel. When you see a heavily shorted name with a stack of call open interest just overhead and price starting to press into it, and price sitting near or above the gamma flip, you're looking at the exact architecture of a gamma-fed squeeze. Read the walls. Don't invent them — but when they're there, respect what they can do. And note the symmetry: below the gamma flip, that same options positioning can accelerate downside too, which is precisely the regime where a clean short has the wind at its back.
Short Selling Across Market Regimes
The short side does not behave the same way in every tape, and one of the biggest tells that a trader is inexperienced is that they short the same way in a grinding bull market as they do in a risk-off collapse. The mechanics never change, but the odds and the character of the move change enormously. Read the regime first.
Trending down (risk-off): the short's home turf
This is the environment shorts are built for. Liquidity is tightening, the broad market is falling, money is rotating defensive, and the natural drift of prices is down. In a genuine downtrend, rallies are the anomaly and selling is the default, so a short is swimming with the current. Stops are more likely to hold because bounces run out of buyers quickly. Squeezes still happen — sharp counter-trend rips are a feature of bear markets, sometimes the most violent rallies of all — but they tend to fail at lower highs, which is exactly where a disciplined short wants to re-load. In a downtrend, the "505 rejection" (price rallying into the falling 55 EMA and getting rejected) prints over and over, and each one is a fresh, defined-risk entry. This is where the bulk of a short-seller's money is made.
Trending up (risk-on): fighting the current
Shorting into a raging bull market with easy liquidity is fighting the current — the market's natural drift is up, and that drift is a permanent headwind on every short. Dips get bought, breakdowns fail and reverse, and the "obvious" top keeps being higher. Borrow fees on the popular short targets stay elevated because everyone keeps trying the same doomed short. In this regime, most shorts should simply be skipped. The exceptions are individual names with genuine company-specific breakdowns — a fraud, a shattered growth story, a broken sector leader — where the stock is falling despite the tape, showing real relative weakness. Even then, size down, because a strong market can yank a broken name off its lows on nothing but beta.
Chop (rangebound): the carry killer
The sideways, rangebound tape is where shorts die quietly rather than violently. Price grinds inside a range, going nowhere, while the borrow fee bleeds the position every single day. There's no trend to carry you and no volatility to reach your target quickly. Worse, chop generates false breakdowns — price cracks the range low, you short the "breakdown," and it snaps right back into the range and stops you out. In a chop, the right short is a range trade: short the top of the established range with a stop just above it, cover at the bottom, and never hold through the middle hoping for a trend. If you can't identify a clean range edge, the correct short in a chop is often no short at all — you're just feeding the borrow fee.
High volatility (blowoff / event tape): size for the gap
When realized volatility is high — around earnings, macro prints, or in a panic tape — the short side becomes a game of gaps. Overnight moves of 10, 20, 30% become normal, and your stop is only as good as the next open. This is the regime where oversizing kills. A short that's perfectly sized for a calm tape is dangerously oversized for a high-vol tape, because the same position can gap five stops through your level before you can act. In high vol, cut size, widen the mental stop to account for noise but shrink the dollar risk to match, and treat every overnight hold as a decision, not a default. Some of the best short-side traders simply refuse to hold shorts through earnings, taking the position off before the print and re-entering after the dust settles — trading less, but keeping the gap risk off the table entirely.
Multi-Timeframe Treatment
A short is only as good as the timeframe alignment behind it, and the single most common way traders lose on a technically "correct" short is by taking a lower-timeframe signal that's fighting a higher-timeframe trend. The higher timeframe is the tide; the lower timeframe is the wave. You want them moving the same way.
Top-down, not bottom-up
Read the timeframes from the top down, not the bottom up. Start on the daily and weekly to establish the bias: is this stock in a downtrend, below a falling 55 EMA, making lower highs and lower lows? That's the tide. Then drop to the 4H and 1H to find structure — the levels, the trendlines, the value areas that frame the trade. Only then go to the 15m or 5m to time the entry — the actual rejection candle, the failed retest, the momentum roll. A beginner does the reverse: they see a bearish 5m pattern, short it, and only later discover the daily was in a roaring uptrend that erased their entry within the hour.
Weighting the timeframes
Not all agreement is equal — weight the higher timeframes. A short with the daily and the 4H and the 1H all aligned bearish is a fundamentally different animal than a 5-minute short fighting a bullish daily. The more timeframes agree on down, the more the trade earns its risk, and the larger you can (carefully) size. When timeframes conflict, the higher one usually wins over any horizon longer than a scalp, so a lower-timeframe short against a higher-timeframe uptrend should be treated as a quick, small, in-and-out trade with a tight stop — never a position you hold and hope on.
A concrete multi-timeframe stack
Concrete example. Daily: price below a downward-sloping 55 EMA, lower highs since the last earnings gap — bearish tide. 4H: a clean descending channel, price just tagged the upper trendline and the 55 EMA together — bearish structure and a level. 1H: price printed a lower high and rolled, RSI failed at 60 and turned down — bearish momentum. 15m: a bearish engulfing candle closes below the prior swing low — the trigger. Every timeframe points the same way, the entry is on the 15m, the invalidation is the 4H channel top, and the target is the channel bottom on the daily. That's a timeframe-weighted short with the whole ladder in agreement. Compare it to shorting a 15m engulfing candle while the daily is breaking out to new highs — same candle, completely different trade, and only one of them has the odds.
How It Fits the Top-Down Process
At Hollow Point we don't take trades in isolation — we go macro → sector → stock, then weigh the timeframes. Shorting bolts onto that framework cleanly, and the framework is what keeps the short side from killing you. Every filter you add before pulling the trigger is a filter that removes a squeeze trap you'd otherwise have walked into.
Macro first. Shorting into a raging bull market with easy liquidity is fighting the current, as we covered above — the market's natural drift is up, and that drift is a permanent headwind on every short. The best short environments are risk-off tapes: tightening liquidity, a falling market, defensive rotation, credit spreads widening, the VIX elevated and rising. Get the macro wind at your back before you lean short. When the macro is ambiguous, demand more from the stock-specific setup to compensate.
Sector next. Is the group weak? Shorting the weakest stock in the weakest sector aligns three forces — market, sector, and stock — all pointing down. Shorting a weak stock in a strong sector means the sector's strength is constantly fighting your trade; every time the group catches a bid, your name gets dragged up with it regardless of its own story. Relative strength cuts both ways: for shorts, you want relative weakness, a stock lagging its own group on the way down and failing to bounce when the group bounces. That relative-weakness tell is one of the highest-quality short signals there is, because it isolates a name the smart money is already distributing.
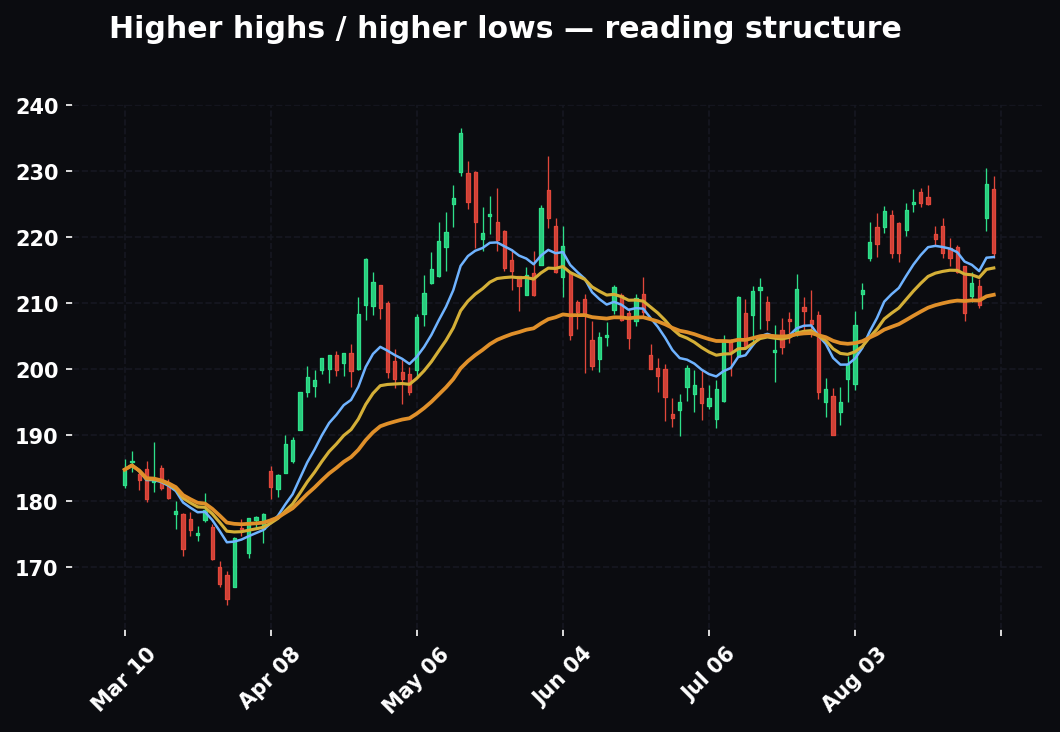
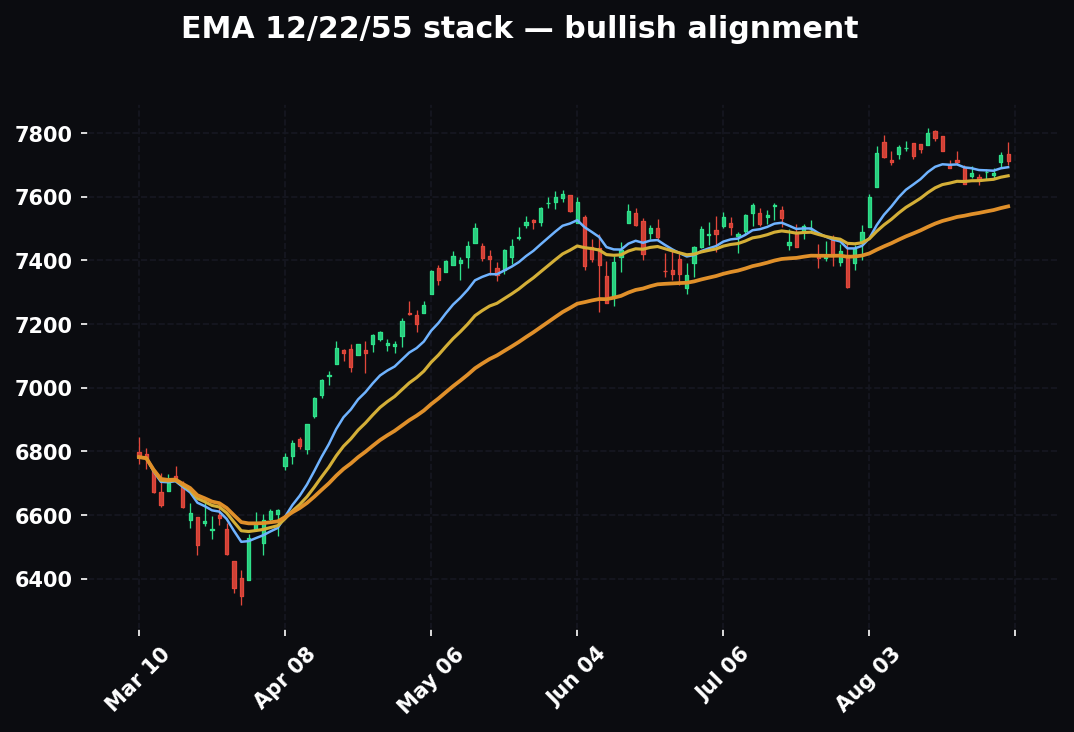
Then the stock and the trigger. Now the technicals. Our trend read is EMA 12/22/55 — for a short you want price below the stack, the fast EMAs below the slow, the daily 55 sloping down and acting as resistance overhead. A "505 rejection" — price rallying into the 55 EMA and getting rejected — is a textbook short trigger because it offers a tight, defined invalidation: you're wrong if price reclaims and holds above the 55. That precise invalidation is everything on the short side, because it converts uncapped risk back into defined risk. Without a clean invalidation level, a short has no honest stop, and a short with no honest stop is the trade that ends accounts.
Timeframe-weighted confluence. As covered, weight the higher timeframes and demand agreement across the ladder. The more timeframes agree on down, the more the trade earns its risk.
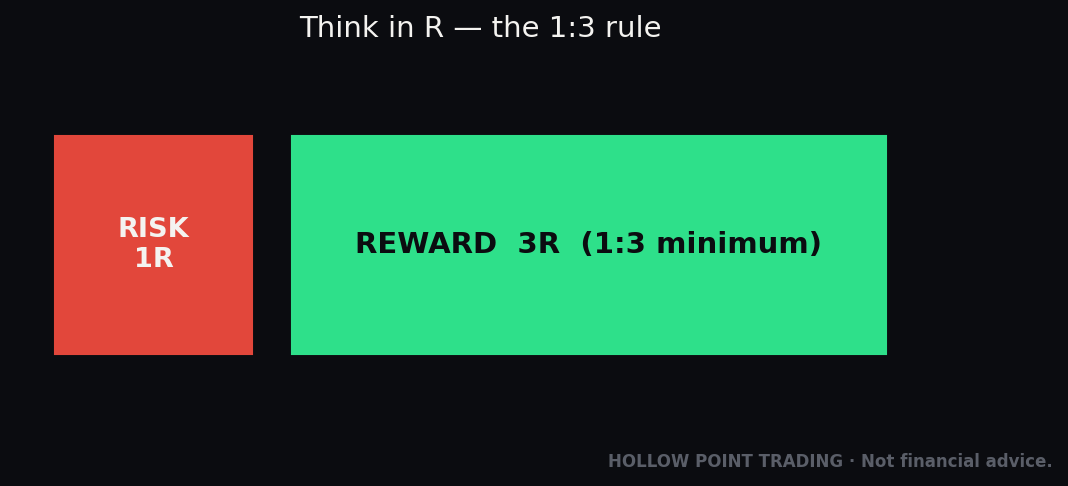
The 1:3 and discipline. Every HPT trade demands at least 1:3 reward-to-risk, and on the short side the risk leg is sacred because the downside is uncapped. Define your stop before you enter — the price that says the thesis is broken — and honor it mechanically. On a short, a blown stop doesn't just cost you the planned risk; in a squeeze it can gap through your level and cost multiples of it. Discipline over prediction isn't a slogan on the short side — it's survival. You can be dead right on the company and still be carried out feet-first if you size wrong and refuse to cover. The framework's whole job is to make sure that when you are wrong, you're wrong small.
Confluence: Stacking the Short With Other Tools
A short trigger in isolation is a coin flip with bad odds. A short trigger stacked with two or three independent confirmations is an edge. Here are the tools that combine most cleanly with a short setup, and how to read each one alongside the trend.
VWAP and anchored VWAP: the intraday battle line
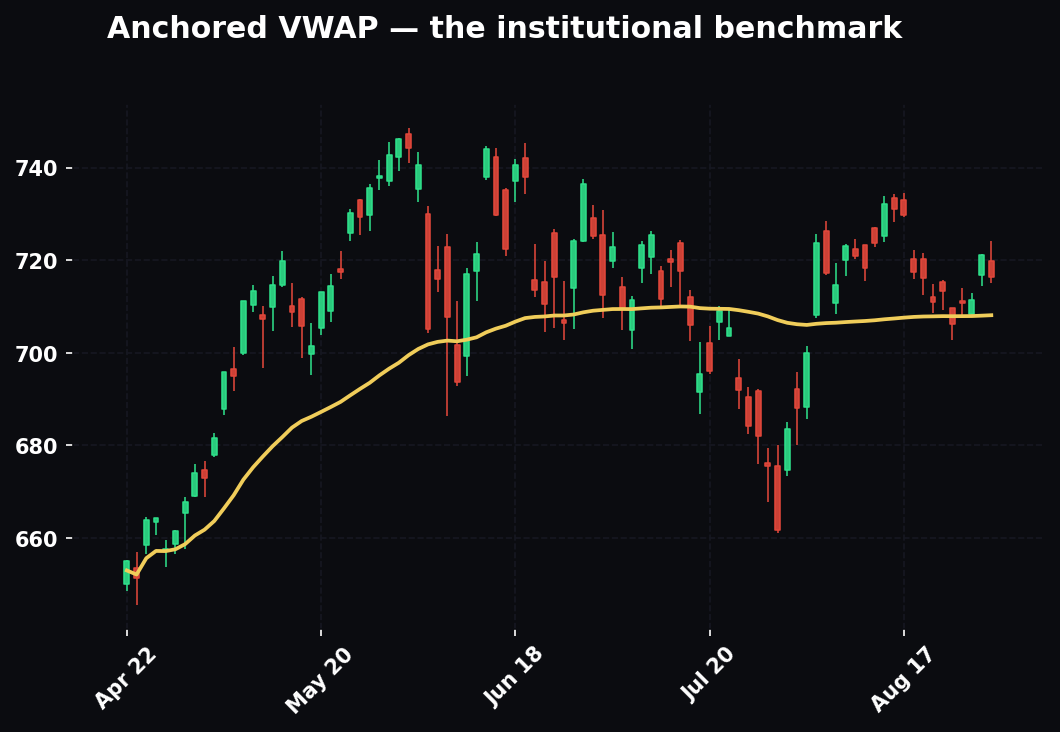
VWAP (volume-weighted average price) is the intraday line that institutions lean on, and for a short it's a natural resistance and invalidation reference. When price is below VWAP and rejecting it on each retest, sellers are in control — that's the tape confirming your short. A short entry on a failed VWAP reclaim (price pokes above VWAP, can't hold, rolls back under) gives you a tight, obvious stop: just above VWAP. Anchored VWAP — dropped from a significant high, an earnings gap, or the start of the down-leg — extends the same logic to the swing timeframe. If price rallies into an anchored VWAP from a major high and rejects, that's the higher-timeframe version of the same battle line, and it stacks beautifully with a 55 EMA sitting at the same price.
Volume profile: shorting the value-area edge
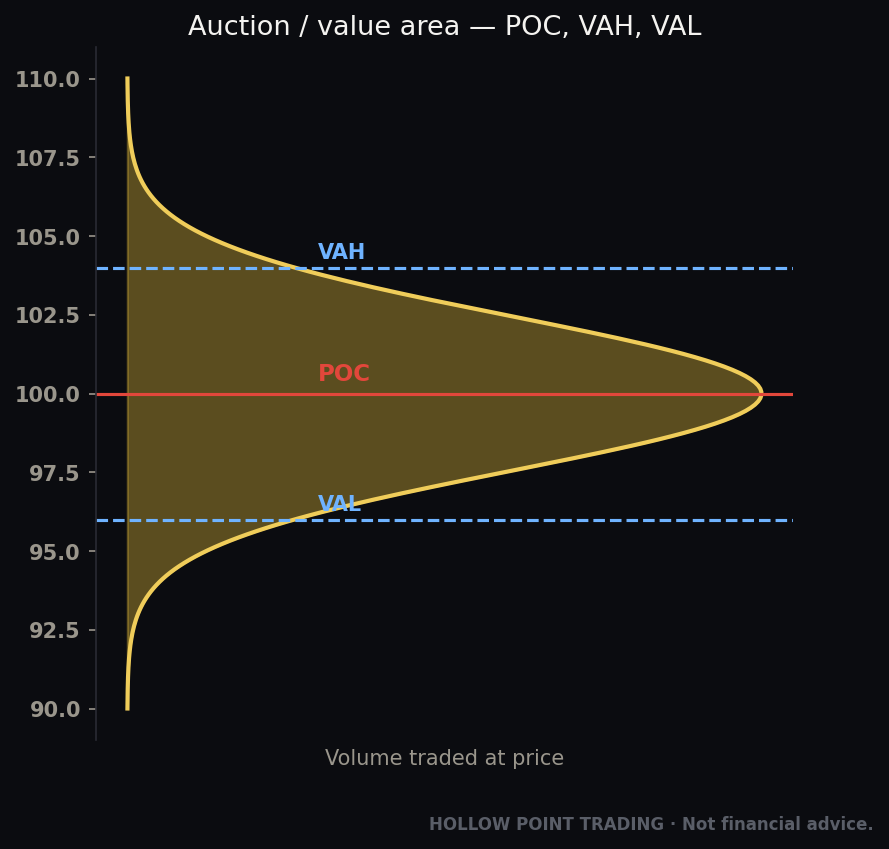
An anchored volume profile shows where the most trading occurred — the point of control (POC), the value area high (VAH), and value area low (VAL). For a short, the highest-quality entries cluster where price rallies into a high-volume node from below and stalls, or where it fails at the VAH of a distribution. Above value, the profile thins out into a low-volume "shelf" — price tends to move fast through those thin zones, which is exactly what you want your short's target path to look like: a quick slide through low-volume air down to the next high-volume node where you cover. Shorting into a thick node from above is fighting a magnet; shorting away from a node that just rejected price is riding the drop through thin air. Read which one you have.
RSI and MACD divergence: the momentum crack
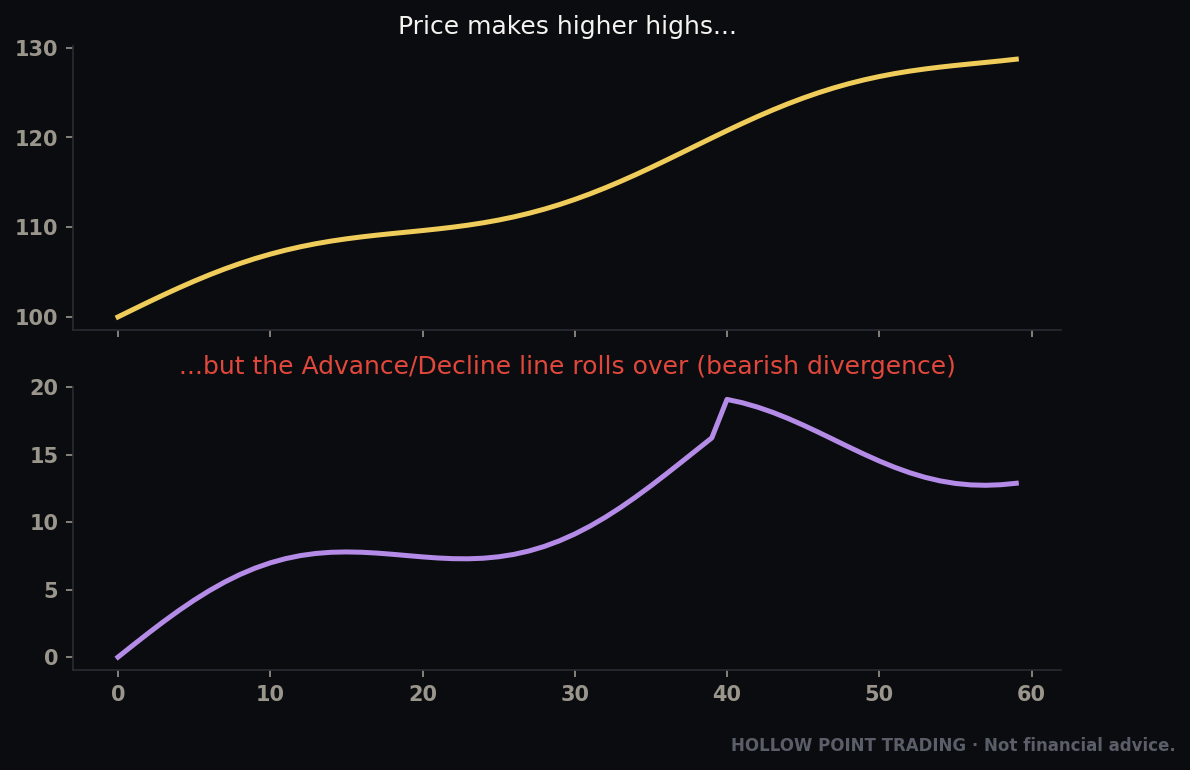
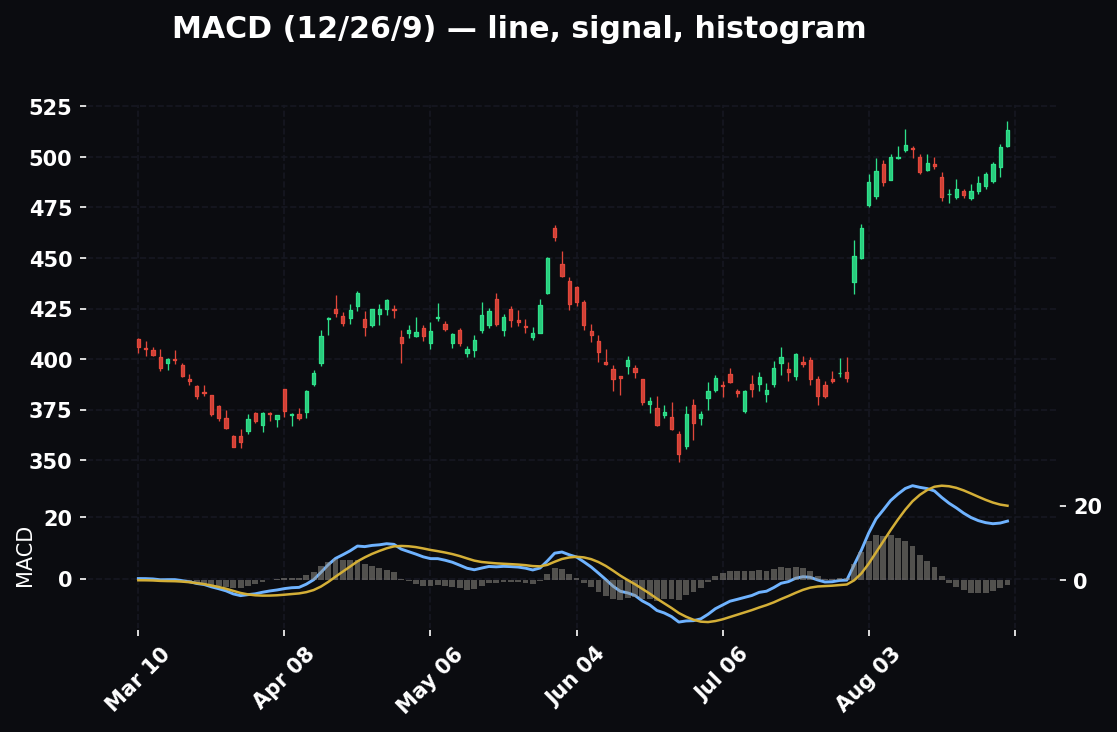
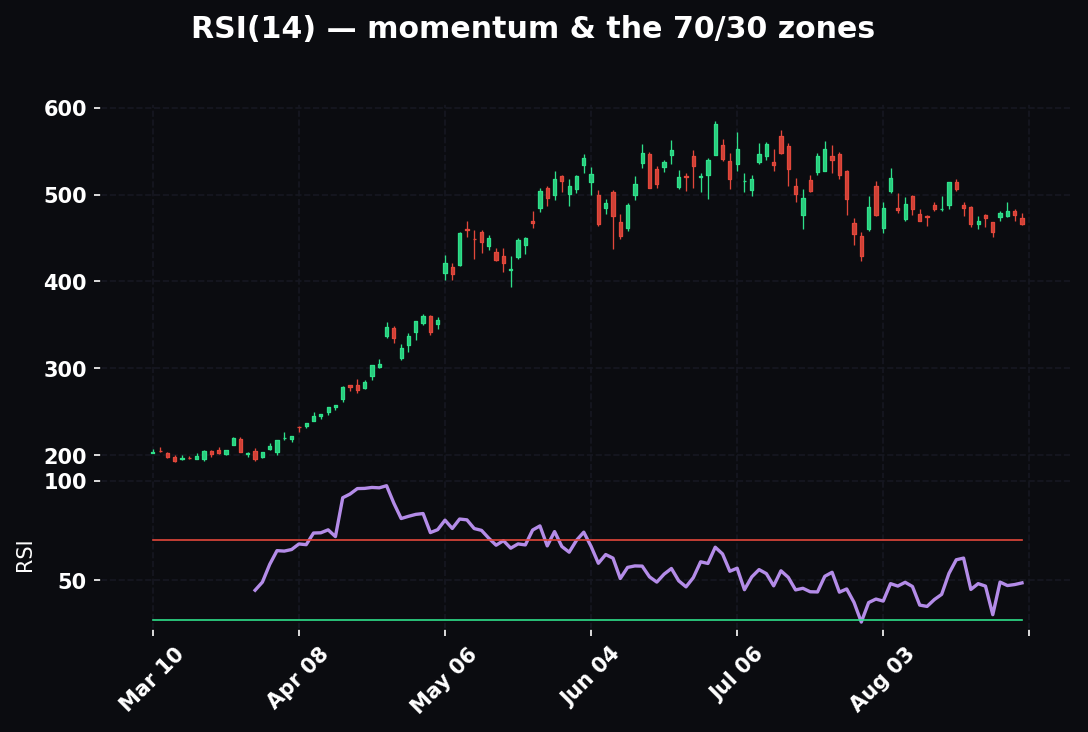
Momentum confirmation gives a short its timing edge. On the RSI, a bearish divergence — price makes a higher high while RSI makes a lower high — signals that the rally is running on fumes even as price ticks up, and it's a classic precursor to a rollover. Pair it with the trend: an RSI bearish divergence into a falling 55 EMA is a much stronger short than a divergence in the middle of nowhere. On the MACD, the tell is the line crossing below the signal after a rally, with the histogram flipping negative and expanding — momentum has turned and is accelerating down. When RSI divergence, a MACD bearish cross, and a 55 EMA rejection all land in the same window, you have three independent tools agreeing, and that's the kind of confluence that justifies a full-size, timeframe-weighted short.
GEX / options positioning: the regime filter
Finally, layer the options read over all of it as a regime filter. If price is below the gamma flip with put walls stacked below and thin call open interest overhead, dealer hedging is working for your short — moves get amplified downward, and a breakdown can cascade. If price is near a big call wall with heavy call open interest just overhead and sitting above the gamma flip, the same technical short setup is a trap, because dealer hedging is poised to amplify upside and any catalyst can trigger the gamma-fed squeeze we walked through earlier. Same chart, same EMA rejection, opposite trade quality — the options positioning is what tells you which regime you're in. Read the walls; never invent them; and when they line up under your short, that's the fourth pillar of confluence.
Worked Examples, Start to Finish
Numbers make it real. Here are three complete trades — one clean win, one disciplined loss, and one squeeze that shows why the discipline exists — each run through the whole process.
Example 1 — The clean win
Setup. Stock ABC trades at $50. Macro is risk-off, ABC's sector is the weakest on the board, and ABC is lagging even its weak peers — real relative weakness. On the daily, price sits below a downward-sloping 55 EMA. It rallies into that 55 EMA at $52 on light volume and prints a bearish rejection candle — a "505 rejection." RSI puts in a bearish divergence into the high; MACD rolls to a bearish cross. Short interest is 22% of float, days-to-cover is 6, borrow fee is a manageable 8%. Anchored VWAP from the last swing high sits right at $52 with the EMA — two battle lines at one price. Conditions align across four tools.
The plan. You short 200 shares at $51.50 as the rejection confirms. Your invalidation is a daily close back above the 55 EMA and anchored VWAP — call it $53.50. That's your stop. Risk per share = $2.00, total risk = $400. For 1:3, your target must be at least $6.00 lower: $45.50 or better. Prior support and the value-area low below suggest $44, which is even better than 1:3. Good trade.
Outcome. Over eight sessions ABC rolls over with the sector and slides through the thin zone below $50 down to $44, where the volume-profile node sits. You buy to cover 200 shares at $44. Gross profit = ($51.50 − $44.00) × 200 = $1,500. Subtract eight days of 8% borrow on ~$10,000 (a few dollars a day, call it $18) and you clear roughly $1,480 on $400 of risk — about 3.7:1. The macro-sector-stock stack did the work; the trigger got you a tight stop; the confluence gave you the conviction to hold to the target instead of covering on the first green candle.
Example 2 — The disciplined loss
Same setup, different outcome. You're in the identical trade — short 200 shares at $51.50, stop $53.50. But two days in, ABC gets an analyst upgrade before the open and gaps to $53. It grinds up all morning and closes at $53.80 — above your $53.50 invalidation. Thesis broken. You cover at ~$54 the next morning. Loss ≈ ($54 − $51.50) × 200 = $500. Slightly worse than the planned $400 because of the gap — a permanent feature of short risk — but you're out, small, and alive.
What you did not do was "wait for it to come back." That's the sentence that ends short-selling accounts. The upgrade could have been the start of a re-rating that took ABC from $54 to $70, and every dollar up is $200 of loss with no floor. Because your invalidation was defined before you entered and you honored it mechanically, a broken thesis cost you $500 instead of an open-ended disaster. The difference between a professional and a casualty isn't which outcome they got — it's that both outcomes were survivable by design.
Example 3 — The squeeze you didn't short
The setup you avoided. Stock DEF trades at $18, up from $12, and it's all over the retail feeds. It "looks" massively overextended — parabolic, overbought RSI, "obviously" due to crash. The beginner's instinct is to short it. You check the dials instead: short interest is 38% of float, days-to-cover is 9, borrow fee is 140% and climbing, and there's a wall of call open interest at the $20 and $25 strikes with price sitting well above the gamma flip. Every single squeeze ingredient is present and pointed up.
What you do. Nothing on the short side — or you look at the long squeeze setup with defined risk, which is the only sane way to touch it. Sure enough, a catalyst hits: DEF gaps to $22, shorts start covering, price presses into the $20 call wall and then the $25 wall, dealer hedging kicks in, and the thing prints $34 intraday before collapsing back to $19 two days later. The short who "knew it was overvalued" at $18 got run to $34 — nearly doubling their loss — and many got margin-called or bought-in at the highs. You made nothing, but you lost nothing, and in a squeeze that's a win. The dials told you exactly which side of the trade was the trap, and you listened.
How the Pros Short Differently From Beginners
The gap between a professional short-seller and a beginner isn't information — the beginner often knows all the same facts. The gap is in behavior: which trades they take, which they refuse, and what they do when the position moves against them.
Beginners short what's up; pros short what's already breaking. The beginner is drawn to the parabolic winner because it "has to come down." The pro shorts the name that's already rolling over — below its EMAs, making lower highs, lagging its sector — because a stock that's already broken has proven there are sellers, while a stock that's still ripping has proven there are only buyers. Fading strength is the beginner's tell; shorting confirmed weakness is the pro's habit.
Beginners see high short interest as confirmation; pros see it as a warning. To a beginner, 40% short interest means "everyone knows it's going down." To a pro, it means "40% of the float is a pile of forced future buyers sitting under this stock like a coiled spring." Same number, opposite conclusion. The pro either avoids the crowded short entirely or plays the squeeze from the long side.
Beginners size shorts like longs; pros size shorts smaller. Because the downside is uncapped and gaps skip stops, the pro's short position is deliberately smaller than the same-conviction long — often half the size or less in a high-vol tape. The beginner uses the same position sizing for both and gets destroyed the first time a short gaps against them overnight.
Beginners average up; pros never add to a losing short. When a short moves against them, the beginner "improves their average" by adding higher — pouring more into a position whose loss is uncapped, right as it's proving them wrong. The pro treats a losing short as a broken thesis to be exited, not a discount to be accumulated. Adding to a losing short is, mechanically, the fastest way to blow up an account, and pros know it.
Beginners hold through the catalyst; pros manage the gap. The beginner holds a short through earnings "because the number will be bad." The pro either takes the short off before the print to remove gap risk entirely, or sizes tiny to survive a gap either way. The pro respects that the overnight gap is the one risk a stop cannot protect against.
Beginners fixate on being right; pros fixate on the carry and the exit. The beginner asks only "will it go down?" The pro asks "will it go down before the borrow fee eats me, is there a clean invalidation, and is the reward at least 3x the risk?" Being right about direction is necessary but nowhere near sufficient on the short side, and the pro's checklist reflects that.
Beginners fight the tape; pros wait for the tape to turn. The beginner shorts strength in a bull market on conviction. The pro waits for the macro and the sector to roll first, then shorts weakness with the wind at their back. The pro is comfortable doing nothing for weeks while the environment is wrong for shorts — patience is itself an edge on this side of the book.
The Common Mistakes
1. Shorting purely because "it's overvalued." Valuation is not a catalyst and not a timing tool. Expensive stocks get more expensive for months, sometimes years. "The market can stay irrational longer than you can stay solvent" was written about short sellers. You need a catalyst and a trend, not just an opinion about fair value. A stock can be 40% overvalued and still double before it corrects.
2. Shorting the most heavily shorted name in the market. Beginners see 40% short interest and think "everyone knows it's going down." Wrong read. That crowded short base is squeeze fuel — a coiled spring of forced buyers. The highest short interest names are often the most dangerous to short, not the safest. If you must engage them, the smarter side is frequently the long squeeze setup, not piling into the crowded short.
3. Ignoring the borrow fee and the buy-in risk. Traders model the price move and forget the carry. A 200% borrow rate can make a correct short unprofitable, as the earlier worked example showed. And a buy-in can eject you regardless of your view, at the worst possible price. If a stock is that hard to borrow, the trade is already crowded and already dangerous — the fee is telling you so.
4. No defined stop — "averaging up." On a long, averaging down as price falls has a floor at zero. On a short, adding as price rises is adding to a position whose loss is uncapped, right as it's proving you wrong. This is the single mechanism that blows up more short accounts than any other. Your stop is not a suggestion. On the short side it's the only thing standing between you and unlimited loss.
5. Oversizing. Because the downside is uncapped and gaps skip your stop, position size on shorts must be smaller than the equivalent long, not the same. Size for the gap, not the plan. A short sized so that a 20% overnight gap is survivable is a short you can hold with a clear head; a short sized so that gap wipes a month of gains is a short that will eventually do exactly that.
6. Fighting the tape and the macro. Shorting strength in a bull market because you "know" it's a top. The trend, the macro drift, and the borrow carry are all against you simultaneously. Let the macro turn first. The cemetery of short-sellers is full of people who were eventually right about the top and broke long before it arrived.
7. Holding a squeeze "because it has to come down." It does, eventually — but the loop doesn't care about your solvency in the meantime. When a squeeze is running vertical, that is not the moment to be a hero on the short side. It's the moment your stop already got you out, ten dollars ago. Adding or holding into a live squeeze is choosing to stand in the fire because you're sure the rain is coming.
8. Confusing a fast drop with a good entry. Shorting a stock that's already down 15% on the day, into the hole, is chasing — you're selling to the shorts who are covering, right where a bounce is most likely. The good short entry is on the rally back into resistance, not on the vertical drop. Chasing weakness gives you a terrible average and a stop that's miles away.
9. Covering winners too early, holding losers too long. The asymmetry of the trade makes traders skittish on winners and stubborn on losers — the exact opposite of what the math demands. They cover a good short on the first green candle for a tiny gain, then hold a losing short past the invalidation hoping. Let the target and the stop, defined in advance, make those decisions instead of the fear.
10. Ignoring dividends and corporate actions. Getting short a stock right before its ex-dividend date means paying that dividend out of pocket, and special dividends or spin-offs can hit a short with unexpected costs. Check the calendar before you short; a "cheap" borrow can come with an expensive dividend attached.
11. Treating the reported short interest as live. Acting on a two-week-old short interest print as if it's current, without checking the live borrow fee and recent price action. The crowd may have already piled in — or already left — since the official number was set. Triangulate; never trust the stale print alone.
12. Having no plan for the gap. A stop protects you during the session; it does nothing against an overnight gap. Not deciding in advance how you'll handle a gap — reduce size before known events, hedge with a defined-risk option, or simply not hold through catalysts — leaves the one unstoppable risk completely unmanaged.
FAQ
Can I really lose more than I put in? Yes. That's the defining feature of the short side. If you short $10,000 of stock and it triples, you owe roughly $30,000 to buy it back — a $20,000 loss on a $10,000 position. A margin call or buy-in can force the closure, but the loss is real and can exceed your original capital. This is why size and stops matter more on shorts than anywhere else.
How long can I stay short? As long as you can post the collateral, keep paying the borrow fee, cover any dividends, and the shares remain available to borrow. There's no fixed expiry like an option — but the borrow fee is a rent that never stops, availability can dry up and trigger a buy-in, and the longer you hold, the more the carry erodes a correct call. Practically, most tactical shorts are days to weeks, not months, precisely because of the carry.
What's the difference between a short squeeze and a gamma squeeze? A short squeeze is driven by short sellers being forced to buy to cover as price rises. A gamma squeeze is driven by options market makers being forced to buy shares to hedge call options as price rises. They're separate mechanisms, but they often stack — a short squeeze that pushes price into a wall of call strikes triggers dealer hedging on top, and the two forced-buyer flows feed each other into a vertical move.
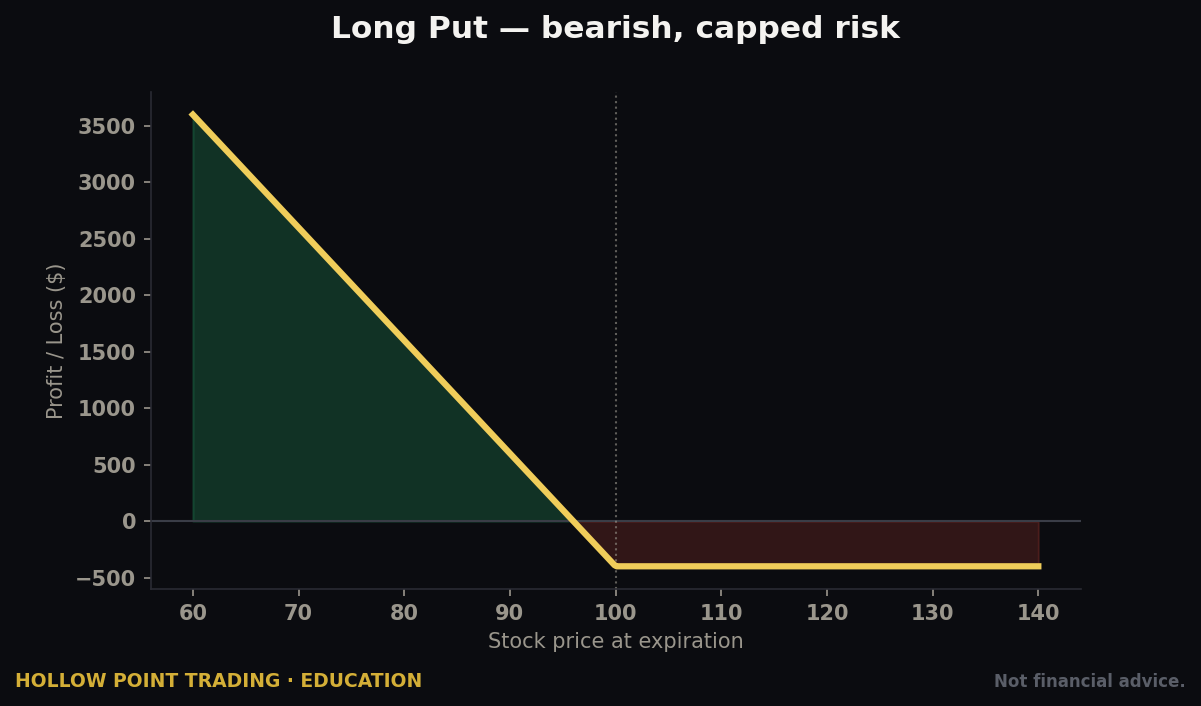
Is shorting the same as buying a put? No, though both profit from a falling price. A short has uncapped loss and an ongoing borrow cost. A long put has a defined, capped loss (the premium you paid) and no borrow fee, but it decays with time and needs the move to happen before expiration. For a beginner who wants downside exposure with survivable risk, a defined-risk put spread is often the more forgiving tool than an outright short — the loss can't run away from you.
Should beginners short at all? Cautiously, small, and only with a hard mechanical stop — or not yet. The short side punishes the exact bad habits (hoping, averaging, oversizing) that beginners are most prone to, and it does so with uncapped downside. Many traders are better served learning the long side first, and getting downside exposure through defined-risk options, until stop discipline is fully automatic.
How do I even find shortable setups? Top-down: risk-off macro, weak sectors, then individual names showing real relative weakness — below their EMA 12/22/55 stack, lower highs, lagging their group on bounces. Then wait for a defined trigger like a 55 EMA rejection with momentum confirmation. You're not hunting for the most-shorted name; you're hunting for a confirmed downtrend with a tight invalidation.
What if the borrow fee spikes after I'm already short? It happens, and it means the crowd piled in behind you. Recompute whether your target still clears your risk after the higher carry, and treat a spiking fee plus a rising price as an early squeeze warning. Sometimes the right move is to take the trade off — a fee that's tripled is the market telling you the trade got a lot more crowded and dangerous than when you entered.
Does a stock always fall back after a squeeze? Usually, because the run was built on forced buying rather than real ownership demand — when the fuel is spent, the artificial bid vanishes and price often collapses toward or below where it started. But "usually" and "eventually" are not "immediately," and the timing is unknowable. That's exactly why you don't short into a live squeeze betting on the collapse: you can be right about the ending and still be destroyed by the timing.
Cheat-Sheet: The Short Side on One Page
The mechanics
- Short = borrow shares → sell now → buy back later → return shares. Profit if price falls.
- You pay a borrow fee (annualized, charged daily) and owe any dividends while short.
- Every open short is a mandatory future buy order. Time works against you.
- Buy-in risk: borrowed shares can be recalled — you can be ejected regardless of price.
Read the crowd (the four dials)
- Short interest % of float: 20%+ notable, 30%+ extreme, >100% = powder keg.
- Days-to-cover: short interest ÷ avg daily volume. High = narrow exit = squeeze fuel.
- Borrow fee: high = crowded + costly. Live read on short crowding; can flip a correct call into a loss.
- Availability / HTB: hard-to-borrow means scarce shares and buy-in risk.
- Short interest prints are stale — triangulate with live borrow fee and price action.
Squeeze anatomy
- Setup: high short interest + high days-to-cover + expensive borrow.
- Trigger: any upside catalyst.
- Loop: price up → shorts cover (buy) → price up → margin calls → forced buying → repeat.
- Accelerant: gamma — call buying forces dealer share-buying into the same vertical.
- Ending: fuel is finite. Squeezes are events, then they collapse.
Regime read
- Downtrend / risk-off: the short's home turf — swim with the current.
- Uptrend / risk-on: fighting the current — mostly skip; only short confirmed relative weakness, small.
- Chop: the carry killer — range-trade the edges or don't short at all.
- High vol / event tape: size for the gap; consider not holding through catalysts.
The HPT filters
- Macro → sector → stock, all pointing down. Short weakness, not just "expensive."
- Trend: price below EMA 12/22/55, daily 55 sloping down = resistance. "505 rejection" = trigger.
- Timeframe-weighted confluence — read top-down (daily bias → 4H structure → 15m entry), weight the higher timeframes.
- Stack confluence: VWAP rejection + volume-profile edge + RSI/MACD bearish divergence + GEX regime.
- 1:3 minimum R/R. Define the invalidation before entry.
- Size smaller than a long — the downside is uncapped and gaps skip stops.
- Discipline over prediction. Honor the stop mechanically. Never add to a losing short.
Hard rules
- Never short the crowded favorite hoping for an easy win — that's the squeeze setup, from the wrong side.
- Never hold a running squeeze "because it has to come down."
- If the borrow fee is punishing, the trade is already crowded and already dangerous.
- Short the rally into resistance, never chase the vertical drop into the hole.
The short side isn't evil and it isn't forbidden — it's a legitimate, powerful tool, and short sellers do real work keeping frauds and fantasies honest. But it is the one trade where the math is stacked against your survival if you're sloppy: capped gain, uncapped loss, a clock that charges rent, and a crowd that can turn into a stampede of forced buyers the instant price ticks the wrong way. Respect the asymmetry. Trade it with a defined stop, a real catalyst, the macro at your back, confluence across your tools and timeframes, and size that assumes the gap. Do that, and shorting becomes just another edge in the book — a way to make money when everyone else can only watch their longs bleed. Skip the discipline, and it becomes the story of how the account ended.
Bound by rules, feared by trade.