
Most traders stare at a chart and see noise. Green bars, red bars, a squiggle that pumps their account up one minute and guts it the next. They cope by inventing stories — "the algos hunted me," "it's rigged," "the move made no sense." It made perfect sense. They just didn't have the lens.
There is one lens that dissolves more confusion than any indicator ever built: the market is a two-way auction. Not a chart. Not a random walk. An auction — the same mechanism as an art house selling a painting or a farmer's market pricing tomatoes, running continuously, second by second, driven by real orders from real participants who all want different things. Once you understand what an auction is trying to do and what it runs on, price stops being a squiggle and becomes behavior you can read.
This is the piece that reframes everything else in the Hollow Point method. We're going to build it from the ground up — what an auction is, how value gets discovered, where the fuel comes from, why price so reliably hunts the exact spots that just stopped you out, and how the same read scales from a one-minute scalp to a multi-week swing. We'll work real numbers on NQ and ES, walk through what changes when the market shifts from a grinding trend to dead chop to a high-volatility gap-and-go, and stack auction theory against the tools you already run so the confluence is doing something instead of just decorating your screen. By the end you'll look at Monday's open and see a process, not a mystery.
The Concept: A Market Is a Two-Way Auction Searching for Fair Value
Forget candles for a second. Picture an open-outcry pit, or better, a live auction house. There are buyers who want to buy as cheaply as possible and sellers who want to sell as dearly as possible. The auction's entire job is to find the price where the most business gets done — the price both sides are willing to transact at right now. That price is not fixed. It moves as participants change their minds, as new information arrives, as size steps in or steps away.
Economist and trader J. Peter Steidlmayer formalized this decades ago at the Chicago Board of Trade with Market Profile, and the core idea is disarmingly simple: the market moves higher to shut off buying and lower to shut off selling. Read that twice. When price rises, it's not celebrating — it's advertising higher and higher prices to find the level where buyers refuse to pay more. When it falls, it's advertising lower prices to find where sellers refuse to sell any cheaper. The auction is constantly probing in both directions, asking a question: "Is anyone here? Is this a fair price? Will you do business with me at this level?"
Acceptance and rejection: the only two answers
Two words define everything the auction does: acceptance and rejection.
- Acceptance is when price moves to a level and stays. Trade happens there. Time passes there. Both sides agree it's fair enough to do business. Volume builds. Bars close and re-open around the level rather than spiking away from it.
- Rejection is when price moves to a level and snaps back fast. One side shows up hard, the other vanishes, and the auction is told "that price is not fair — get out." You see it as a long wick, a fast reversal, a spike that doesn't hold.
That's the whole game in two words. Price is always doing one of these things, everywhere, on every timeframe. The auction advertises a price; the market either accepts it (and value migrates there) or rejects it (and value stays where it was). Your job as a reader is to watch the auction ask its question and listen to the answer — not to guess the answer before it's given.
The fractal nature: it's auctions all the way down
Here is the property that makes this so powerful: the auction is fractal. The exact same acceptance/rejection behavior plays out on a one-minute chart, a fifteen-minute chart, and a daily chart simultaneously — they're just nested auctions running at different clock speeds. A one-minute rejection inside a fifteen-minute acceptance inside a daily rejection is not a contradiction; it's three auctions at three time horizons each doing their own thing. Most trader confusion comes from reading one timeframe's answer and applying it to a different timeframe's question. We'll untangle that in the multi-timeframe section, but plant the flag now: the mechanism is identical at every scale. Learn it once and you've learned it for every chart you'll ever open.
Value Areas: Where the Auction Agrees Business Is Fair
If the auction is a search for fair value, then "fair value" needs a definition you can actually mark on a chart. That's what a value area is.
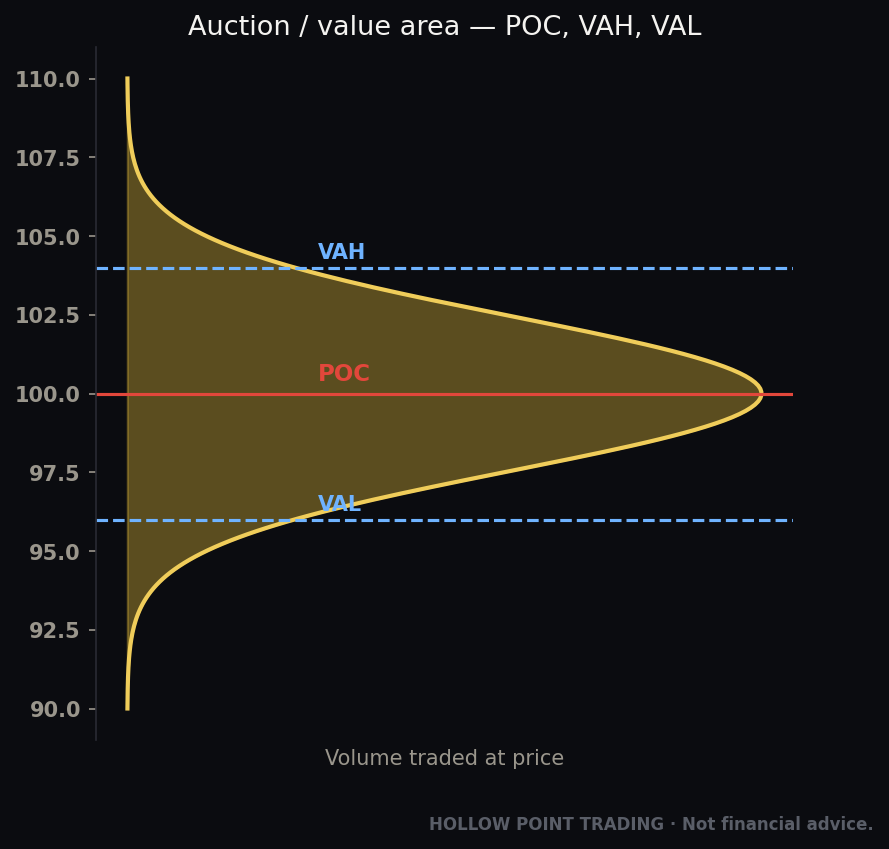
Over any given period — a day, a week, a session — price spends most of its time in a relatively tight band and only briefly visits the extremes. Plot how much time and volume occurred at each price and you get a distribution, usually shaped like a lopsided bell curve. Three levels come out of it, and these are the bones of auction trading:
- POC (Point of Control): the single price with the most volume/time. The fairest price of the period. The magnet. The center of gravity where both sides did the most business.
- VAH (Value Area High): the top of the zone containing roughly 70% of the period's activity.
- VAL (Value Area Low): the bottom of that same 70% zone.
The band between VAH and VAL is the value area — the region the auction has agreed is fair. Everything outside it is, by definition, an area the auction explored and rejected (at least so far). This is the single most useful frame you can put on a chart, and TradingView's Volume Profile / Fixed Range Volume Profile draws it for you.
Balance versus imbalance — the core distinction
Here's why value areas matter so much. Markets are mean-reverting inside value and trending outside it. When price is inside the value area, it tends to rotate — up to VAH, reject, down to VAL, reject, back to POC. That's balance. When price breaks out of value and gets accepted outside it, the auction has decided the old fair price is wrong and it's off to discover a new one. That's imbalance, or a trend. The entire difference between "chop that kills breakout traders" and "the clean trend everybody wishes they'd caught" is whether price was accepted outside value or rejected back into it.
Think of balance as a rubber band and imbalance as a slingshot that's already been released. Inside balance, the further price stretches from POC, the more the band wants to snap it back — so the edges are where you fade toward the middle. In imbalance, that band has broken; there's nothing pulling price back, and fading is stepping in front of a released slingshot. Ninety percent of blown accounts come from applying balance logic (fade the edge) to an imbalanced market (which just keeps going).
The shapes profiles make, and what each one says
The shape of the profile is itself a message. Learn to read three:
- D-shaped (normal, fat middle): classic balance. A big fat POC in the center, thin tails. This is a market at rest, comfortable with fair value. Rotational. Fade the edges.
- P-shaped (fat top, thin tail below): short-covering or a trend that ran up and then balanced at the highs. The thin lower tail is a区域 the auction rejected quickly on the way up. Often marks the end of a move, not the middle — be careful buying the fat top.
- b-shaped (fat bottom, thin tail above): the mirror — long liquidation or a down-move that balanced at the lows. The thin upper tail was rejected fast. Often marks exhaustion of the selling.
When you see a session building a lopsided P or b, you're being told which direction the auction already spent its energy. Fresh D-shapes forming are balance you can rotate inside; P's and b's forming after a run are the auction catching its breath before it either continues or reverses.
The open-versus-prior-value playbook
Steidlmayer's crowd built a simple rulebook around today's open relative to yesterday's value area, and it still holds up decades later:
- Open inside prior value → expect balance/rotation. Fade the edges toward POC. Lower conviction on breakouts. This is the market's default and covers the majority of sessions.
- Open outside prior value, then back in → failed auction; expect a run to the opposite edge of value. One of the highest-conviction reversal setups that exists, because a rejected breakout has proven the breakout side had no follow-through, and the auction now has an entire value area to traverse.
- Open outside value and stays outside → imbalance; the auction is trending to find new value. Trade with* it, not against it. Gap-and-go days live here.
There's a fourth, subtler case worth naming: open right at the edge of prior value. This is the coin-flip open. Let the first 15–30 minutes resolve which side of the edge price accepts, then treat it as an "inside" or "outside" open accordingly. Don't force a direction on an edge open before the auction has voted.
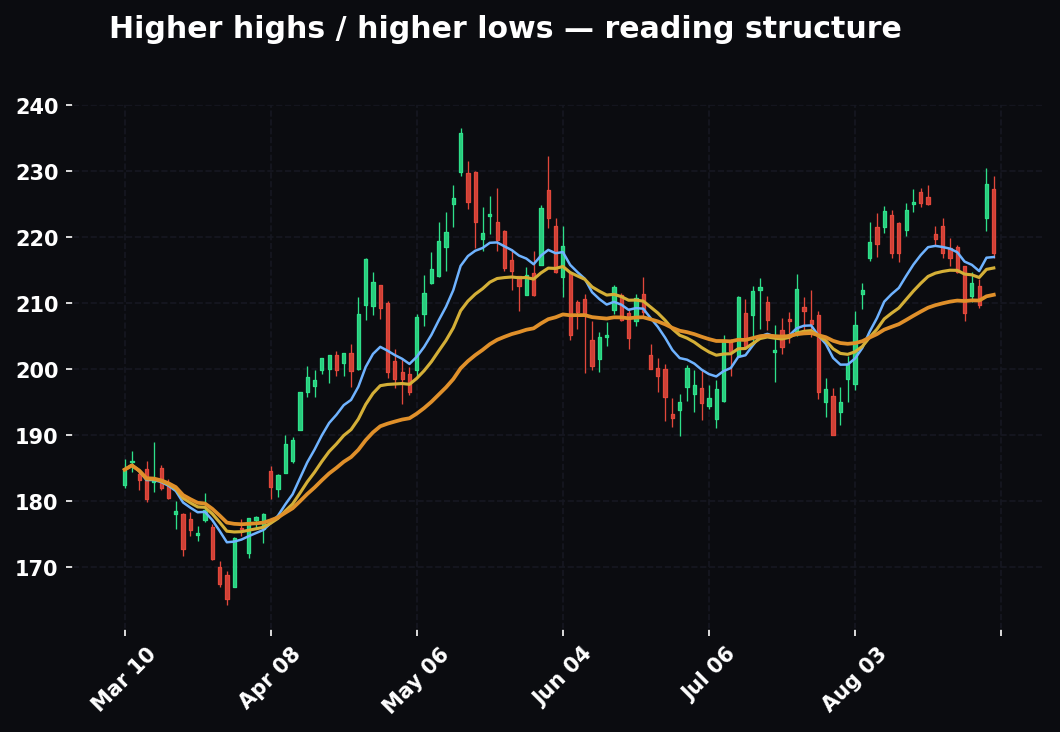
Initial Balance: The Opening Range That Sets the Table
The auction doesn't wake up knowing where fair value is. It has to find it, and the finding starts at the open. The Initial Balance (IB) is the range established in the first hour of trading — the first two 30-minute periods in classic Market Profile. It's the market's opening bid and offer, the first attempt to bracket where business will get done.
The IB matters because it becomes the reference the rest of the session auctions against. Two things can happen:
- IB holds all day (range day): neither side can push price beyond that opening hour with any conviction. The auction stays balanced. These are rotational, fade-the-edges days. Roughly the market's "boring" default and, honestly, most days.
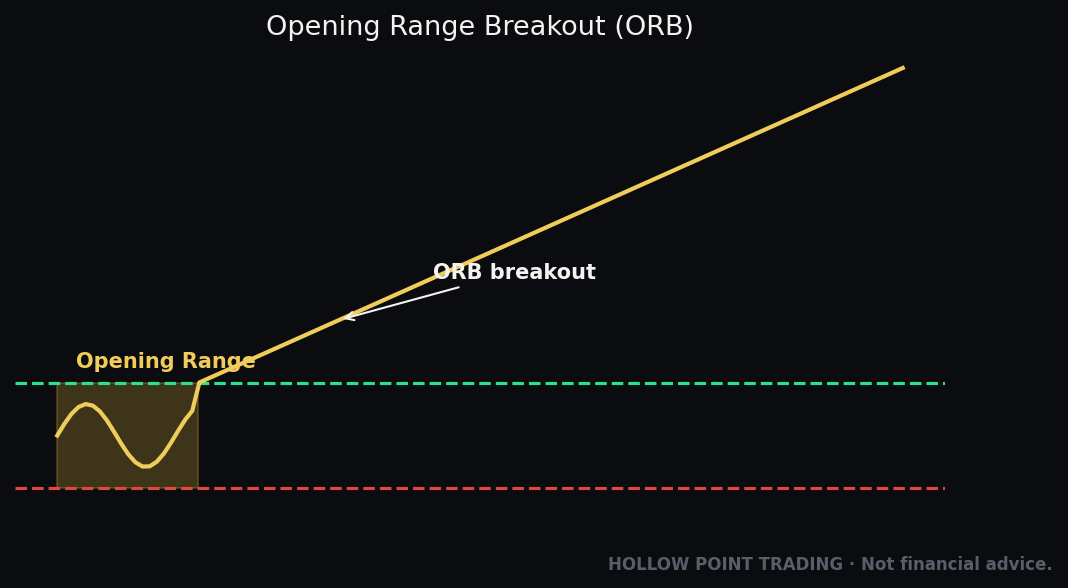
- IB extension (trend day): one side overwhelms the other and price breaks the IB high or low and keeps going — this is called range extension. When it happens early and holds, you often get a trend day, where price opens near one extreme and closes near the other. These are the days that pay, and they announce themselves by breaking IB with acceptance.
Reading IB width — a tell most people miss
The width of the IB is a forecast. A narrow IB means the first hour was coiled and indecisive — which loads the spring. Narrow IBs are far more likely to see range extension later, because the opening hour didn't express the day's energy; it stored it. A wide IB means the first hour already did a lot of work; the day has "spent" much of its expected range early, so a wide IB more often becomes the day's range and holds. Rule of thumb on NQ: an IB under about 60–70 points in normal volatility is "narrow, watch for extension"; an IB over 150 points is "wide, likely the range." These aren't laws — scale them to the current ATR — but the relationship (narrow coils, wide contains) is durable.
IB extension with acceptance versus the fakeout
The practical read: mark your IB high and IB low after the first hour. A clean break and hold beyond one of them, especially with volume, tells you the auction has picked a direction and is extending to find new value. A poke beyond that immediately gets rejected back inside tells you it's a range day — fade the extremes. You've just pre-classified the day's character from the first hour, before most traders have finished their coffee.
The trap is the IB fakeout: price breaks IB high by a few ticks on thin volume, sucks in breakout buyers, and reverses straight back through the IB and toward the IB low. This is a range day wearing a trend-day costume, and it's a stop run in miniature (more on that shortly). The filter is always the same — did price accept beyond IB (time + volume holding out there), or just poke it? One 30-minute period closing and building volume outside IB is acceptance. A wick and an immediate return is a fakeout you fade back into the range.
For NQ and index futures, the overnight session (Globex) builds its own profile and its own IB behavior around the cash open at 8:30 CT — the cash open is often where the real auction begins and the overnight inventory gets corrected. An overnight that ran price far from the prior cash close frequently sees the cash session "fade the overnight" in the first hour as real-money participants correct an inventory that got pushed around in thin globex liquidity. Always know where the overnight high, overnight low, and prior cash close sit before the bell.
Liquidity: The Fuel the Auction Actually Runs On
Now the part almost nobody teaches properly, and the part that turns everything above from theory into edge.
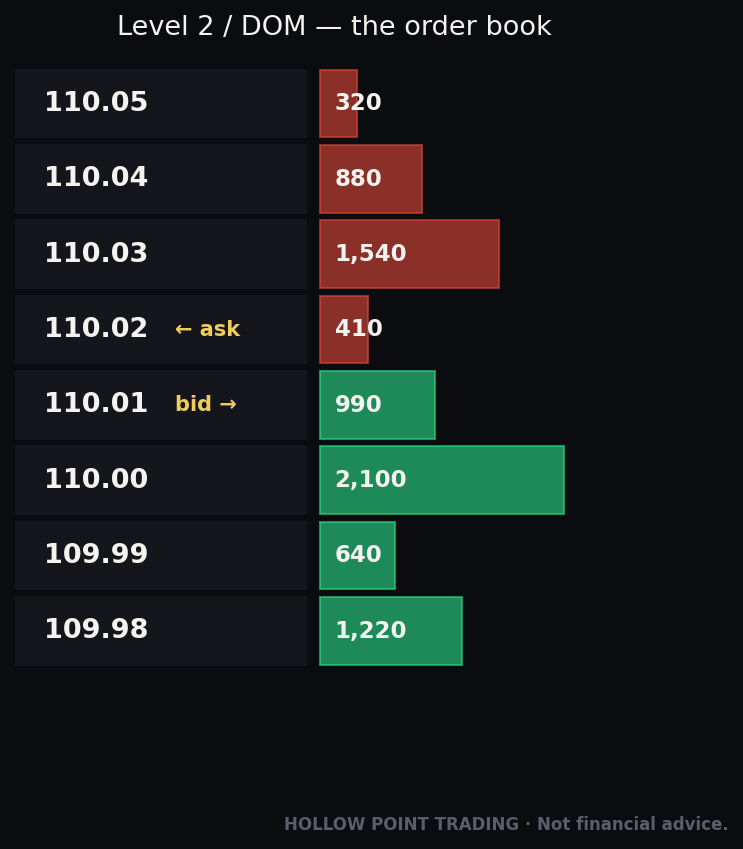
An auction can't move without someone to transact with. Price only travels from one level to the next if there are resting orders there — orders already sitting in the book waiting to be filled. That pool of resting orders is liquidity, and it is the literal fuel of price movement. No orders to hit = no trade = price stalls. A big cluster of orders = a place price can unload into = a magnet.
Where do these resting orders live? Two big categories, and this is the whole secret:
1. Resting limit orders — passive buyers and sellers who've placed orders at specific prices and are waiting. Institutions with size to move can't just market-buy 5,000 contracts; they'd move the price against themselves catastrophically — a phenomenon called slippage or market impact. They need liquidity to absorb their size. So they hunt for places where lots of orders are stacked, and they often work their order patiently, feeding it in where the book is thick.
2. Stop orders — and here's the kicker. A stop-loss to sell is a resting sell order that activates when price drops to it. A stop-loss to buy (used by short sellers) is a resting buy order that activates when price rises to it. Stops are liquidity. When a cluster of stops gets triggered, it dumps a pile of market orders into the book all at once — exactly the liquidity a large player needs to fill a position. A stop cluster is essentially a pre-loaded pile of fuel with a tripwire in front of it.
The counterintuitive core: your stop is someone's fill
Sit with the mechanics one more beat, because this is the idea that rewires how you see charts. When your sell-stop below the low triggers, it fires a market sell — and a market sell can only execute if someone is buying. That someone is frequently the large participant who wanted price down there precisely so your forced sell would fill their buy. Your risk management is their liquidity source. This isn't a conspiracy; it's the plumbing. Once you internalize that your stop-loss is literally a resting order that a bigger player can see the footprint of and target, you stop placing it where everyone else places theirs.
Where stops cluster — the reservoir map
Where do stops cluster? Exactly where you'd put yours, because you and ten thousand others were taught the same spots:
- Just below obvious swing lows (longs' stops)
- Just above obvious swing highs (shorts' stops)
- Just beyond round numbers (23,000 on NQ, 6,000 on ES — psychological magnets)
- Beyond prior day high/low (PDH/PDL), session high/low, IB high/low
- Under/over trendlines and moving averages everyone watches
- Beyond the value area edges (VAH/VAL)
- Beyond overnight high/low and the prior week's high/low on higher timeframes
These are liquidity pools — predictable reservoirs of resting orders sitting in plain sight. The more obvious and more-tested a level is, the more stops pile behind it, which is the great irony: the cleaner the level looks to you, the juicier a target it is for a sweep. And once you understand that price needs these pools as fuel, the single most confusing market behavior in the world suddenly makes total sense.
Reading relative pool size
Not all pools are equal, and part of the skill is ranking them. A level that's been tested twice and held has more stops behind it than a level touched once, because each successful hold recruits more breakout traders and trend-followers who all tuck stops behind it. A round number that also coincides with the PDH and the value-area high is a stacked pool — three reasons for stops to sit in one spot. Price is drawn to the biggest, most-obvious pools the way water finds the lowest point. When you're deciding which of two lows price is likely to hunt, ask: which one has more history, more obviousness, more confluence of reasons for the crowd to hide stops behind it? That one is the magnet.
Why Price Seeks Liquidity: The Stop Run Decoded
Here's the scenario every new trader has lived and cursed: You buy the breakout above a clean swing high. Price ticks up two points, reverses hard, blows straight through the low, stops you out — and then rockets in your original direction without you. You got "hunted." You did everything the textbook said. You still lost.
You weren't unlucky. You were the liquidity.
Reframe it through the auction. A large participant needs to buy size. To buy, they need sellers — a lot of them, at once. Where's the biggest pile of resting sell orders? In the stops sitting below that obvious swing low, where every breakout-buyer and trend-follower placed their protective stop. So the auction gets pushed down into that pool. The stops trigger, firing a cascade of market-sell orders into the book. The large player quietly absorbs all of it — buying everything those panicked stops are selling — and now, fully positioned, lets price go where they wanted it all along: up.
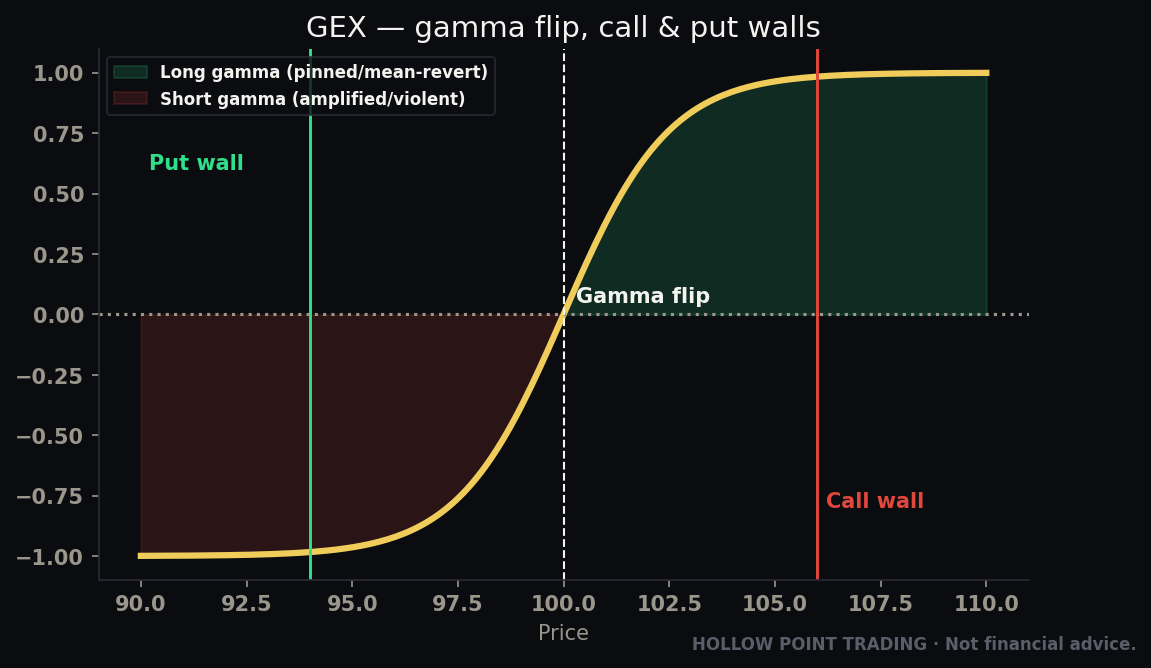
That move down wasn't a failure of your analysis. It was the auction doing exactly what it exists to do: seeking liquidity to facilitate trade. The sweep below the low, the fast reversal, the run — that's not manipulation in some shadowy sense; it's the mechanical reality of how large orders get filled in a market that runs on resting liquidity. The formal name in auction terms is a liquidity grab or stop run; the Wyckoff tradition calls the version at a bottom a spring and at a top an upthrust. Same animal, different vocabulary.
The anatomy of a clean grab
Break a textbook stop run into its parts so you can recognize one in real time:
- The setup: an obvious level with a pool behind it (clean swing low, tested twice, everyone can see it).
- The approach: price grinds toward the level, often slowly, sometimes with declining momentum — the auction "walking price into the pool."
- The sweep: a sharp acceleration through the level. Fast. This is the stops cascading. Volume spikes.
- The failure to accept: price does not build value beyond the level. No bars close and hold out there. Within one to three bars it's back inside.
- The reclaim: price closes back on the origin side of the level, often with a fat rejection wick. This is the confirmation.
- The drive: the real move, in the direction opposite the sweep, toward the value area or the next pool.
The tell is always the same and it ties straight back to acceptance vs. rejection: price pokes beyond an obvious level, grabs the liquidity, and gets violently rejected back. The wick beyond the level is the fuel being consumed. The snap back is the auction announcing the real direction. A stop run is just rejection at a liquidity pool — and it's one of the highest-quality signals a chart can give you, because it shows you where the size actually was.
The failed grab — when the sweep is real
Discipline demands you know the inverse: sometimes a break of the level is not a grab but genuine acceptance. Price sweeps the low, and instead of reclaiming, it builds value below — bars close down there, volume grows, the reclaim never comes. That's not a stop run; that's a breakdown, and if you shorted the "reclaim" that never confirmed, you're now long-biased into a real trend down. This is why the reclaim is the trigger, never the sweep itself. You do not front-run the grab hoping for the reversal. You wait for price to prove rejection by closing back inside. No reclaim, no trade — the sweep might be the start of imbalance, not the end of it.
Amateurs versus professionals in one sentence
This is the difference between amateurs and professionals in one sentence: amateurs put stops where liquidity pools form; professionals hunt those pools and fade the grab. You don't have to become the hunter with institutional size. You just have to stop being the hunted — and better, learn to enter after the grab, in the direction of the rejection, with your risk defined by the sweep itself. The sweep that stopped out the crowd becomes the exact structure that defines your risk: your stop goes just beyond the wick's extreme, because if price accepts back through there, the grab thesis is objectively dead.
How to Read It: Worked Examples
Theory is worthless until it's a decision on a live chart. Let's walk several with real numbers.
Example 1 — The balanced range day (fade the edges)
NQ opens at 23,140, inside yesterday's value area. From the prior session's volume profile you mark VAH 23,210, POC 23,120, VAL 23,040. First hour builds an IB of 23,100–23,180 — comfortably inside value, and a fairly wide IB, which hints range-day. Price rotates up to 23,205, prints a long upper wick on the 5-minute right into VAH, and rolls over — rejection at the value edge. This is your read: balance day, auction rotating, no acceptance outside value.
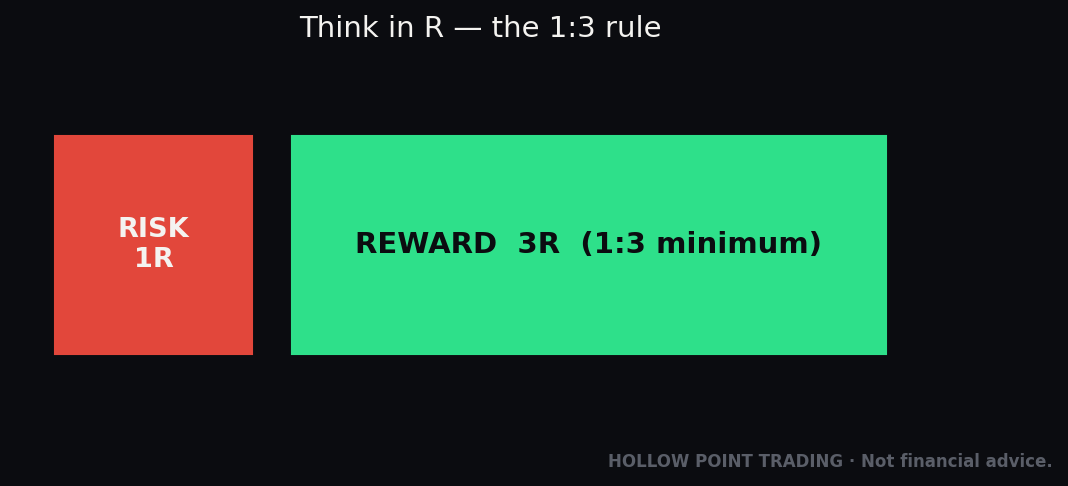
The play is a short from ~23,205 targeting POC at 23,120, with a stop at 23,225 (above the VAH liquidity, above the wick). That's 20 points of risk for 85 points of reward — better than 1:4, and the structure handed it to you without a forecast. You didn't predict a top; you waited for the auction to reject the edge and took the rotation back toward the magnet. First target POC; if POC gives way with acceptance, the rotation can extend to VAL, but you bank the bulk at the middle where the magnet is strongest.
Example 2 — The stop run reversal (fade the grab)
Price grinds down all morning into a clean prior-day low at 22,880 that's been tested twice — a stacked pool (PDL plus a round-ish level plus a visible swing). Everyone's stops are stacked right below it. At 10:15 price accelerates, spikes through to 22,861, and within two 5-minute bars reclaims 22,880 with a fat rejection wick and a surge of volume well above the session average. That's a liquidity grab — the auction fueled up on longs' stops and found no acceptance lower.
Your entry is the reclaim of 22,880 (enter as the bar closes back above it, say 22,890). Stop below the sweep's extreme at 22,850 — below the fuel, where the read is genuinely wrong. Target the value area above: POC first, VAH if momentum carries. Risk 40 points to make 120+ up to POC. The sweep that stopped out the crowd is your setup. Note what made this A-grade: the pool was stacked and obvious, the sweep was fast, the rejection was violent and volume-backed, and the reclaim confirmed before you committed a dollar.
Example 3 — The trend day (go with acceptance)
NQ gaps up and opens at 23,400, above yesterday's value area (VAH was 23,300) on a strong overnight following a soft CPI print. First hour, price tries to fill back toward value, dips to 23,360, fails to reach the old VAH, and builds a fresh IB entirely above the prior day's range: 23,360–23,470. It breaks the IB high at 23,470 on volume at 11:00 and holds — a 30-minute period closes and builds value above 23,470. That's acceptance outside value, in a new area. This is imbalance: the auction has rejected the old fair price and is trending to discover a new one.
You do not fade this. You buy pullbacks to the rising POC / VWAP / EMA-22, targeting the next liquidity pool overhead — the round number 23,500, then the prior week's high at 23,620. A pullback to VWAP at 23,455 that holds with a bullish reversal candle is your entry; stop below the developing POC or below the pullback low; target the overhead pool. Trend days trend all day; the mistake is treating imbalance like balance and shorting into strength because "it's extended." Extended is what trend days do.
Example 4 — The failed auction reversal (open outside, back in)
This is the highest-conviction open pattern, so let's give it numbers. NQ closed yesterday with value 23,000–23,120 (VAL–VAH), POC 23,060. Today it gaps down and opens at 22,950 — below prior value. Bears are excited; the gap looks like a breakdown. But in the first 45 minutes price climbs back and accepts inside prior value, closing 30-minute periods above VAL 23,000 and holding. That's a failed auction: the downside break got rejected and price re-entered value. The playbook says a failed auction runs to the opposite edge — so the target is VAH 23,120 and quite possibly beyond, because re-entry from below often means a full traverse of the value area and a poke at the upside pool.
Entry: on acceptance back above VAL (a 30-min close and hold above 23,000), long toward POC then VAH. Stop back below VAL where the "acceptance" would be proven false. This one setup — gap outside, reclaim value, traverse to the far edge — pays some of the cleanest R on the calendar precisely because a whole cohort of breakout traders is now trapped on the wrong side, and their stops become the fuel for the traverse.
Notice what's common to all four: you're not predicting. You're classifying the auction's state — balanced or imbalanced, accepting or rejecting — and taking the trade that state hands you. That's the whole discipline.
The Auction in Different Market Regimes
The same mechanism, radically different behavior depending on the environment. Reading the regime first is what keeps you from applying the right tool to the wrong day.
Trending regime (persistent imbalance)
In a trend, the auction has committed to price discovery in one direction. Value areas migrate session over session — each day's value builds above (or below) the last, a staircase of stacked profiles. Pullbacks are shallow and get bought/sold before they reach the far edge of value; POC keeps sliding in the trend direction. Here the money is made with the trend on pullbacks to developing value (VWAP, rising POC, EMA-22), and the deadly error is fading edges. Stop runs in a trend tend to be continuation grabs: price dips to grab the stops under a pullback low, then resumes the trend. So even the grabs point with the trend, not against it.
Balanced/rotational regime (persistent balance)
Chop. Range. The auction is comfortable and just rotates VAL → POC → VAH → POC → VAL. Value areas overlap heavily day to day; the profile is fat and D-shaped. This is where fade-the-edges lives and where breakout strategies get slaughtered, because most "breakouts" are pokes that get rejected — the range is manufacturing stop runs at both edges all day. In a balanced regime, treat every touch of VAH/VAL as a fade candidate until acceptance proves otherwise, keep targets modest (POC, not a moonshot), and reduce size or sit out if the range is tight and directionless. The skill in chop is doing less.
High-volatility regime (violent price discovery)
News days, CPI/FOMC, gap-and-go opens, VIX elevated. Ranges expand; the auction covers ground fast and the pools get run brutally. Two things change: your stops must be wider (scaled to the expanded ATR, or you'll get grabbed out of a thesis that's actually correct — the wick that stops you at 30 points in normal vol needs 60+ points of room on an FOMC afternoon), and your conviction on any single level drops because price is slicing through pools it would respect on a calm day. High-vol days produce the biggest stop runs — the sweeps are enormous — so the reclaim setups pay huge, but only if your risk is sized for the environment. The classic disaster is trading FOMC with a calm-day stop and getting swept out of five correct trades in a row.
Low-volatility regime (compression)
Dead tape, holiday sessions, pre-FOMC coil, summer afternoons. The auction is barely moving; IBs are tiny, profiles are tall and thin. This is coiled-spring territory — energy stored, not spent. The play is patience: mark the compression range, and wait for the eventual expansion. Low-vol chop punishes overtrading more than any other regime because there's simply not enough range to pay your risk. Often the correct read is "nothing here yet — the spring is loading — stand aside until it releases."
The meta-skill: name the regime before you name the trade. Trend, balance, high-vol, low-vol. The exact same VAH touch is a short in balance, a buy-the-pullback in an uptrend, and a "get out of the way" in a high-vol breakout. Regime first, always.
Multi-Timeframe: Stacking the Nested Auctions
The auction is fractal, which means you always have several answers on the screen at once. Reading them in the wrong order is the most common source of "the setup was perfect and it still failed."
The hierarchy: war, battle, skirmish
- Daily / higher-timeframe auction sets the war — the dominant bias. Is price accepted above or below daily value? Is the daily balanced or trending? This is the most orders, most participants, most truth. It gets the most weight.
- 15-minute / hourly auction sets the battle — the intraday structure, the IB, the session value area. It tells you whether today is trend or range within the daily context.
- 1-minute / tick auction sets the skirmish — the entry. The exact reclaim, the exact rejection wick, the trigger.
The rule: trade the low-timeframe signal only when it agrees with, or executes, the higher-timeframe auction's state. A one-minute stop run into a daily value-area low, with the daily still balanced, is a phenomenal fade — the small auction is executing the big auction's rotation. That same one-minute stop run against a strong daily downtrend is a low-quality countertrend scalp at best. The signal is identical; the context makes one A-grade and the other a coin flip.
A concrete stack
Say the daily has NQ balanced with value 22,800–23,400, POC 23,100, and price is sitting mid-range — daily says balance, rotate. Intraday, price grinds down to the daily VAL region near 22,820 and the 15-minute shows a fat rejection forming. Drop to the 1-minute and you catch a clean stop run: sweep of the session low at 22,805, reclaim at 22,825 with volume. Now every timeframe agrees — daily says the low edge should hold and rotate up, the 15-min shows rejection, the 1-min gives you the precise reclaim entry. Stop below the sweep at 22,795, target the daily POC 23,100 for a monster R. That's timeframe-weighted confluence: not three indicators agreeing, but three auctions at three scales telling the same story.
When timeframes disagree
They will, constantly, and the disagreement is information. A one-minute rejection against a daily trend isn't a "signal against a signal" — it's the small auction pulling back within the big auction's imbalance, i.e., a pullback entry in the trend direction, not a reversal. When your low timeframe screams the opposite of your high timeframe, default to the higher timeframe's bias and reinterpret the low-timeframe move as either (a) a pullback to enter with the higher trend, or (b) noise to ignore — never as a reason to fade the dominant auction. The higher timeframe is more orders and more truth; when in doubt, it wins.
How It Fits the Top-Down Process
Auction theory isn't a standalone system you bolt on. It's the engine underneath the HPT top-down process, and it plugs into every layer.
Macro → sector → stock is itself a nested set of auctions. The broad market (ES, NQ) is auctioning for fair value; sectors auction within that; individual names auction within their sector. When you read the top down, you're reading which auctions are balanced and which are imbalanced, and stacking them. A stock breaking to new value (imbalance) while its sector and the index are also accepting higher is three auctions agreeing — that's the timeframe-weighted confluence the HPT method lives on. Conversely, a single name imbalanced up while its sector and the index are balanced or rolling over is a lonely auction fighting the tide — lower conviction, tighter management.
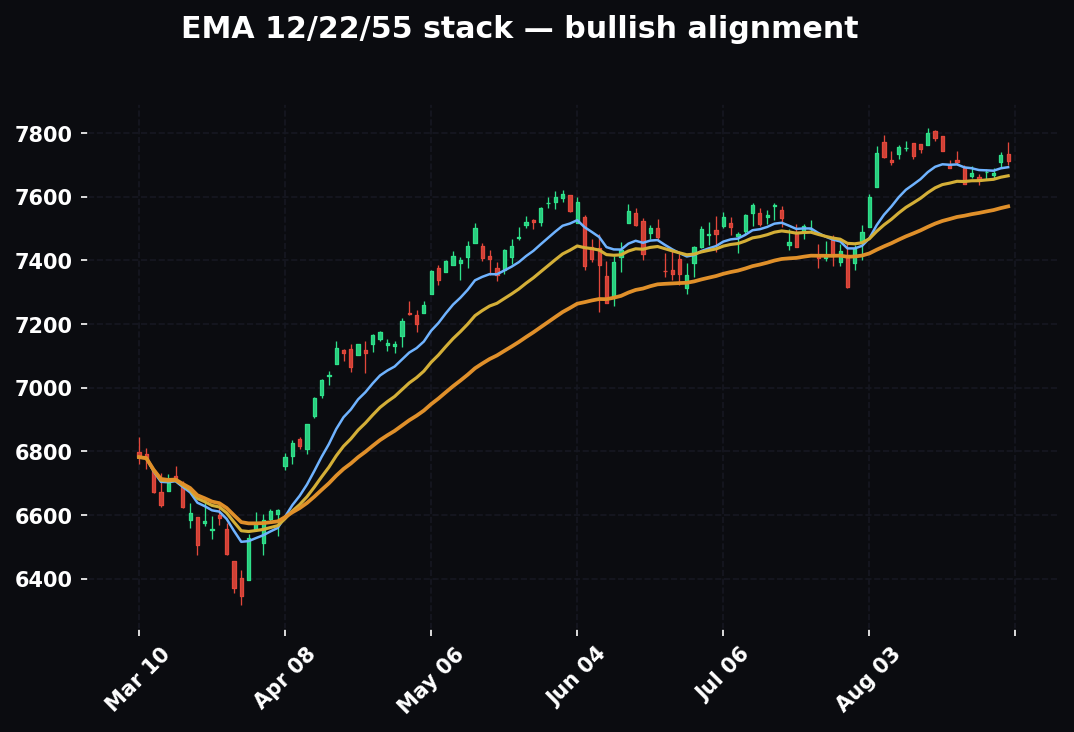
EMA 12/22/55 is your fast-read acceptance filter. Price accepted above a rising 55 = the higher-timeframe auction is imbalanced upward; you favor longs and treat dips as pullbacks to value, not reversals. Price whipping across a flat 55 = balance; you're in a rotation, so you fade edges instead of chasing. The 12 and 22 give you the near-term acceptance read, the 55 gives you the regime. The EMAs and the value area tell the same story from two angles — when they agree (price above rising 55 and accepted above VAH), conviction is high; when they conflict (price above the 55 but rejecting at VAH), the auction is undecided and you wait.
Timeframe-weighted confluence is multi-auction alignment, covered above. The daily auction sets the war; the 15-minute the battle; the 1-minute the entry. Weight the higher timeframe's auction state more heavily — it's more orders, more participants, more truth.
1:3 R/R falls out of the structure naturally, and this is the beautiful part. The auction gives you your levels: your stop goes beyond the liquidity grab (where the read is objectively invalidated), and your target is the next value area or liquidity pool (where the auction is headed to do business). You don't invent a random 3R target — you read it off the profile. The math works because the levels are real. A grab at VAL with a stop below the sweep and a target at POC or VAH is frequently 1:3 or better by construction, not by wishful drawing.
Discipline over prediction is the entire ethos of auction reading. You are never predicting where price goes. You're waiting for the auction to show you acceptance or rejection at a level that matters, then acting on evidence. No evidence, no trade. That's not passive — that's the edge.
Confluence: Auction Theory Plus Three Other Tools
Auction reading gets sharper when it's confirmed by tools that measure the same thing a different way. The best confluence is redundant evidence, not extra decoration.
Auction + VWAP (the institutional fair-value line)
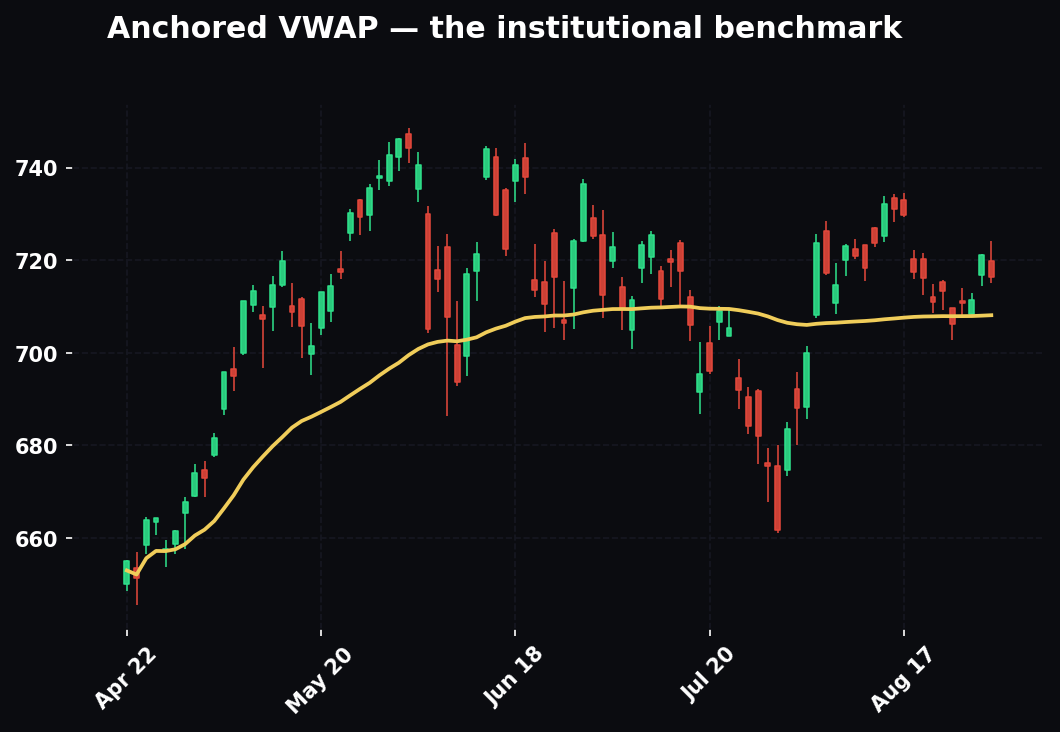
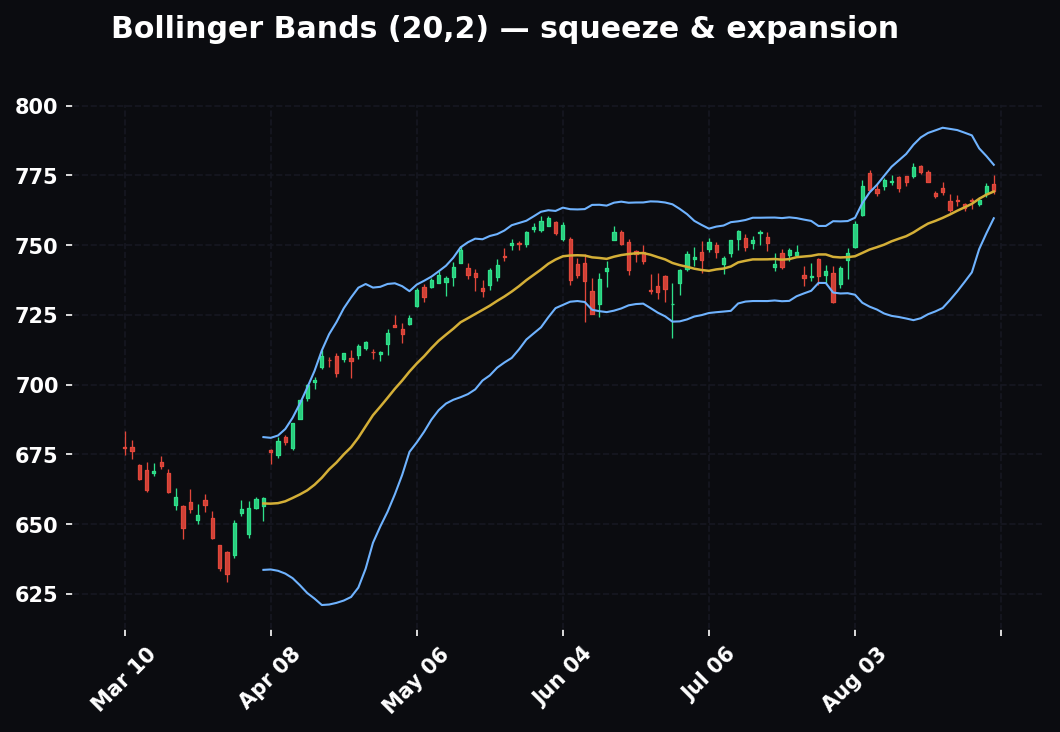
VWAP is a real-time, volume-weighted fair-value line — it is a running POC for the session, which is why it belongs with auction reading. When developing POC, the value area, and VWAP all cluster in one zone, that zone is heavily defended fair value; expect strong reactions. On a trend day, price holding above a rising VWAP confirms upside acceptance — pullbacks to VWAP are your with-trend entries, and VWAP is often the exact level where the auction reloads. On a range day, price oscillating around a flat VWAP confirms balance. And a stop run that grabs liquidity and reclaims back across VWAP is a double-confirmed reversal: rejection at the pool plus reclaim of institutional fair value.
Auction + the golden pocket (Fibonacci 0.618–0.65)
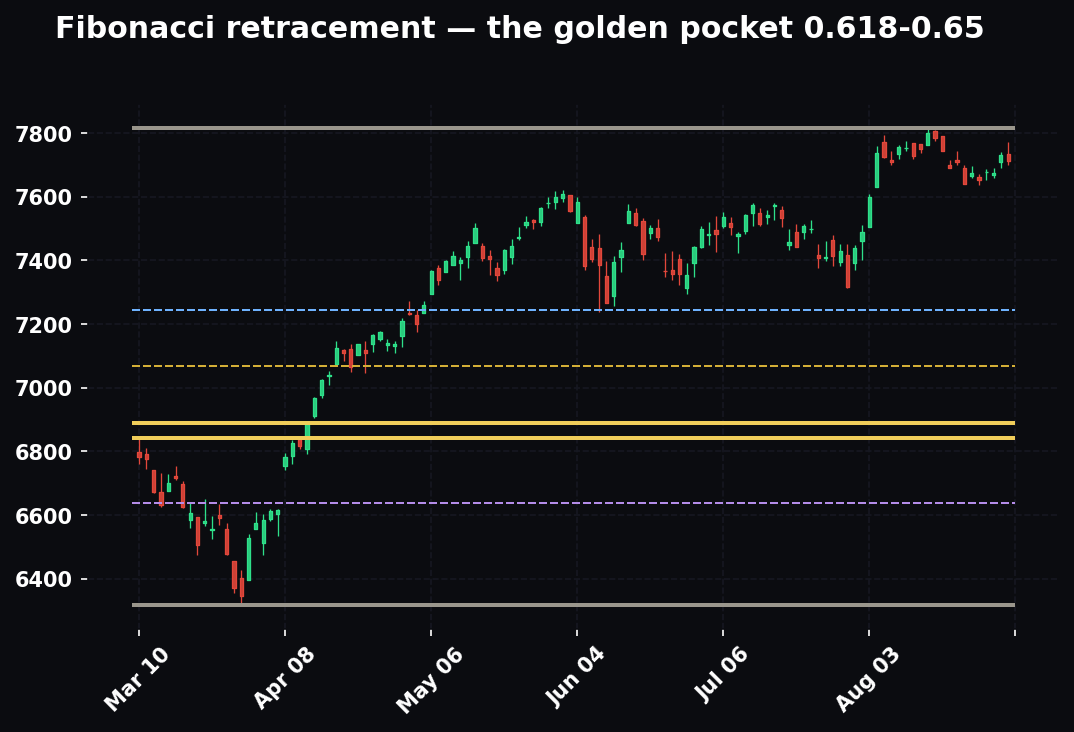
Fib retracements measure where a pullback is likely to find support within an impulse; the golden pocket (0.618–0.65) is the highest-probability reversal zone. It becomes powerful when it lands on an auction level. A golden pocket that sits exactly at the prior value-area high (now support on a retest), or right where a liquidity pool of stops rests, is confluence you can lean on: the fib says "pullback should end here," the auction says "there's fuel and a fair-value edge here," and a stop run into that zone that reclaims is a triple-confirmed entry — fib, pool, and rejection all in one spot.
Auction + RSI/momentum divergence
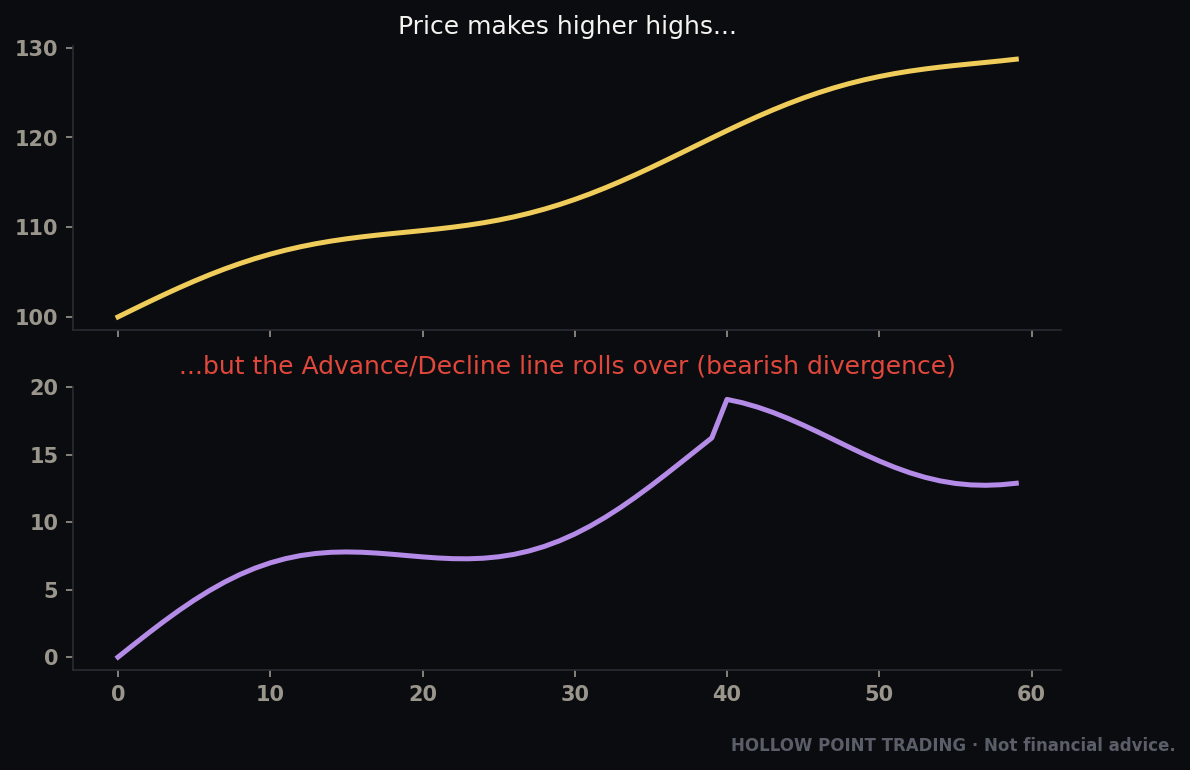
Momentum divergence answers a question auction reading raises: is the grab exhausting the move, or continuing it? When price makes a new low into a liquidity pool (the sweep) but RSI makes a higher low, momentum is diverging from price — the sweep is running on fumes, which is exactly what you want to see under a stop-run reversal. Divergence at a swept pool says the fuel is spent and the reclaim should stick. No divergence — momentum making new lows right alongside price — warns that the break may be genuine acceptance, not a grab, and you demand a cleaner reclaim before committing. Divergence doesn't trigger the trade; it grades the grab.
How the Pros Use It Differently From Beginners
The same framework in two very different pairs of hands.
Beginners look for the level; pros look for the reaction at the level. A novice marks VAL and buys the touch. A professional marks VAL and waits* — for a sweep, a reclaim, a rejection wick, acceptance or its absence. The level is the location; the reaction is the trade. Location without confirmation is a coin flip.
Beginners fear the sweep; pros wait for it. When price pokes below their entry level, the beginner panics and bails — often getting stopped at the exact low. The pro expects the pool below to get run and either places risk beyond it or actively waits for the grab as the entry trigger. The sweep isn't the thing that goes wrong; it's frequently the thing that goes right.
Beginners size the same every day; pros size the regime and the grade. A pro presses on an A-grade failed-auction reversal aligned across timeframes and barely touches a middle-of-value coin-flip on a low-vol chop day. Position size is conviction, and conviction comes from how many auctions agree.
Beginners predict; pros classify and react. The beginner has a thesis by 9am and defends it all day. The pro holds the auction's state loosely and updates it bar by bar: was that acceptance or rejection? Did IB hold? Did value migrate? The read is a living thing, not a morning prediction to marry.
Beginners see one timeframe; pros see the stack. A beginner takes a one-minute signal in isolation. A pro never reads the skirmish without the war — the same one-minute reclaim is an A-setup or a trap depending entirely on the daily context, and the pro always checks the context first.
Beginners treat volume as decoration; pros treat it as the vote count. Acceptance is volume building at a level; a stop run is a volume spike into a pool with no follow-through. The pro reads volume as the number of participants voting on fair value, which is what makes acceptance and rejection real instead of imagined.
The Common Mistakes
Even traders who "know" auction theory bleed money by breaking these. Learn them cold.
1. Fading a trend day like it's a range day. The single most expensive error. When price is accepted outside value and extending, it is NOT going to revert to POC just because you drew a line there. Balance tools kill you in imbalance. Always classify the day's state first — regime before trade.
2. Confusing a poke with acceptance. A single bar closing beyond VAH is not acceptance. Acceptance is time and volume holding beyond the level — multiple bars, building volume, no immediate rejection. Jumping on the first tick outside value is how you become the liquidity for the guys fading the failed breakout.
3. Putting stops in the obvious pool. If your stop is one tick below the clean swing low everyone can see, you've volunteered to be fuel. Place it beyond where the grab would reach — below the wick, not below the level — or use structure the crowd isn't all staring at.
4. Trading the middle of value. The edges (VAH, VAL) and the liquidity pools are where the auction makes decisions. POC is a magnet but the middle of the range is a coin flip. No location, no edge, no trade.
5. Ignoring where the liquidity is. If you take a long and there's a fat pool of stops right below your entry, understand that price may well dip to grab it before going your way. Anticipate the sweep. Don't set your stop where the fuel is, and don't get shaken out of a correct thesis by the grab you should have seen coming.
6. Forcing trades on balance days. Most days are rotational and boring. Trying to manufacture a trend where the auction is clearly balanced is how patient capital gets churned into commissions. Sometimes the read is "it's balanced, fade the edges small or sit out."
7. Front-running the reclaim. Buying the sweep hoping it's a grab, before price closes back inside, is how you catch the one break in ten that's real acceptance and rides it straight down. The reclaim is the trigger. Let the auction prove rejection before you commit.
8. Using one profile and ignoring the composite. A single day's profile can mislead; the composite profile over the last week or the current balance range shows the levels that actually matter. Zoom out and mark the higher-timeframe value area, not just today's.
9. Same stop size in every regime. A 25-point stop is generous on a dead Tuesday and suicidal on FOMC afternoon. If your risk doesn't scale with ATR/volatility, high-vol days will grab you out of correct reads repeatedly. Size the stop to the environment.
10. Marrying the morning bias. You decided "long day" at 8:30 and refused to update when IB failed, value migrated down, and price accepted below VAL. The auction changed its mind and you didn't. Update the read on evidence, every session, all day.
11. Reading levels without volume. Marking VAH/VAL/POC and never once looking at whether volume confirms the reaction. Acceptance and rejection are volume phenomena; the levels are just where you watch for them. A rejection wick on no volume is far weaker than one on a volume surge.
12. Confusing a liquidity grab with a trade signal on its own. A grab is only tradable with confluence — into a value edge, at a golden pocket, with divergence, aligned to the higher timeframe. A random wick beyond a random level in the middle of nowhere is not a stop run worth trading; it's just noise. The grab needs a reason to be there.
FAQ
Do I need Market Profile software, or does Volume Profile work? Volume Profile (fixed-range and session) captures the levels you actually trade — POC, VAH, VAL — and it's built into TradingView. Classic Market Profile (TPO) adds a time-based view and some nuance, but you can run the entire framework in this piece on Volume Profile alone. Start there.
How do I know if it's a grab or a real breakdown in real time? You don't know with certainty until the reclaim — which is exactly why the reclaim is the trigger. A grab reclaims (closes back inside) fast, on a rejection wick, ideally with divergence and no acceptance beyond the level. A real breakdown accepts below: bars close and build volume out there and no reclaim comes. Wait for the answer instead of guessing it.
What timeframe should I build my value areas on? Match it to your trade horizon, and always keep the one above it for context. Day traders: prior-day and current-session value areas for the trade, plus the weekly composite for bias. Swing traders: weekly and monthly value areas for the trade, daily for entries. The higher-timeframe value area is the war; build your entries inside it.
Does auction theory work on stocks and crypto, not just futures? Yes — it's a description of how any continuous two-way auction works. Any liquid market with a visible order book and real participants obeys the same acceptance/rejection, value, and liquidity mechanics. Less liquid names have thinner, less reliable pools, so the edges are blurrier, but the framework holds.
Where exactly do I put my stop? Beyond the invalidation, not beyond the entry. On a stop-run reversal, that's just past the sweep's extreme — the wick tip — because acceptance back through there kills the thesis. On a value-edge fade, just beyond the edge and its wick. Never one tick behind the obvious level where the whole crowd hides, because that's the pool that gets run.
How is this different from support and resistance? S/R tells you where price might react. Auction theory tells you why — because that's a liquidity pool the auction needs, or a value edge it's testing — and, crucially, tells you how to read the reaction (acceptance vs. rejection) instead of blindly buying support. It's the mechanism underneath the lines.
Can the auction be "wrong"? The auction is never wrong — it's the definition of fair value at that instant. Your read of it can be wrong, which is what the stop is for. When price accepts beyond your invalidation level, the auction hasn't failed; it's told you the fair value moved and your thesis is stale. Take the loss and re-read.
Why does price sometimes blow straight through a huge pool without reversing? Because the pool became fuel for continuation, not reversal — a large player used the stops to add in the trend direction, or genuine imbalance meant the break was acceptance, not a grab. Regime tells you which to expect: in a strong trend, pools get run with the trend; in balance, pools at the edges tend to reject.
Cheat-Sheet: The Auction on One Page
Pin this. It's the whole framework in a glance.
The one truth: Price moves up to shut off buying, down to shut off selling. It's always searching for fair value.
Two answers to watch for:
- Acceptance = price stays, volume builds, value migrates → trend/continuation.
- Rejection = price snaps back, long wick, volume spike with no follow-through → reversal/fade.
The map (from volume profile):
- POC = fairest price, the magnet.
- VAH / VAL = edges of the 70% value zone; decision points.
- Inside value = balance → fade edges toward POC.
- Accepted outside value = imbalance → trade with the trend.
- Profile shape: D = balance (fade); P/b after a run = exhaustion (careful).
Initial Balance (first hour):
- Holds → range day, fade extremes.
- Breaks + holds (acceptance) → trend day, go with the extension.
- Narrow IB coils (watch for extension); wide IB contains (likely the range).
- Poke + immediate return = fakeout, fade back inside.
Liquidity = fuel. It sits:
- Below swing lows, above swing highs.
- Beyond round numbers, PDH/PDL, session hi/lo, IB hi/lo, overnight hi/lo, prior week hi/lo.
- Beyond trendlines/MAs everyone watches, and value-area edges.
- Bigger pool = more-tested, more-obvious, more-stacked levels.
Stop run (liquidity grab):
- Approach → sweep beyond an obvious level → grab stops → reject → reclaim → drive.
- The wick = fuel consumed. The reclaim = your entry (never front-run it).
- Enter on the reclaim, stop beyond the sweep, target the next value/pool.
- Grade it: value edge + golden pocket + divergence + higher-TF agreement = A-setup.
Day-open playbook:
- Open inside prior value → rotate, fade edges.
- Open outside, back in → failed auction, run to opposite edge (highest conviction).
- Open outside, stays out → trend, go with it.
- Open at the edge → let 15–30 min resolve, then classify.
Regime first, always:
- Trend: value migrates, buy/sell pullbacks to developing value, grabs continue the trend. Don't fade edges.
- Balance: value overlaps, fade VAH/VAL to POC, modest targets. Don't chase breakouts.
- High-vol: widen stops to ATR, drop single-level conviction, huge grabs pay big.
- Low-vol: compression, coiled spring, be patient, don't overtrade.
Multi-timeframe stack:
- Daily = war (bias, most weight). 15-min = battle (day's structure). 1-min = skirmish (entry).
- Trade the low-TF signal only when it agrees with / executes the higher-TF auction.
- TFs disagree → default to higher TF; reinterpret low-TF as a pullback entry, not a reversal.
Confluence checklist:
- VWAP aligned with POC/value = defended fair value.
- Golden pocket 0.618–0.65 on an auction level = leaned-on entry.
- Momentum divergence at a swept pool = grade the grab as exhaustion.
- EMA 12/22/55: above rising 55 = imbalance up; flat 55 = balance.
Risk = structure:
- Stop beyond the grab / edge (where the read is invalidated), never in the obvious pool.
- Target the next value area or liquidity pool → 1:3 built in by structure.
- Wait for acceptance/rejection evidence. No evidence, no trade.
The Reframe That Sticks
Go back to that "random" move that stopped you out last week. The spike below the low that reversed. Now you know what it was: the auction seeking liquidity, consuming the stops it needed as fuel, and rejecting a price it never intended to accept. Not random. Not rigged. Mechanical. The market told you exactly what it was doing — you just hadn't learned its language yet.
That's the shift. Every wick is the auction answering its own question. Every value area is a record of where business got done. Every liquidity pool is a target painted on the chart in advance. Price is not noise. It's a two-way search for fair value, fueled by resting orders, leaving footprints you can read.
Learn to read the auction and you stop reacting to the market. You start anticipating it — not by predicting, but by classifying: balanced or imbalanced, accepting or rejecting, fueled up or hunting, trend or chop, high-vol or coiled. That's what turns a squiggle into a story, and a gambler into a trader.
Come Monday, mark your value areas, note your liquidity pools, know your regime, check the higher timeframe, watch the first hour build the IB, and then just listen. The auction will tell you what it's doing. Your only job is to trade the answer, not the guess.
Bound by rules, feared by trade.