
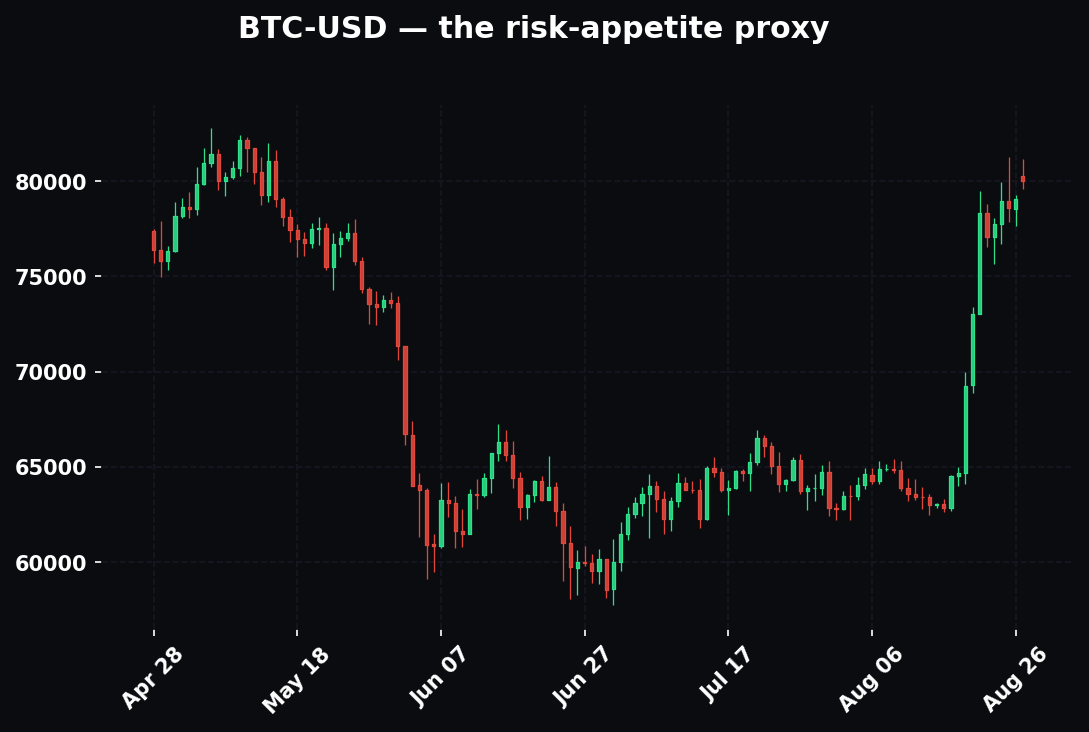
Most traders meet crypto the wrong way. They show up because a coin went up 40% in a week, buy the candle, get liquidated on a wick at 3 a.m., and walk away calling the whole asset class a casino. It can be a casino. It can also be the cleanest real-time gauge of global risk appetite you'll ever watch. The difference is entirely in how you approach it.
This guide treats crypto the way Hollow Point treats everything: top-down, rules-first, discipline over prediction. We'll build the mental model from the macro layer down to the entry, define every term once, and give you worked examples you can run on a live chart today. By the end you should understand not just what Bitcoin and Ethereum are, but how they trade, why they move with the Nasdaq some months and against it in others, where the structural traps are that eat retail accounts, and — most importantly — how to put a position on that lets you sleep.
Read this as a craftsman's manual, not a hype piece. Nothing here is a promise that a coin goes up. Everything here is a way to lose less when you're wrong and press harder when the whole board agrees. That is the only edge that compounds.
Let's start at the top.
The Concept: Crypto Is a Liquidity Instrument Wearing a Technology Costume
Here's the single most useful frame for a trader: price action in crypto is mostly a bet on liquidity and risk appetite, dressed up in a technology story.
The technology is real. Bitcoin is a fixed-supply, decentralized settlement network — a ledger no single party controls, secured by miners spending real electricity. Ethereum is a programmable settlement layer that runs applications on top of it. Those things matter enormously for the decade-long thesis. But for how the asset trades week to week, crypto behaves like the highest-beta risk asset on the board — a leveraged proxy for how much money is sloshing around the global system and how brave people feel spending it.
"Beta" is the word to internalize. If the Nasdaq is a 1.0 on the risk scale, crypto trades like a 2.5 to 3.0. It does what stocks do, but more, and faster, and at 3 a.m. on a Sunday. When central banks are easing, when real yields are falling, when the dollar is weak, when the Nasdaq is ripping — crypto tends to be the thing that runs hardest and furthest. When liquidity tightens, crypto is the first thing sold and the last thing bought back. It's the canary and the amplifier at the same time.
Why "liquidity" is the master variable
When traders say "liquidity" at the macro level they mean roughly one thing: the total quantity of easy money in the system looking for a home. Central bank balance sheets, bank reserves, the pace of credit creation, the level of real (inflation-adjusted) interest rates, and the direction of the dollar all feed into it. When that pool is expanding, the marginal dollar chases return, and it climbs the risk ladder — bonds, then blue chips, then growth stocks, then crypto, then the trashiest small-cap alt-coin. Crypto sits at the top of that ladder. It gets the last dollar in and it loses the first dollar out.
This is why a crypto trader who ignores the Fed, the DXY, and the 10-year yield is trading blind. You are not really trading Bitcoin. You are trading the second derivative of global liquidity, and Bitcoin is the instrument you happen to express it through.
This is why you'll hear crypto called "the debasement trade." The core narrative: governments run large deficits, central banks expand balance sheets, fiat currency purchasing power erodes over time, and holders want a hard-capped asset (only 21 million BTC will ever exist) as an escape hatch. When faith in the monetary system wobbles — banking scares, currency crises, aggressive money printing — Bitcoin catches a bid as "digital gold." That's the long-term structural bull case in one sentence.
The two narratives that fight inside every candle
Here is the part beginners miss, and it is worth slowing down on. The debasement trade and the risk-appetite trade pull in the same direction most of the time and opposite directions occasionally.
Most of the time, loose money means both "risk-on" AND "debasement fear," and crypto flies — the two narratives stack. But in an acute liquidity crisis (think March 2020, or the depths of a margin cascade), something flips. When investors are getting margin-called, they don't sell what they want to sell; they sell what they can sell — the liquid, profitable, easy-to-exit stuff. That's gold, that's Bitcoin. So in the first violent leg of a real crisis, the "uncorrelated hard-money hedge" gets dumped for dollars right alongside everything else. Correlations rush to 1.0. The digital-gold story fails exactly when its believers expected it to pay off, then reasserts itself weeks or months later once the forced selling is done and the money-printing response begins.
Knowing which of these two regimes you're standing in — narratives stacked, or narratives at war — is the whole game. A trader who can't tell the difference will buy the "hedge" into the one week it behaves like the highest-beta risk asset on Earth. We'll come back to this repeatedly.
The Two Assets You Actually Need to Know
You can trade crypto for years touching only two tickers. Resist the gravitational pull of the thousands of alt-coins until your process on these two is airtight.
Bitcoin — the reserve asset
Bitcoin (BTC) is the reserve asset of the space. Fixed supply, most liquid, deepest derivatives market, the thing institutions buy first through spot ETFs. It's the "risk-off within crypto" trade — when the space gets scared, money rotates from alts into BTC, the way capital flees to Treasuries in a stock-market panic.
Its dominance — BTC's share of total crypto market cap — is a regime tell. Rising dominance usually means one of two things: fear (capital huddling into the safest crypto asset), or an early-cycle institutional bid (the big, slow money comes in through Bitcoin first). Falling dominance usually means later-cycle speculative appetite spilling out of BTC and into everything else — the "alt season" phase where risk appetite is maxed.
Ethereum — the high-beta computer
Ethereum (ETH) is the largest "computer" — a network where developers deploy smart contracts (self-executing code) for lending, trading, stablecoins, NFTs, and more. ETH is higher beta than BTC: it tends to fall harder in drawdowns and rip harder in rallies. It carries an extra layer of narrative (network usage, staking yield, fee burn) that can make it lead or lag Bitcoin depending on where the cycle is.
The ETH/BTC ratio is one of the most important sentiment gauges in the space — a chart of Ethereum priced in Bitcoin. When it's rising, risk appetite within crypto is expanding; capital is comfortable moving out the risk curve. When it's falling, capital is huddling into Bitcoin and internal risk appetite is contracting, regardless of what the dollar price of each is doing.
The two-line summary
Rule of thumb for a top-down trader: BTC tells you the macro regime, ETH/BTC tells you the internal risk appetite. Watch both, every session, before you look at a single alt-coin. If BTC is weak and ETH/BTC is falling, an alt-coin long is fighting two currents. If BTC is firm and ETH/BTC is turning up, the whole risk complex has the wind at its back.
The Mechanism: How a 24/7 Market Actually Works
Traditional markets have a bell. Crypto never closes. No open, no close, no circuit breakers, no overnight gap because there is no overnight — Saturday 4 a.m. is a trading session like any other. This changes everything about how risk behaves, and it is the single feature most stock traders fail to adapt to.
What 24/7 actually does to your risk
- Gaps happen intraday, not at the open. In stocks, catalysts hit while the market is closed and you gap over your stop. In crypto, the catalyst hits and the price moves right then, often violently, whether you're awake or not. The "gap" is a real, tradable, five-minute candle that ran through three of your levels while you slept.
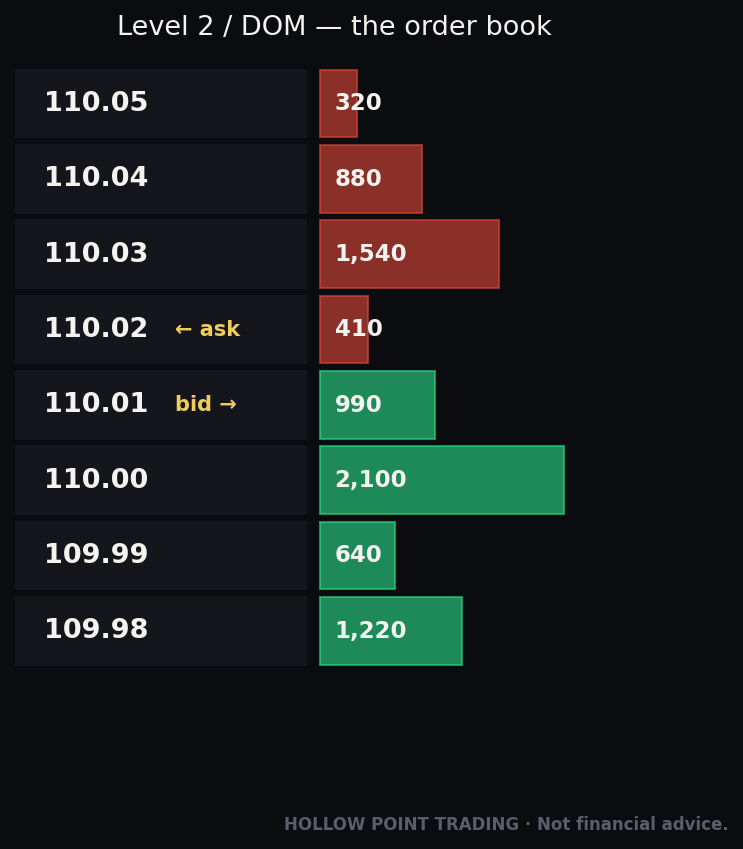
- Weekends are thin. Liquidity — the depth of resting buy and sell orders in the book — drops sharply when institutional desks are offline Friday evening through Sunday evening. Thin books mean bigger moves on smaller volume. A modest sell order that would barely register on a Tuesday can air-pocket the price 4% on a Sunday because there's nothing underneath it. Weekend pumps and "Sunday-night massacres" are a genuine structural pattern, not superstition. They are the mechanical consequence of a shallow order book.
- You cannot babysit a position 24/7, so your stop must live on the exchange, not in your head. This is non-negotiable and it's the first thing to burn into muscle memory. A mental stop in a market that trades while you sleep is not a stop; it's a prayer.
The session structure that still exists
Even though the market never closes, human beings still sleep and desks still keep hours, so a soft session structure persists. Asian hours, European hours, and U.S. hours each have their own character; the largest, most decisive moves in Bitcoin still cluster around the U.S. equity cash session and the U.S. futures open, because that's when the deepest pools of institutional capital are awake and the correlation to the Nasdaq is tightest. The CME Bitcoin futures also produce a genuine weekly gap (they close over the weekend while spot keeps trading), and those CME gaps have a well-documented tendency to get "filled" — spot drifts back to the price where CME closed. It's not magic; it's a level a lot of traders watch, which makes it self-fulfilling often enough to note.
Because the market never sleeps, your risk management has to be structural, not attentional. Set the stop, set the size, walk away. The market will still be there in the morning, and so will you, because you sized it to be survivable.
Spot vs. Perps: The Single Most Important Distinction
There are two ways to get exposure, and confusing them is how beginners blow up.
Spot — you own the thing
Spot means you buy the actual coin. You send dollars (or a stablecoin), you receive BTC, you own it. No leverage, no liquidation, no expiry. If BTC goes to zero you lose 100% — but only 100%, and only if you sell. Spot cannot be forcibly closed by anyone. Time is on your side; you can hold through a 40% drawdown and live to see it recover, provided you never sold. Spot is ownership.
Perps — you rent a bet on the price
Perpetual futures ("perps") are a derivative — a contract that tracks the price of BTC without you ever owning BTC. Perps are the dominant instrument in crypto by volume, and they have two features that make them a chainsaw:
- Leverage. You can control a large position with a small amount of collateral (called margin). 10x leverage means a 10% adverse move wipes your entire margin — you get liquidated, the exchange force-closes your position, and your collateral is gone. Exchanges offer up to 100x and beyond. Offering it and surviving it are two entirely different things. At 100x, a 1% move against you — noise, a single ordinary candle — ends the trade.
- The funding rate. Because a perp has no expiry date, there needs to be a mechanism tethering its price to the actual spot price. That mechanism is funding: a periodic payment (typically every 8 hours) exchanged directly between longs and shorts.
A liquidation math walk-through
Numbers make this concrete. Say you have $1,000 and BTC is at $60,000.
- Spot: You buy $1,000 of BTC (0.01667 BTC). BTC falls 20% to $48,000. Your position is worth $800. You're down $200, unhappy, but fully intact and still holding the coin. It can recover.
- Perp at 10x: You post $1,000 margin and open a $10,000 long. Your liquidation price sits roughly 10% below entry (minus fees and maintenance margin), around $54,000. BTC only has to fall 10% — half the move that merely bruised your spot position — and your entire $1,000 is gone. Worse, the drop to $54,000 might be a single 3 a.m. wick that immediately reverses back to $61,000. Your analysis was right. The leverage removed you before the thesis paid.
That last sentence is the whole warning. Leverage doesn't punish being wrong. It punishes being early. In a market that routinely wicks 5% and reverses, being early by one candle at 10x is a death sentence, while the exact same view expressed in spot is a nap.
Funding Rates: The Sentiment Tax You Can Read
Funding is worth its own section because it's both a cost and a signal — one of the best free signals in any market.
The mechanism. When the perp trades above spot, the market is net-long and eager — so funding goes positive, and longs pay shorts. When the perp trades below spot, the market is net-short and fearful — funding goes negative, and shorts pay longs. The payment nudges the crowded side to close, dragging the perp back toward spot. It's an elegant self-correcting tether, and its byproduct is a live readout of which side the crowd is leaning on.
How to read it. Funding is a real-time thermometer of leveraged positioning:
- Mildly positive funding (around 0.01% per 8 hours, the "neutral" baseline) = healthy, balanced. Longs pay a trivial tax to hold. Nothing to see.
- Very high positive funding (0.05–0.1%+ per 8h, which annualizes to 50–100%+) = longs are greedy and crowded, paying a fat tax to stay in. This is fuel for a long squeeze — a sharp drop that liquidates the over-leveraged longs, cascading downward as forced sells beget more forced sells.
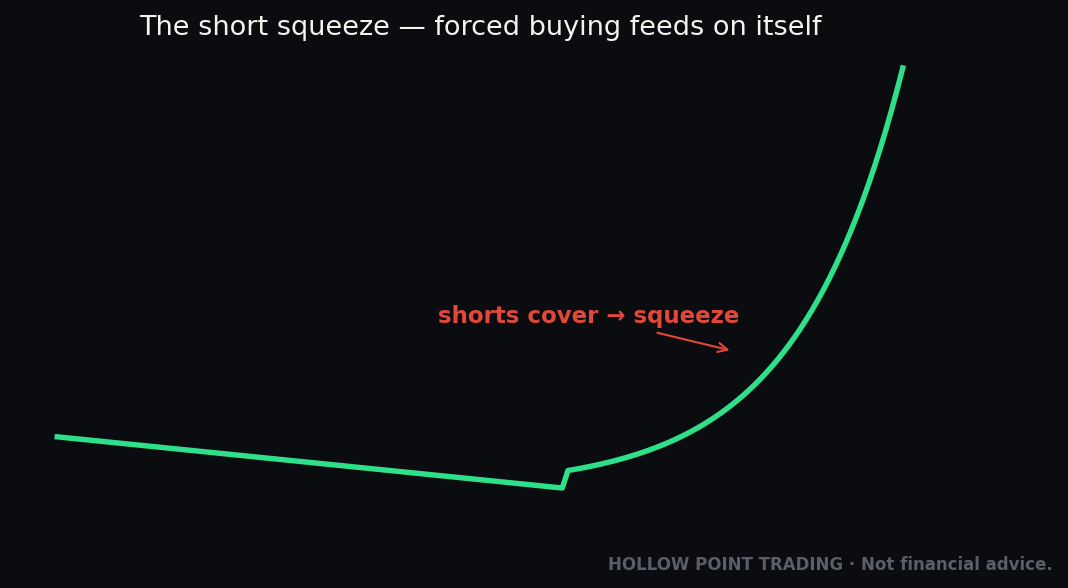
- Deeply negative funding = shorts are crowded and paying to stay short. This is fuel for a short squeeze — a violent rip upward as shorts get force-covered, each liquidation buying to close and pushing price higher into the next cluster of shorts.
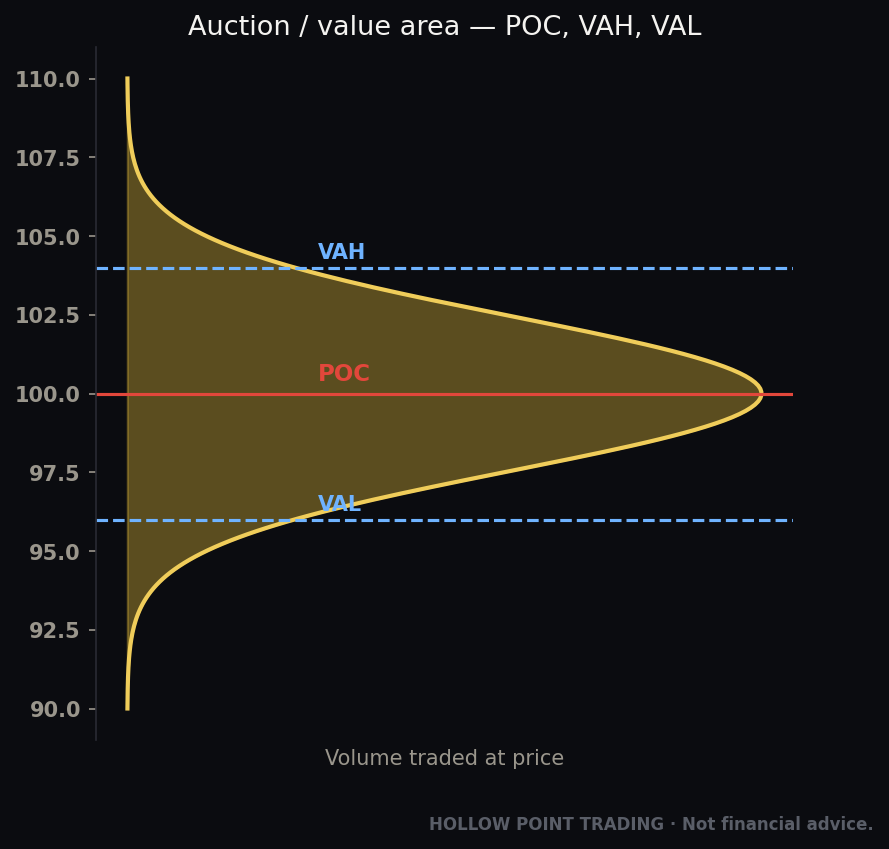
Worked example — the crowded long. BTC has run from $60k to $72k in five days. You check funding: it's sitting at 0.09% per 8 hours (roughly 98% annualized) across major exchanges, and open interest — the total dollar value of outstanding perp contracts — has hit an all-time high. Translation: the entire market is long with borrowed money, and every one of those longs is paying a punitive tax to hold. You do not chase this breakout with a fresh leveraged long. The crowd is already all-in on your side of the boat, and the boat is listing. The asymmetric trade here is the flush that clears them out, not the continuation. Either you wait for the funding reset — a sharp dip that neutralizes funding and liquidates the weak longs — to enter, or you stand aside entirely. This is timeframe-weighted confluence in action: the trend is up, but the positioning data says the fuel tank is empty.
Worked example — the capitulation short. Now the mirror image. BTC has bled from $72k to $58k over two weeks. Funding has gone deeply negative, -0.05% per 8h, and stays there for days — shorts are so confident they're paying handsomely to press. Price stops making new lows despite the relentless bearish funding; it grinds sideways and coils. That divergence — bearish positioning, price refusing to break — is the setup for a short squeeze. You're not shorting the low with the crowd; you're watching for the reclaim of a level that traps them. When price reclaims the prior swing and funding is still negative, the squeeze has fuel and a trigger.
That's the difference between a clerk who sees "price up = buy" and an analyst who reads the whole board. Funding turns the crowd's positioning into a chart you can read.
Open interest — funding's essential partner
Funding tells you which way the crowd leans; open interest (OI) tells you how much is riding on it. Read them together:
- Price up + OI up = new longs opening; a real, fueled trend (until it's over-fueled).
- Price up + OI down = shorts covering; a squeeze, often less durable — the buying is forced, not conviction.
- Price down + OI up = new shorts pressing; a real down-move.
- Price down + OI down = longs capitulating and closing; a flush that may be near exhaustion.
The dangerous cocktail is price at highs + OI at all-time highs + funding pinned high. That is maximum leverage stacked on the long side at the worst price. It is the exact fingerprint of the top of a leveraged move.
On-Chain Basics: The Data Stocks Don't Have
Here's crypto's genuine edge for a diligent trader: the ledger is public. Every transaction, every wallet balance, every coin moving between wallets is visible on the blockchain in real time. Nobody has this in equities. You'll never see Apple's shareholders' brokerage balances updated live. In crypto, you can watch the supply move between hands.
You don't need to be a data scientist. You need three concepts and the discipline to treat them as context, never as triggers.
1. Exchange balances (exchange reserves)
This is the total amount of BTC or ETH held in wallets belonging to exchanges. The logic runs on supply and intent:
- Coins flowing OUT of exchanges (falling exchange balance) = people are withdrawing to self-custody, taking coins off the market to hold long-term. Supply-side bullish. You can't dump what you've moved to cold storage — those coins are, for now, out of the sell-side pool.
- Coins flowing INTO exchanges (rising exchange balance) = people are positioning to sell. Supply-side bearish, especially large inflows arriving from long-dormant wallets that haven't moved in years. When old coins wake up and walk onto an exchange, someone who has held through multiple cycles is preparing to take profit.
2. Whale flows
Large holders ("whales") move size, and their transactions are visible. On-chain trackers flag when a wallet holding thousands of BTC suddenly sends to an exchange (potential sell) or accumulates off it. One whale transfer isn't a thesis — it could be an internal transfer, custody reshuffling, or an OTC deal that never touches the order book. But a pattern of accumulation while price is flat, or a cluster of large deposits into exchanges near a local high, is a real tell that deserves weight in your read.
3. Stablecoin supply on exchanges
Stablecoins are the dry powder of crypto (more on them next). Rising stablecoin reserves on exchanges = buying power building up, waiting to deploy. It's the crypto equivalent of watching cash pile up on the sidelines of an equity market — money that is present, ready, and one decision away from becoming a bid.
How to use on-chain without overfitting
On-chain data is context, not a trigger. Use it exactly like you'd use volume or breadth in equities — to confirm or question what price is already telling you. The failure mode is treating a metric as a standalone buy button; on-chain signals have long, imprecise lead times and are riddled with false positives if you trade them in isolation.
The right way to hold it: if BTC is grinding sideways for weeks while exchange balances quietly bleed to multi-year lows and stablecoin reserves climb, that's a coiled spring — supply leaving, buying power building. That's a lean, a thumb on the scale toward the long side, not an entry. Price still has to break your level and confirm. Discipline over prediction. The on-chain picture raises your conviction when price finally triggers; it never replaces the trigger.
The Halving Cycle: Crypto's Four-Year Heartbeat
Bitcoin has a supply schedule written into its code. Roughly every four years (every 210,000 blocks), the reward miners receive for producing a block is cut in half. This is the halving. It has happened in 2012, 2016, 2020, and 2024.
The mechanism. Miners are the only source of new BTC supply — they receive newly minted coins for securing the network. Halving the block reward halves the rate of new issuance overnight. In simple supply-and-demand terms, if new supply hitting the market drops by half and demand holds steady or grows, price pressure is upward. The 2024 halving cut issuance to 3.125 BTC per block, a small enough daily number that steady ETF demand now dwarfs it.
The historical pattern (with a huge caveat). Bull markets have historically run in the 12–18 months following each halving, followed by a brutal bear market that draws down 70–85% from the top, followed by a long accumulation base, then the next halving. This is the "four-year cycle," and the emotional arc that rides on top of it is remarkably consistent: disbelief, then belief, then euphoria, then denial, then capitulation, then despair, then quiet basing.
The caveat you must internalize
The halving is known in advance. Markets price in known events. The naive "halving = up" trade is exactly the kind of thing that stops working once everyone believes it — the edge in a calendar event decays the moment the calendar is common knowledge. Treat the cycle as a regime map, not a trade signal — a way to know roughly whether you're in a euphoric-late-cycle environment (where you tighten risk, distrust breakouts, and expect the rug) or a despairing-post-bear base (where you accumulate spot patiently on your levels and expect capitulation wicks to get bought).
There's a second-order caveat now, too. The introduction of spot ETFs and large institutional flows may be stretching, muting, or reshaping the classic four-year rhythm — a market with a permanent, price-insensitive institutional bid does not have to bottom and top on the same schedule a purely retail market did. Use the cycle for context. Never bet the account on a calendar. The map is not the territory, and the territory just got a new class of inhabitant.
Stablecoins: The Plumbing of the Whole System
A stablecoin is a crypto token designed to hold a constant value, almost always $1, by being backed by reserves (cash, Treasury bills, or in the worst designs, other crypto and algorithms). The big ones are USDT (Tether) and USDC (Circle). They exist so traders can move in and out of "cash" without leaving the crypto ecosystem — you don't wire dollars back to a bank and wait two days, you just sell BTC for USDT and hold the token.
Why a trader cares:
- They're the base pair. Most trading happens in BTC/USDT, ETH/USDT, and so on. Stablecoins are the dollar of crypto, the unit almost everything is quoted and settled in.
- Their total supply is a liquidity gauge. Rising aggregate stablecoin supply = new money entering the ecosystem, more buying power in the system. Shrinking supply = money leaving, buying power draining. This is one of the cleanest macro-liquidity reads inside crypto, and it's public.
- They carry a real risk: the de-peg. A stablecoin is only as good as its reserves. If the market doubts the backing, the token can trade below $1 — a "de-peg."
Two de-pegs worth remembering
USDC briefly fell to about $0.87 during the March 2023 Silicon Valley Bank scare because Circle held a portion of its reserves at that bank, and for a weekend the market wasn't sure the cash was safe. It re-pegged once the deposits were guaranteed — but for 48 hours, "cash" wasn't worth a dollar.
The algorithmic stablecoin UST was worse: it collapsed to near zero in May 2022 and took roughly $40 billion with it, along with a chain of firms that had trusted its peg. It wasn't backed by dollars at all; it was backed by a reflexive mechanism that worked until confidence cracked, and then it worked in reverse, all the way down.
The lesson: know what backs the stablecoin you're holding. Prefer fully-reserved, audited, cash-and-Treasury-backed ones over exotic designs. Your "cash" is only cash if the peg holds, and pegs hold right up until the weekend they don't.
Custody and Self-Custody: Not Your Keys, Not Your Coins
This is the part with no equivalent in stock trading, and ignoring it has cost people everything they had.
When you buy stock, a regulated custodian holds it and you're insured against the broker vanishing. In crypto, you have a choice, and the choice is a genuine trade-off between convenience and control.
Custodial (the exchange holds your coins). You keep BTC on Coinbase, Binance, Kraken, or wherever you trade. Convenient, fast to trade, instantly liquid — but you don't hold the actual asset. You hold an IOU from the exchange, a database entry that says they owe you coins. If the exchange is hacked, freezes withdrawals, or is run by fraudsters (see: FTX, 2022, which vaporized billions in customer funds while telling everyone the money was safe), your coins can be gone with no recourse. "Not your keys, not your coins."
Self-custody (you hold your coins). You control a private key — a secret string that proves ownership and authorizes spending — usually via a hardware wallet (a physical device like a Ledger or Trezor that keeps the key offline, out of reach of internet-borne attacks). No counterparty can freeze, lend out, or lose your funds. But the responsibility is total: lose the key or the backup phrase (the "seed phrase," usually 12 or 24 words) and the coins are gone forever, with no password reset, no support line, no appeal.
The trader's practical split. Keep on the exchange only what you're actively trading — the working capital your process needs live access to. Move long-term holdings (your "cold" stack) to self-custody, write the seed phrase on something fireproof, and store it somewhere a flood or a burglar won't reach it. Never keep your life savings on a hot exchange because moving it is a hassle. The graveyard of crypto is full of people who were "going to move it later," right up until the morning the withdrawal button stopped working.
How Crypto Fits the Top-Down Process
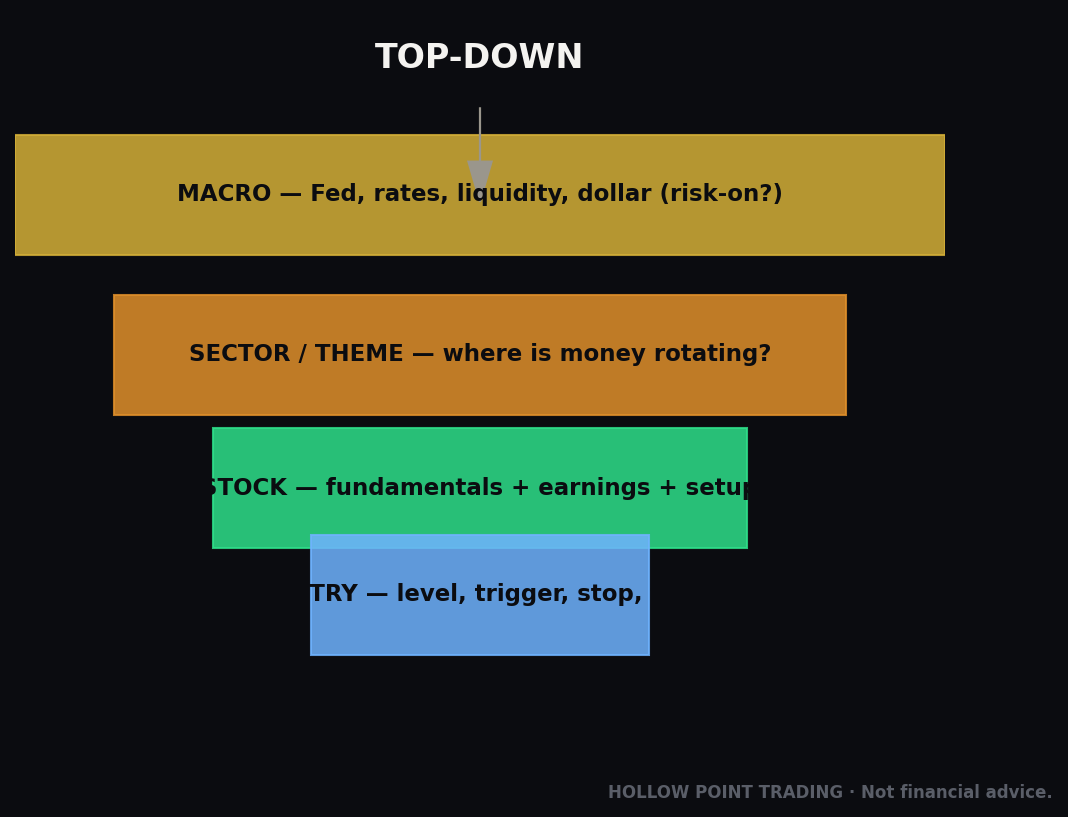
Now we assemble it into the Hollow Point workflow: macro → sector → instrument → technical → behavioral. Crypto slots in cleanly, and the discipline of running the whole ladder — every time, in order — is what separates a trader from a gambler holding a chart.
Macro — the regime
Start where you always start. What's global liquidity doing? Is the Fed easing or tightening? Where's the DXY (dollar index) — a falling dollar is a tailwind for crypto, a rising dollar a headwind. Where are real yields? Where's the Nasdaq trend on the daily EMA 12/22/55 stack? Crypto is a risk asset; if the macro tape is risk-off, you demote every crypto long to "prove it first." If SPX and NQ are bleeding below their 55 EMA, a crypto breakout is guilty until proven innocent. The highest-beta asset does not lead a risk-on turn while the benchmark risk index is still bleeding — occasionally, sure, but you make it earn that exception with real strength, not hope.
Sector — which regime within crypto
Is BTC dominance rising or falling? Is ETH/BTC turning up? Is capital risk-on internally (alts and ETH leading) or huddling in BTC? Where are we in the halving-cycle map — early accumulation, mid-cycle grind, or late-cycle euphoria? What's aggregate stablecoin supply doing — inflating (money entering) or contracting (money leaving)? This is your crypto-specific "sector rotation," and it decides what within crypto deserves your risk, not just whether crypto as a whole is in favor.
Instrument — BTC or ETH, spot or perp
Default to BTC and ETH. Default to spot until you've proven, over months and a real drawdown, that you can manage leverage without it managing you — perps are for when your process is already tight and boring. If you do use a perp, you check funding and open interest before you size, not after you're already in and wondering why the trade feels crowded.
Technical — the same tools you already trust
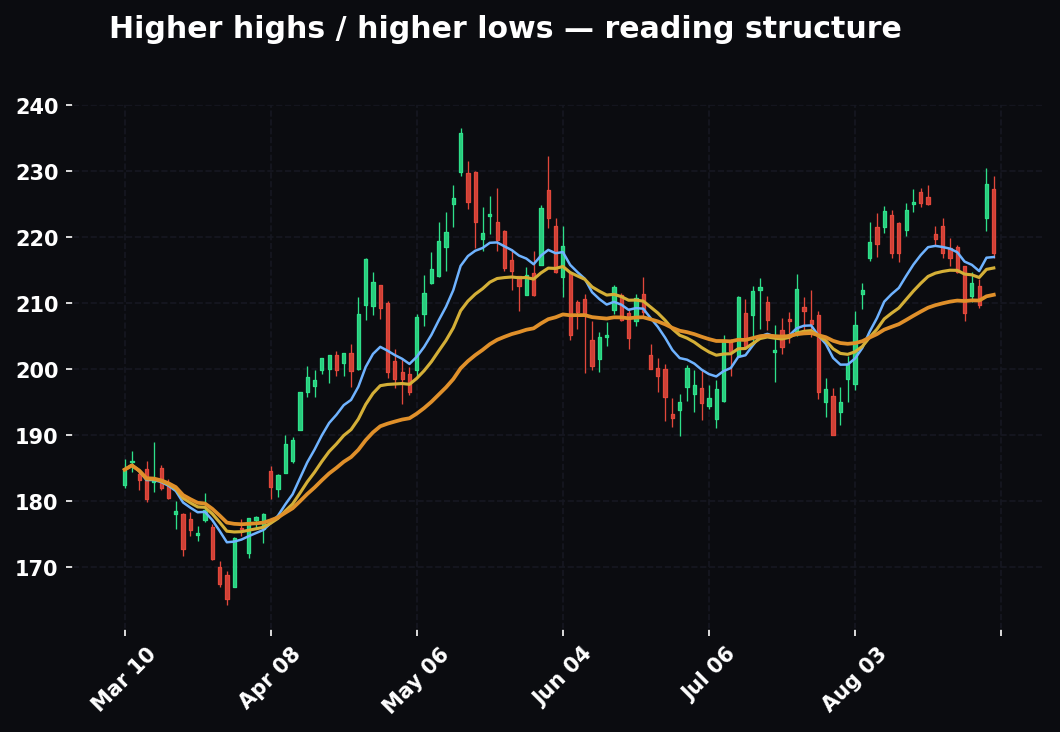
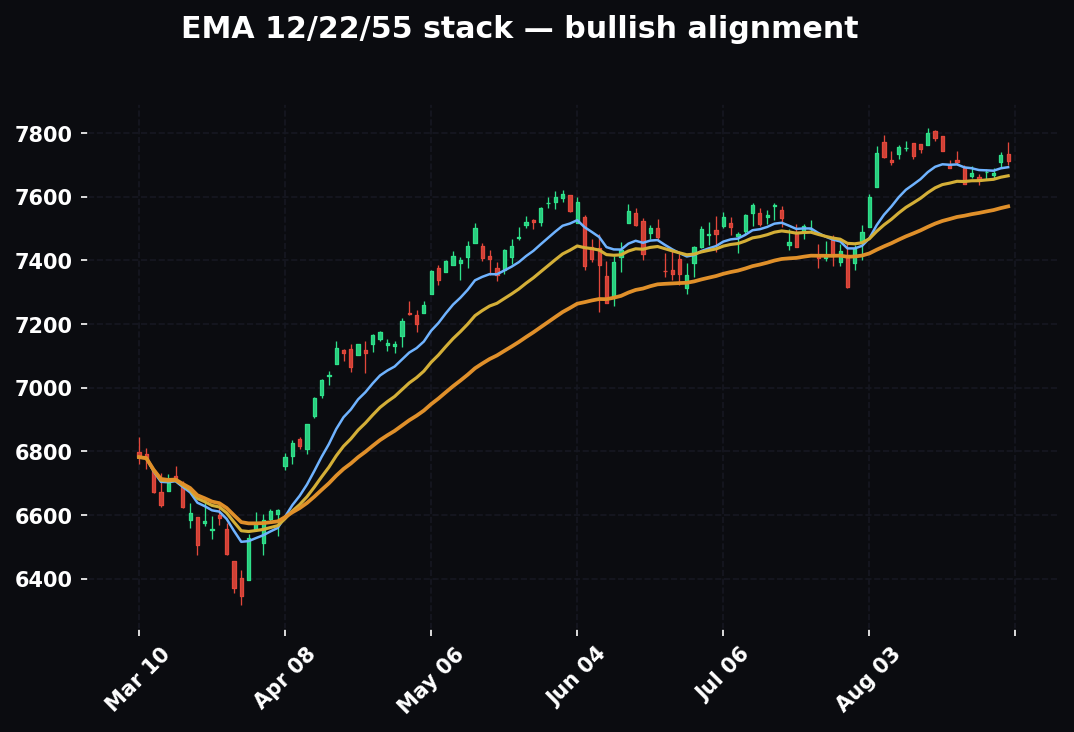
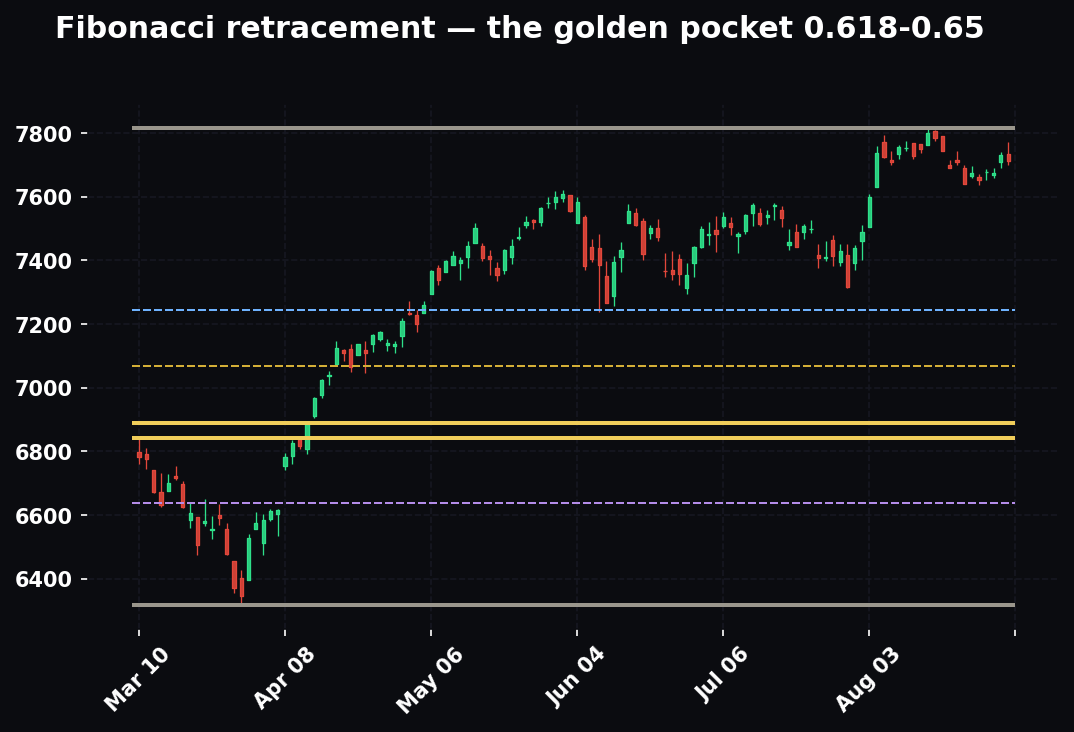
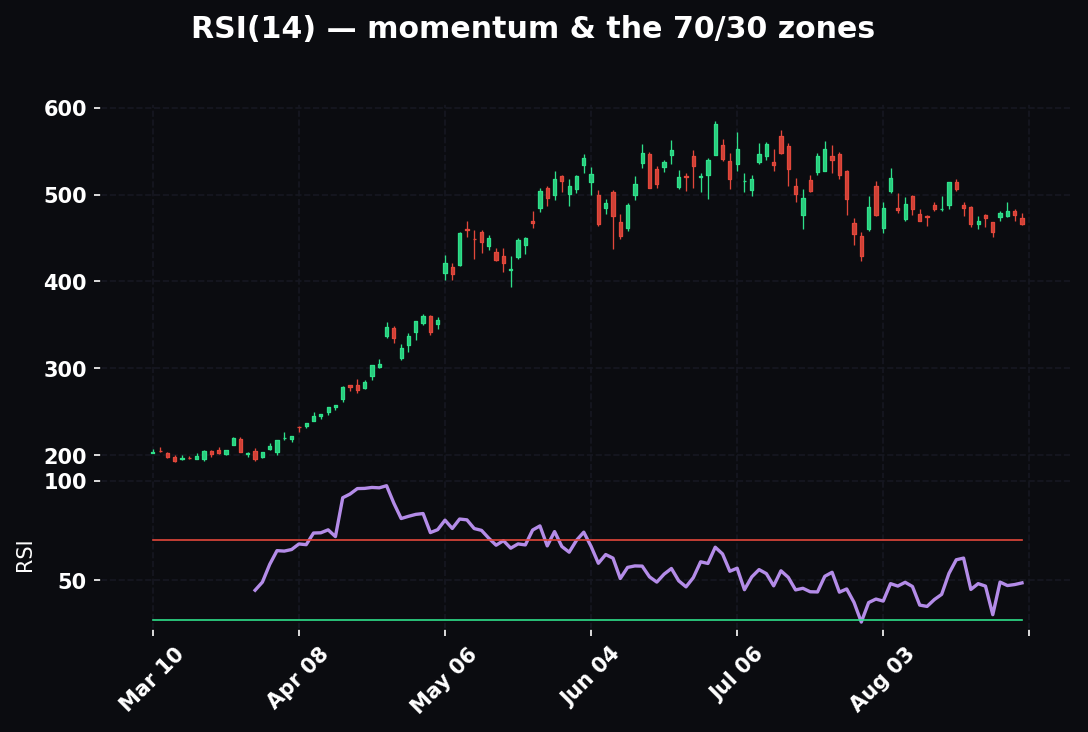
Crypto respects technicals beautifully because so much of the market is retail and algorithmic reading the same levels off the same charts. Apply the EMA 12/22/55 framework exactly as you do on NQ: the daily 55 EMA is the bias tell. Above it with the stack in order (12 over 22 over 55), you favor longs; below it with the stack inverted, you favor shorts or cash. Draw your horizontals, mark the prior significant high and low, identify the golden pocket (the 0.618–0.65 retracement) on the leg that actually matters. Round numbers ($100k, $50k, $4k, $3k) are psychological magnets and liquidity pools — stops cluster just beyond them, which is exactly why price is drawn to them. Volume confirms the move or it doesn't.
Behavioral — the crowd
This is where crypto gives you extra tools stocks don't: funding (leverage sentiment), open interest (how much is at stake), on-chain flows (real supply behavior), and social froth (when your barber, your group chat, and your uncle are all giving you alt tips, you're late, and you are the liquidity they'll sell into). Read the crowd, locate the extremes, and fade them at your level rather than joining them at theirs.
Then the trade — and the same rules
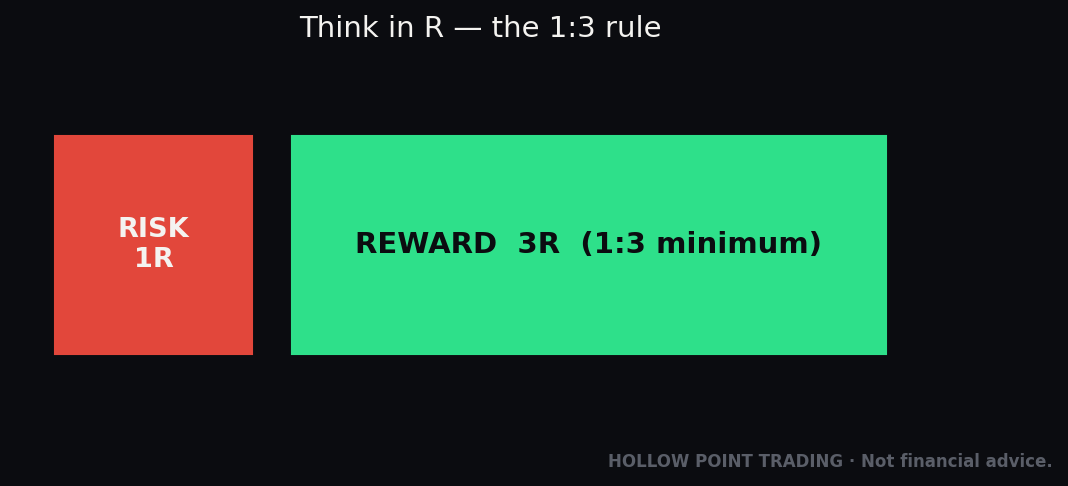
Entry at your level. Stop where the read is invalidated — below the swing, below the 55 EMA, beyond the range boundary, whatever your structure actually says, not wherever keeps the loss small enough to feel comfortable. And a minimum 1:3 reward-to-risk. Crypto's volatility actually helps here: the moves are big enough that a well-placed stop can be tight relative to a large, realistic target, so the geometry of a 1:3 is easier to find than in a slow-moving blue chip. But volatility cuts both ways, which brings us to the reality check that matters more than any setup.
Confluence: How Crypto's Tools Stack With the Rest of Your Kit
A single signal is a coin flip with better marketing. The edge is in the stack — when independent tools that measure different things all point the same way. Here's how crypto's native data combines with the technicals you already run.
Funding + structure + the 55 EMA
The cleanest crypto long-fade or long-entry comes when three unrelated things agree. Suppose BTC pulls back into the daily 55 EMA (technical support), funding has reset from very-positive back to neutral or slightly negative (the crowded longs have been flushed, the tax is gone), and price prints a reclaim of a prior swing high on rising volume (structure). That's three independent confirmations — trend, positioning, price action — lining up at one price. That is a trade you can size into. Compare it to the naked version: price is up, so you buy. Same direction, a fraction of the conviction, none of the edge.
On-chain + range + a level
A second stack. BTC has been ranging for six weeks between $58k and $64k. On-chain, exchange balances have bled to multi-year lows and stablecoin reserves on exchanges have climbed the entire time (supply leaving, dry powder building). You don't front-run it — you wait. When price finally closes above $64k (the range high, your level) with a funding rate that's not yet euphoric, the technical trigger and the on-chain lean and the positioning all agree. The on-chain data didn't tell you when; it told you which direction to trust when the level finally broke.
The anti-confluence — when tools disagree
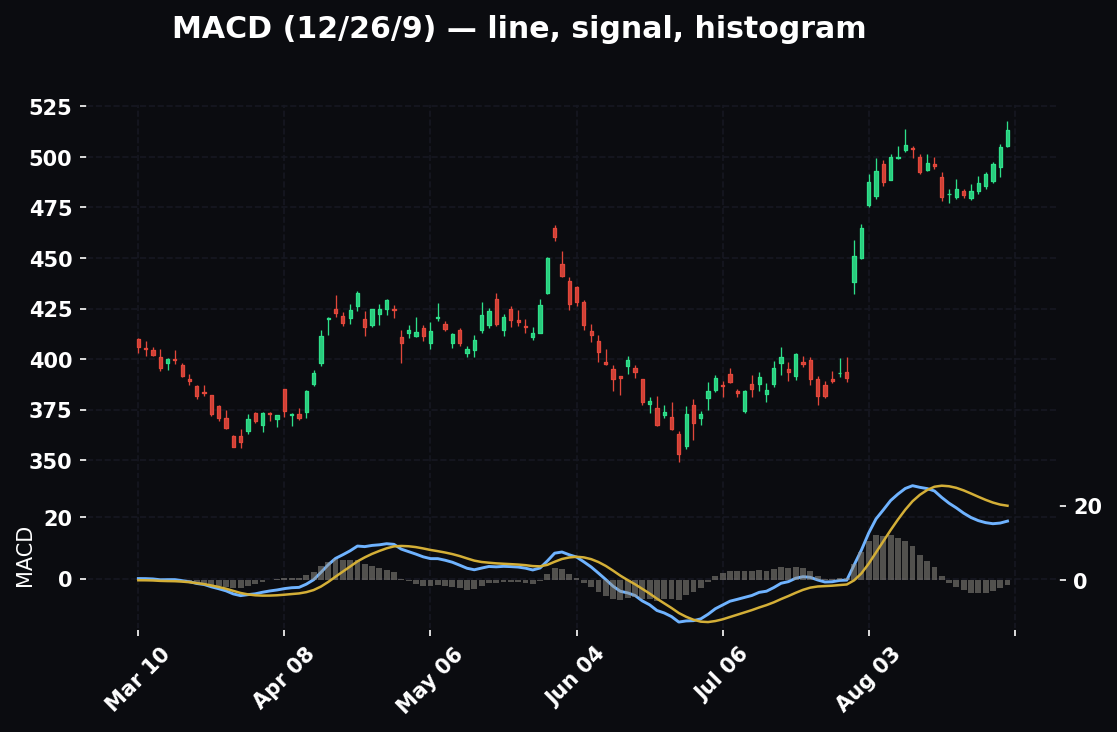
Equally important: when the tools fight, you stand down. Price breaks out (bullish technical) but funding is already at 0.1% and OI is at an all-time high (bearish positioning). That's not confluence, it's a trap — the breakout is real but it's happening on maximum leverage at the worst possible moment. Manufactured confluence, forcing the tools to agree by squinting, is how traders talk themselves into the exact trades they should skip. A weak stack gets called weak. No trade is a position.
Multi-Timeframe: Reading Crypto Across the Ladder
Crypto's 24/7 nature makes timeframe alignment even more valuable, because there's no daily reset to clean up messy intraday structure — the chart just runs.
- The higher timeframe sets the bias. The daily and weekly EMA 12/22/55 stack and the halving-cycle position define which direction you're allowed to lean. This is the anchor. You do not fight the weekly to catch a 15-minute wiggle.
- The intermediate timeframe finds the setup. The 4-hour and 1-hour define the range, the swing points, the level you're waiting for. This is where structure lives.
- The lower timeframe times the entry. The 5- and 15-minute give you the reclaim, the retest, the tight stop. This is where you pull the trigger, and only in the direction the higher timeframes already blessed.
The failure mode is inverting the ladder — falling in love with a 5-minute setup that fights the daily trend, sizing it like a conviction trade, and getting run over by the higher-timeframe current. Lower timeframes have less authority, not more. When the 15-minute and the daily disagree, the daily wins and the 15-minute is at most a scalp with a tight leash.
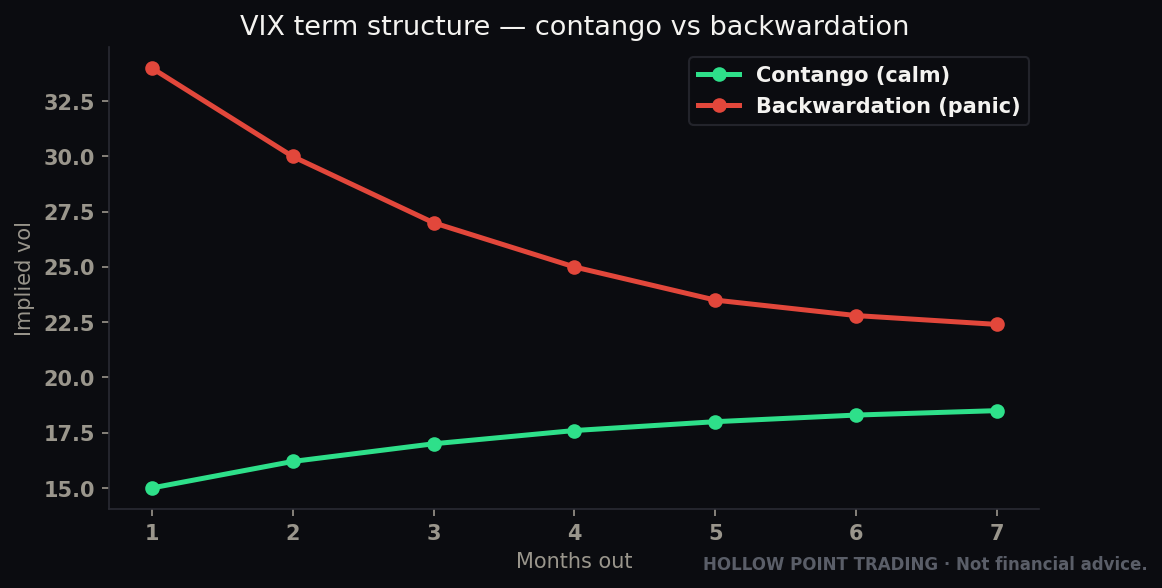
A concrete multi-timeframe read: weekly is above the 55 EMA and stacked (bias: long-only). Daily pulled back into its 22 EMA and is basing (the setup is forming). The 4-hour shows a tightening range with funding reset to neutral (positioning is clean). The 15-minute reclaims the range high on a volume pop (the trigger). Every rung agrees; you take the long at the reclaim with a stop below the 4-hour range low, targeting the prior daily high for a clean 1:3. That is what "timeframe-weighted confluence" means in practice — not a slogan, a checklist that the price either satisfies or doesn't.
Regime Playbook: Trend vs. Chop vs. High-Vol
The same setup behaves differently depending on the weather. Reading the regime first tells you which playbook to run and how much rope to give the trade.
Trending regime
Price is stacked on the daily EMAs and making higher highs and higher lows (or the inverse). Here, pullbacks to the 12 or 22 EMA are gifts, breakouts tend to follow through, and the losing trade is the counter-trend fade you took because something "looked too high." In a clean trend, funding can stay elevated far longer than feels reasonable — a rising market can carry crowded longs for weeks. You lean with the trend, buy the dips to your moving averages, and trail your stop. The mistake is picking the top.
Chop / range regime
Price is coiled around a flat 55 EMA, swinging between a defined high and low, and breakouts keep failing back into the range. Here the winning trade is the exact opposite of the trending playbook: fade the edges, buy the range low, sell the range high, and treat every "breakout" as guilty until it holds a retest. Funding tends to whipsaw with each fake-out, flipping positive at the highs and negative at the lows — which is itself the tell that no one's in control. In chop, the trader who keeps chasing breakouts gets chopped to death by design. Smaller size, tighter targets, more patience.
High-volatility regime
Ranges expand violently, wicks get long, funding swings to extremes, and liquidation cascades become frequent. This is where accounts die fastest, because the stops that were sensible in a calm market now sit inside the noise and get swept before the real move. In high-vol, you widen your stop and shrink your size to keep the dollar risk constant — never keep the size and hope the wider swings miss your stop. Some of the best entries live here (capitulation wicks that reverse hard), but only for the trader who pre-decided their level and their size before the volatility hit. If you're deciding size in the middle of a 10% candle, you've already lost the plot.
The meta-skill is this: identify the regime before you pick the setup. A breakout buy is genius in a trend and suicide in a range. The chart hasn't changed; the weather has.
Risk and Volatility Reality: Read This Twice
Crypto's volatility is not like stock volatility. It's a different animal, and respecting it is the entire difference between survival and a blown account. Everything above is tactics; this is the part that keeps you in the game long enough for tactics to matter.
The numbers. Bitcoin routinely has 5–10% daily ranges — a move that would be a headline event in the S&P is a quiet Tuesday in BTC. It has drawn down 80%+ from its highs multiple times in its history and each time recovered to new highs — but "eventually recovered" is cold comfort to the leveraged trader who was liquidated at the bottom, and no comfort at all to the alt-coin holder whose coin dropped 90% and simply never came back. Ethereum, the second-safest asset in the entire space, has had 80%+ drawdowns. Everything below the top two is more brutal, not less.
What this means for position sizing. If a stock strategy sizes for a 2% stop, a crypto position with the same dollar risk must be smaller in notional, because the price can travel the stop distance far faster and slip past it in a thin book. Size off your dollar risk and your stop distance, never off "how much I want to make." The professional approach is boring and it works: risk a fixed small percentage of the account — say 0.5% to 1% — per trade, and let crypto's big ranges deliver the 1:3 through the target, not through oversized size. Big ranges mean you don't need big size. The volatility is doing the work; you just have to survive it.
A position-sizing walk-through
BTC at $60,000. Your read says long, stop below the swing at $57,000 — a $3,000 stop distance, 5%. Account is $20,000, and you risk 1% ($200) per trade.
- Dollar risk ÷ stop distance = position size. $200 ÷ $3,000 = 0.0667 BTC, about $4,000 of notional exposure.
- That's 20% of the account in position, risking 1% of the account. If you're stopped, you lose $200 — an ordinary, forgettable loss.
- Target for 1:3 is $9,000 of profit on the trade's price move, which at 0.0667 BTC means a move to roughly $69,000. That's a 15% BTC move — large, but entirely normal for crypto. The volatility that threatens you also hands you the target.
Notice what you did not do: you didn't decide "I want to make $2,000, so I'll size up." You started from the loss, sized off the stop, and let the range provide the reward. Reverse that order and you're gambling with a chart open.
The leverage trap, stated plainly. Leverage doesn't just amplify gains; it amplifies the speed at which you're removed from the game. At 10x, a routine 10% crypto wiggle — a Tuesday — liquidates you. The liquidation isn't a stop-loss you chose at a level your analysis respected; it's the exchange seizing your collateral at a price the math dictated, and it often happens right at the wick low before price reverses back to exactly where you'd have been fine. The house doesn't need you to be wrong. It just needs you to be early and over-leveraged. Most beginners are removed not by bad analysis but by leverage turning a survivable drawdown into a terminal one.
The 24/7 tax on attention. You will not watch this market every hour, and pretending you will is a plan that fails the first night you sleep. Accept it. Structural stops resting on the exchange, position sizes small enough that a weekend gap doesn't matter, and no leverage you can't sleep through. Here's the tell: if a position size means you check your phone at 3 a.m., the size is wrong. Not the market — the size. Fix it by making it smaller, not by setting an alarm.
The regime flip that catches everyone. Remember the debasement-vs-liquidity distinction from the top of this guide. Most of the time crypto trades risk-on with the Nasdaq and the two narratives stack. But in an acute crisis, correlations go to 1 and everything is sold for dollars — Bitcoin included, briefly, violently. The "digital gold, uncorrelated hedge" story fails exactly when its holders expect it to work. Don't build a position on the assumption that crypto will save you in a crash. In the first leg of a crash, it usually leads the fall, and only later — after the money-printing response — does the hard-money bid return. Position for the leg you're actually in.
How the Pros Use This Differently From Beginners
Same charts, same funding screen, same on-chain dashboards — wildly different outcomes. The gap is almost never information. It's how the information is held.
Beginners predict; pros prepare. A beginner watches funding go extreme and thinks "the top is in, I'll short here." A pro watches the same reading and waits for price to confirm — a level to break, a swing to reclaim — because they know crowded can get more crowded and an extreme can extend for weeks. The beginner is betting on a forecast. The pro is reacting to a trigger. One of those is repeatable.
Beginners size off conviction; pros size off invalidation. Ask a beginner why they're in that size and the answer is "I'm really confident." Ask a pro and the answer is "because my stop is here and 1% of my account is there." Conviction doesn't set size — the distance to being wrong sets size. This is why pros survive a string of losses that would end a beginner: their worst trade was pre-measured and small.
Beginners see leverage as an accelerator; pros see it as a liability. The professional question is never "how much leverage can I use?" It's "what's the least I can use and still express this?" Most experienced crypto traders run spot or very low leverage precisely because they understand that the highest-beta asset on Earth doesn't need borrowed money to move. The volatility is already free. Adding leverage is paying to make a fast market faster in both directions.
Beginners chase; pros wait for the flush. When funding is euphoric and price is vertical, the beginner buys the continuation. The pro sits on their hands with a bid resting below, waiting for the liquidation cascade to hand them the same asset 15% cheaper from the traders who chased. The pro's best fills come from the beginner's worst decisions — that's not a metaphor, it's the literal mechanics of who's on each side of a liquidation.
Beginners hold one timeframe; pros hold the whole ladder. A beginner falls in love with the 5-minute. A pro never takes a lower-timeframe trade that fights the higher-timeframe bias, and they can tell you the weekly, daily, 4-hour, and 15-minute read before they name an entry. The trade is a consequence of the ladder, not a thing they spotted and then rationalized.
Beginners treat the thesis as the trade; pros keep them separate. "Bitcoin is the future of money" is a ten-year position held in cold storage. "BTC reclaimed the 4-hour range high with clean funding" is this week's trade with a stop. A pro can be structurally bullish for the decade and short for the afternoon without any internal conflict, because they never confused the two decisions. Beginners hold a losing leveraged long all the way down because "the technology is still revolutionary" — mixing a conviction that has no stop with a position that desperately needed one.
The Common Mistakes (A Blacklist)
1. Chasing green candles. Buying the breakout after a 40% run with funding at the moon. The crowd is already long and paying the tax; you're not early to a trend, you're the exit liquidity for the people who were. If the move already happened, the trade is finding where it flushes, not where it continues.
2. Using leverage before mastering spot. Perps before process is a countdown timer with your account name on it. If you can't be consistently disciplined in spot — where time is on your side and nothing can force-close you — leverage won't fix your process, it'll just make its flaws terminal faster.
3. Mental stops in a 24/7 market. The market trades while you sleep, and the worst move of the week has a habit of arriving at 3 a.m. your time. A stop that lives in your head is a stop that isn't there when it's needed. It must rest on the exchange, entered the moment you enter the trade.
4. Keeping everything on an exchange. Convenience today, catastrophe the day the exchange freezes withdrawals or turns out to have been lying about the reserves. FTX customers thought their money was safe until the morning it demonstrably wasn't. Trade-size on the exchange, stack in cold storage.
5. Trading the halving as a signal instead of a map. Known events are priced in. "Halving therefore up" is exactly the kind of belief that stops paying once everyone shares it. Use the cycle to know what emotional regime you're in, not to time an entry.
6. Ignoring funding and on-chain data. It's free, it's real-time, and no other market has it. Refusing to read the crowd's leverage and the actual supply flows is leaving your single biggest structural edge on the table to trade crypto like it's a slow stock. It isn't.
7. Assuming stablecoins are risk-free cash. Know what backs your "dollars." USDC touched $0.87 for a weekend; UST went to zero and stayed. Your cash is only cash while the peg holds, and the peg is only as sound as the reserves behind it.
8. Confusing the technology thesis with the trade. "Bitcoin is the future" is not a reason to hold a liquidated perp or average down into a knife. The decade-long thesis and this week's setup are two entirely different decisions with two entirely different risk profiles. Don't let one bankroll the other's mistakes.
9. Sizing off greed instead of stop distance. "I want to make $5,000" is not a position size; it's a wish. Crypto's ranges will deliver the R-multiple on their own if you let them. You supply the discipline and the small size; the volatility supplies the reward.
10. Believing crypto is an uncorrelated hedge. In a real liquidity crunch it's the first thing sold, not the safe harbor. Correlations go to 1 exactly when you were counting on them not to. Don't hold crypto as your crash insurance; in the first leg of a crash it leads the decline.
11. Overtrading the 24/7 clock. Because the market never closes, there's always another candle to react to, and beginners mistake constant activity for productivity. Most hours are noise. The absence of a closing bell is not an invitation to trade at every hour; it's a test of whether you can walk away from a market that never tells you to.
12. Revenge-trading a liquidation. Getting liquidated triggers a specific, dangerous impulse: to immediately re-enter, bigger, to "win it back," usually with even more leverage. This is how a bad night becomes a blown account. The liquidation already told you the size or the leverage was wrong. Doubling it is arguing with the messenger by lighting the house on fire.
FAQ
Should I start with spot or perps? Spot, without exception, until your process has survived a real drawdown. Perps add liquidation and funding on top of a market that's already the most volatile on Earth. Master the version where nothing can force-close you first.
How much leverage is "safe"? The honest answer most professionals live by: less than you think, and often none. If you must, low single digits (2–3x) with a stop that triggers well before the liquidation price, so you're never actually at the mercy of the liquidation engine. If your stop and your liquidation price are close together, your size is wrong.
Do I need to read on-chain data to trade crypto? No, but it's an edge you're leaving on the table if you skip it. Start with the two easiest reads — aggregate stablecoin supply (liquidity entering or leaving) and exchange balances (supply going to storage or coming to sell). Treat both as context that raises or lowers your conviction, never as a standalone trigger.
Why did my "stop" get skipped past? Two likely causes. Either you used a mental stop that wasn't actually resting on the exchange, or your stop sat in a thin part of the book (a weekend, or just beyond a round number where liquidity is sparse) and price gapped through it on a violent candle. In crypto, use stop-market rather than stop-limit for exits you truly need filled, and don't place stops in the obvious liquidity-void zones where everyone else's stops also sit.
Is Bitcoin or Ethereum "better" to trade? Different, not better. BTC is lower-beta, deeper, cleaner technically, and the macro-regime tell. ETH is higher-beta with an extra narrative layer, so it leads in strong risk-on and bleeds harder in risk-off. Beginners are usually better served learning on BTC, where the moves are large but slightly less unhinged.
What time frame should I trade? Whichever one matches how often you can actually be present and disciplined — but always with the higher timeframes setting your bias. If you can't watch screens intraday, trade the daily and hold spot. Don't scalp the 5-minute of a 24/7 market unless you've accepted that it will trade without you the moment you look away.
Does the funding rate predict direction? Not directly. It tells you where the crowd's leverage is leaning and therefore where the fuel for a squeeze sits. Extreme funding is a warning that a violent counter-move is possible, not a timing signal on its own. You still wait for price to trigger.
What happens to my perp in a flash crash if I'm asleep? If price hits your liquidation level, the exchange force-closes the position and your margin is gone — no phone call, no chance to add collateral in time. This is the entire argument for structural stops well above liquidation, small size, and, for most people, spot.
The Cheat-Sheet
The frame: Crypto = highest-beta liquidity/risk-appetite proxy. Long-term = debasement/hard-money thesis. Two narratives that stack most of the time and fight in a crisis. Trade it top-down, rules-first.
The two tickers: BTC = macro regime + reserve asset. ETH = higher beta + narrative layer. BTC dominance = fear vs. speculation. ETH/BTC ratio = internal risk appetite.
Spot vs. perps: Spot = ownership, max loss 100%, no liquidation, time on your side. Perps = leveraged derivative, liquidation risk, funding cost, early = dead. Default to spot.
Funding rate read: Neutral ≈ 0.01%/8h. Very high positive = crowded longs → long-squeeze fuel → don't chase. Deeply negative = crowded shorts → short-squeeze fuel. High funding + record open interest = empty tank at the worst price; wait for the reset.
Open interest read: Price up + OI up = fueled trend. Price up + OI down = squeeze (fragile). Price down + OI up = real down-move. Price down + OI down = capitulation near exhaustion.
On-chain read: Exchange balances falling = bullish supply (coins to storage). Rising = distribution risk. Stablecoin reserves rising = dry powder building. Whale inflows near highs = watch for distribution. Context, not trigger.
Halving map: ~Every 4 years, issuance halves (2012/16/20/24). Bull historically 12–18 months after; then 70–85% bear; then base. ETFs may reshape the rhythm. Regime map, not a signal.
Stablecoins: USDT/USDC = the dollar of crypto + a liquidity gauge. Aggregate supply up = money entering. De-peg risk is real (USDC $0.87, UST → 0) — know the reserves.
Custody: Trade-size on the exchange; long-term stack in self-custody (hardware wallet, seed phrase stored safely). Not your keys, not your coins.
Regime playbook: Trend = buy dips to the EMAs, don't pick tops. Range = fade the edges, distrust breakouts. High-vol = widen the stop, shrink the size, keep dollar risk constant.
Multi-timeframe: Weekly/daily set bias → 4H/1H find the setup → 15m/5m time the entry. Never let a lower timeframe overrule a higher one.
Risk rules (non-negotiable):
- Structural stops on the exchange, always — stop-market for exits you need filled.
- Size off dollar risk and stop distance, never off desired profit.
- Minimum 1:3 R/R.
- Risk ~0.5–1% of account per trade.
- No leverage you can't sleep through — spot until your process is proven.
- Daily 55 EMA = bias tell; align with the macro tape (DXY, yields, NQ).
- Weekends are thin — expect outsized moves on low volume.
- If a position size wakes you at 3 a.m., the size is wrong.
The whole thing in one breath: Read the macro liquidity regime first. Confirm the crypto-internal regime (dominance, ETH/BTC, stablecoin supply, cycle position). Identify the weather — trend, chop, or high-vol — and pick the matching playbook. Pick BTC or ETH, default to spot. Align the timeframe ladder from weekly bias down to entry trigger. Wait for your level on the daily-55-EMA-aligned technical read. Check funding, open interest, and flows to confirm the crowd isn't already all-in on your side. Enter at the level, stop where you're wrong, target 1:3, size small. Then let the market do whatever it wants while you sleep — because your stop is already on the exchange, and your size is already small enough not to care.
That's not gambling. That's a trader treating the wildest market on Earth with the same rules that keep you alive in every other one.
Bound by rules, feared by trade.