
You nailed it. You said NVDA would beat, it beat, the stock gapped up, and your calls opened down. You stare at the screen doing the math three times because it doesn't compute. The stock is higher. Your long calls are red. Welcome to the single most expensive lesson retail traders pay for over and over: earnings is not primarily a bet on direction. It's a bet on volatility, and the house prices that volatility with brutal precision.
This is the guide I wish someone had handed me before my first earnings season. We're going to take apart the machine piece by piece — the expected move, the IV ramp, the crush, why naked options bleed even when you're right, the defined-risk structures that let you actually express a view, how the whole thing behaves in trending versus choppy versus high-vol markets, how it looks across timeframes, and how it stacks with the other tools in the kit. Then we fold it into the Hollow Point top-down process so it stops being a casino game and becomes a trade with rules.
By the end you'll have a full playbook, a dozen worked examples with real numbers, a long list of the mistakes that drain accounts, the difference between how a beginner and a professional touch the same print, a FAQ, and a one-page cheat-sheet you can keep next to the screen.
The Concept: You're Buying Two Things, Not One
When you buy an option, the price you pay has two moving parts that matter for earnings: direction (will the stock move up or down, and how far) and volatility (how much uncertainty is priced into that move). Most new traders only think about the first one. The market makers on the other side of your trade think mostly about the second.
Here's the core term you need, defined once and used forever: implied volatility (IV) is the market's forecast of how much a stock will move, expressed as an annualized percentage, and baked into the option's price. High IV means expensive options. Low IV means cheap options. IV is not a prediction of which way — it's a prediction of how much.
Before an earnings report, nobody knows the number. Uncertainty is at its maximum. So IV ramps up — options get expensive — because a big move is genuinely possible in either direction. The moment the report drops, the uncertainty resolves. The number is known. And IV collapses almost instantly. That collapse is called IV crush, and it is the reason your right call can lose money.
Think of it like buying flood insurance the night before a hurricane makes landfall. The premium is sky-high because the risk is real and imminent. The morning after — whether the flood came or not — that same policy is nearly worthless, because the event has passed. You didn't buy the flood. You bought the uncertainty about the flood. Earnings options are the same. You're buying uncertainty, and uncertainty has an expiration date measured in hours.
The three Greeks that actually run the trade
Options textbooks list five Greeks. For earnings, three of them decide your P&L, and you need a plain-English grip on each before you place a single trade.
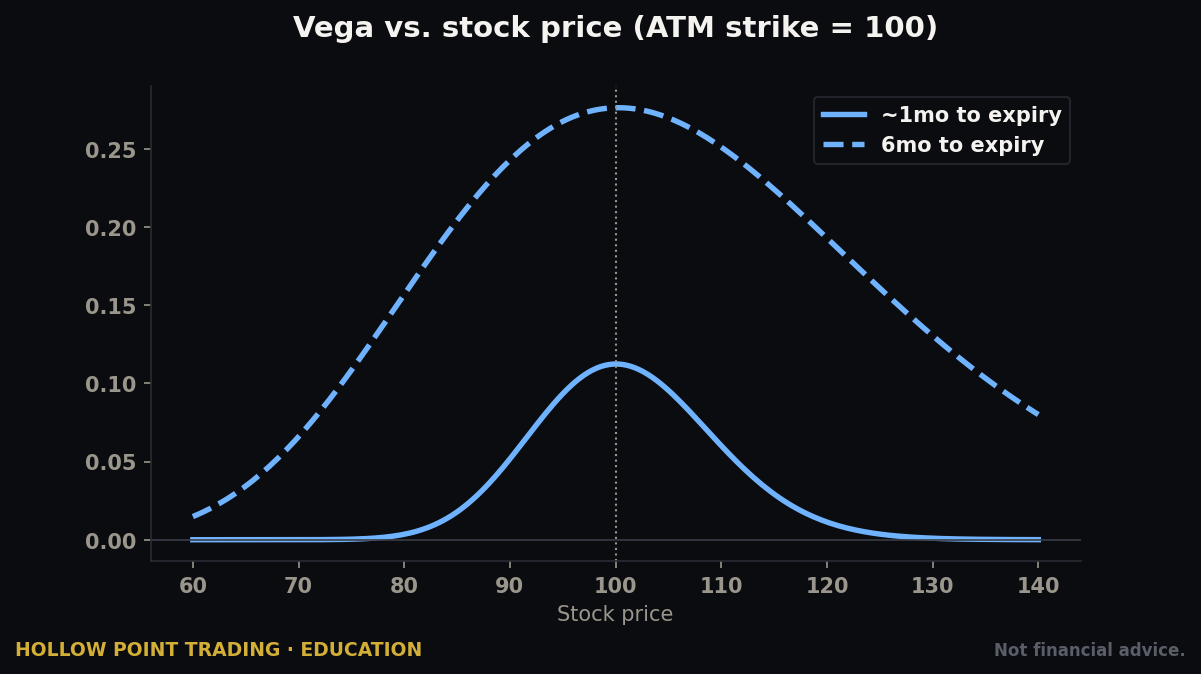
Vega is your exposure to volatility itself — how much your option's price changes for each one-point move in IV. When you buy a naked option into a print, you are long vega. That sounds fine until you remember IV is about to fall off a cliff. A long-vega position into guaranteed IV crush is a boat with a hole drilled in it below the waterline. When you sell premium — a condor, a credit spread — you are short vega, and the crush is now the wind at your back.
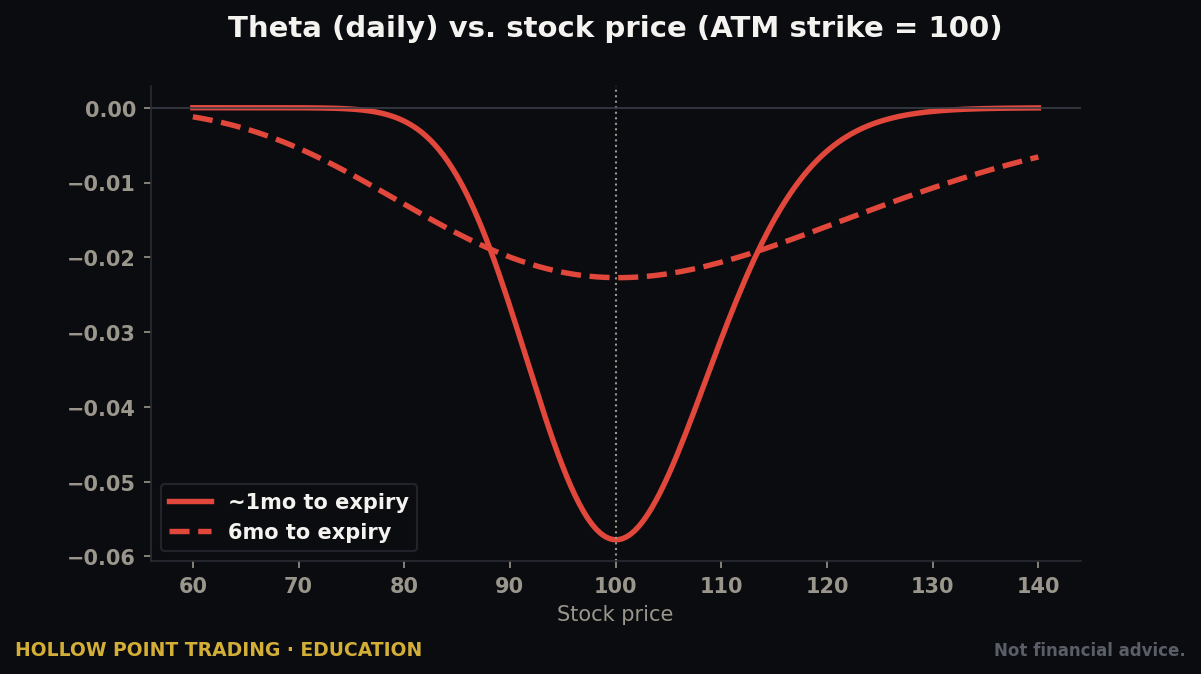
Theta is time decay — how much value an option loses each day just from the clock ticking. Weekly options into earnings carry brutal theta because there is almost no time left in them. A weekly that expires two days after the print is losing meaningful value every single hour.
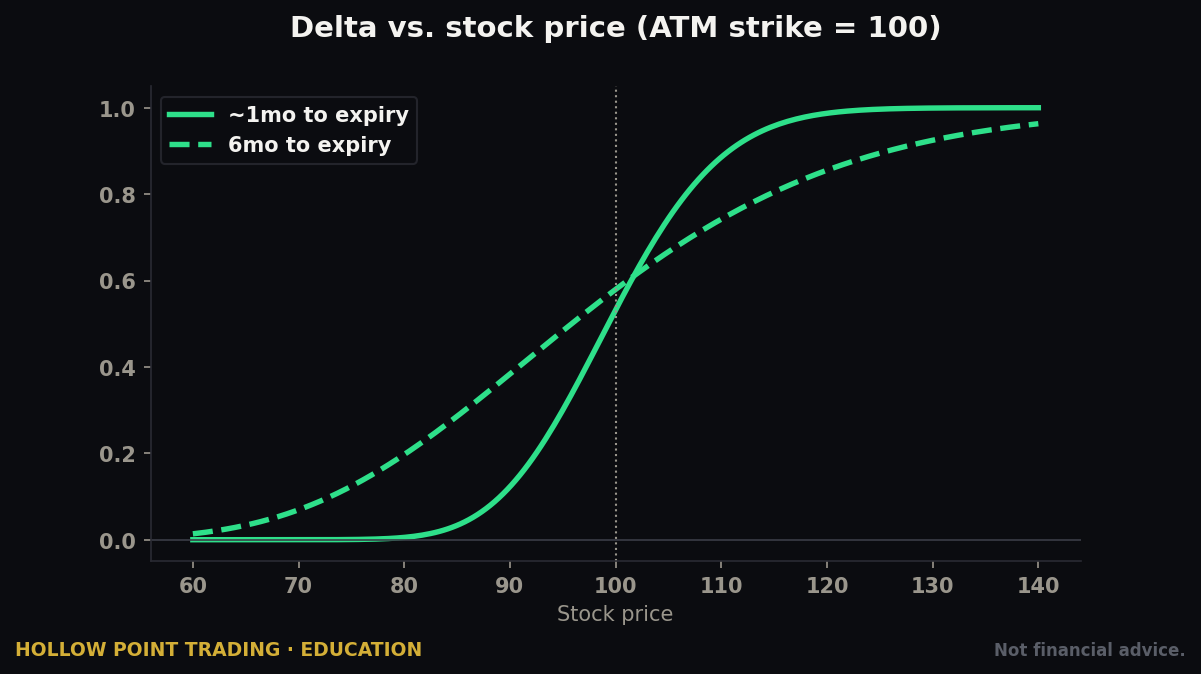
Delta is your directional exposure — how much the option moves per dollar of stock movement. This is the part beginners fixate on, and it's the only one they think about. Delta is real, but at an earnings event it is routinely swamped by vega and theta working together against a long buyer.
Hold this in your head: at a normal, quiet time, delta is the main character. At an earnings print, vega is the main character and delta is a supporting actor. The entire trap comes from traders who cast delta as the lead in a movie that vega is directing.
The Mechanism, Part 1: The Expected Move
The market tells you exactly how far it thinks the stock will move on earnings. You just have to know where to read it. This is the expected move — the magnitude of the move (up or down) that options pricing implies for the event, usually to the next expiration.
The cleanest way to read it is the at-the-money (ATM) straddle. A straddle is buying the call and the put at the same strike — the strike closest to the current price — in the expiration that captures the event (typically the nearest weekly after the report). Add the call price and the put price together. That combined premium, in rough terms, is the expected move in dollars.
Worked example. Say XYZ trades at $100 the afternoon before earnings. The weekly $100 call is trading $3.20 and the $100 put is trading $2.90. Straddle = $3.20 + $2.90 = $6.10. The market is pricing roughly a ±$6.10 move, or about ±6.1%. That means the "in the box" range is about $93.90 to $106.10.
A slightly more precise version people use: expected move ≈ ATM straddle × 0.85, because the raw straddle overstates the move a bit (it includes some residual time value). So $6.10 × 0.85 ≈ $5.18, or ±5.2%. Either number is close enough to trade around. The point is you now have a market-implied range, and it's the single most useful piece of information for the entire trade.
There's an even more careful method the desk uses when the straddle's own expiration extends well past the event. You add the ATM straddle to roughly 30% of the first out-of-the-money strangle. If the $100 straddle is $6.10 and the $105/$95 strangle is worth $3.00 combined, the refined expected move ≈ $6.10 + (0.30 × $3.00) = $7.00. You don't need this precision for most trades, but know it exists so you understand the ballpark number is a range, not a law of physics.
Why does this matter so much? Because your directional call has to beat the expected move to win, not just be right on direction. If XYZ reports a great quarter and rises $4 — inside the $6.10 expected move — the options were priced for more than that. IV crush plus the move falling short of expectations means your call can still lose. You were right on direction and the market still took your money, because the move it demanded was bigger than the move it got.
This is the trap in one sentence: the market makes you pay for the move before you know if it happens, and then only pays you if the move exceeds what you paid.
Reading the expected move against history
The expected move alone is only half the picture. The other half is what the stock actually does, print after print. Pull up the last eight earnings reactions and write down the absolute overnight move each time. Say a name has moved 3.1%, 2.4%, 4.0%, 2.9%, 3.3%, 2.1%, 3.8%, and 2.6% on its last eight prints. The average realized move is roughly 3.0%. Now the market is pricing a 6.1% expected move into tomorrow's print. That is a screaming tell: the market is charging you double what this stock historically delivers. That's a premium-selling setup, not a premium-buying one.
Flip it. A different name has expected move of 4.0% but its last eight realized moves average 6.8%. The market is underpricing the event relative to how this stock behaves. That's the rare setup where defined long-volatility structures earn their keep. This single comparison — implied versus realized — is the difference between guessing and having an edge, and we'll return to it in the top-down funnel.
The Mechanism, Part 2: The IV Ramp
IV doesn't jump the instant before the report. It builds. In the days and sometimes weeks heading into a print, front-month IV climbs steadily as the event approaches and the uncertainty concentrates into fewer and fewer trading days.
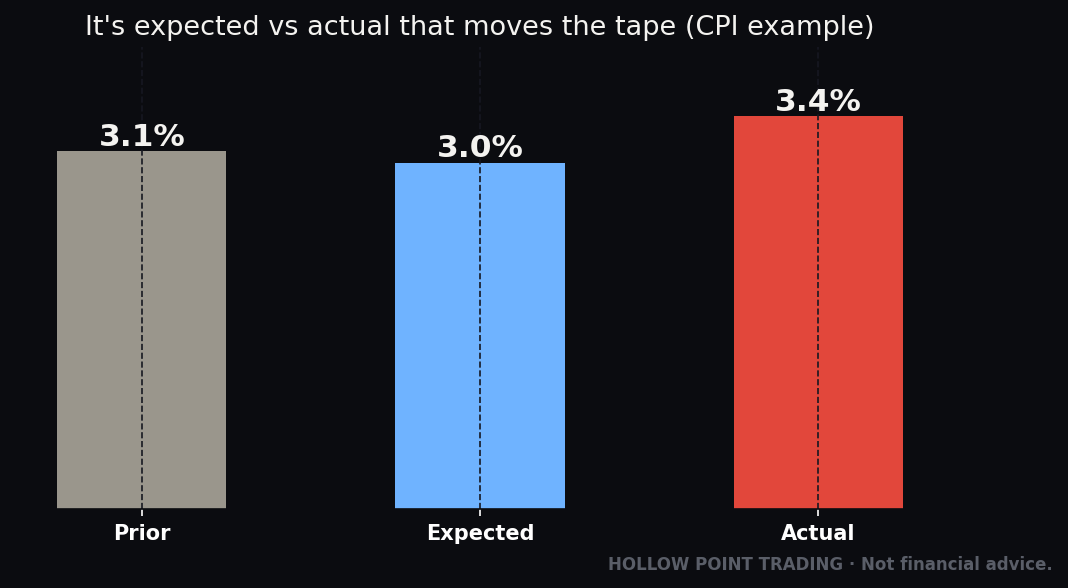
You can watch this directly with IV percentile or IV rank — tools on most platforms that tell you where current IV sits versus its own history over the past year. An IV rank of 80 means IV is higher than it's been 80% of the past year. Into earnings, you'll routinely see front-week IV rank spike toward the top of the range while the back months stay comparatively calm. That gap between front and back is the market saying: "the risk is concentrated in this one event."
This ramp is why selling premium into earnings is even a strategy. If you know IV is inflated and will collapse, you can position to be the seller of that expensive insurance rather than the buyer. More on that shortly. But first, understand the ramp is predictable in shape even though the direction of the stock is not. That asymmetry — predictable volatility behavior, unpredictable direction — is the whole game.
The term structure: front vs. back
Take the concept one step deeper. Line up IV by expiration — the front weekly, the next weekly, the monthly, the quarterly — and you get the term structure. In calm conditions this line slopes gently upward: further-dated options carry more IV because more can happen over more time. Into earnings, the front expiration that contains the print pokes above the rest of the curve. The market has stuffed one binary event's worth of uncertainty into a single expiration.
That local bump is called backwardation in the term structure, and it is the fingerprint of an event the market is bracing for. After the report, that bump collapses and the curve returns to its normal upward slope. When you sell a front-week condor and buy a back-month calendar, you are trading the shape of this curve directly — betting the front bump crushes harder than the back. Seeing the term structure lets you stop trading blind: you can literally look at the curve and see where the event risk is priced.
Timing the ramp
The ramp is not linear. IV typically starts creeping about two weeks out, accelerates in the final three to five sessions, and does its steepest climb in the last day or two before the print. This matters for when you put on a premium-selling structure. Sell too early and you've collected a thin credit while giving the stock days to wander into your short strikes before the event even happens. The desk convention is to put earnings condors and credit spreads on the afternoon of the print, capturing the fattest, most inflated premium right before the crush — not three days early when the premium is only half-ramped and you're exposed to ordinary price drift for no extra reward.
The Mechanism, Part 3: The Crush
The report drops after the close (or before the open). The number is now known. Every option that was pricing "we don't know what happens" instantly reprices to "we know what happened." Front-month IV can fall 30, 40, 50 points in a single session. That's the crush.
Worked example — the right call that lost. Back to XYZ at $100, expected move ±$6.10. You buy the weekly $100 call for $3.20 the afternoon before. Its IV is 95%. The company reports a solid beat and the stock opens at $104 — up $4, a genuinely good result and a correct directional call.
But: your call is now $4 in-the-money, so its intrinsic value is $4.00. The problem is what happens to the extrinsic (time and volatility) value. Post-report, IV collapses from 95% to maybe 45%. The call that was $3.20 — of which $0 was intrinsic and $3.20 was pure extrinsic — is now worth about $4.30. You made $1.10. Fine, you won, barely.
Now run the more common version: the stock opens at $102, up $2, still a correct call. Intrinsic value is $2.00. IV crushes to 45%. Your $3.20 call is now worth about $2.35. You were right and you lost 27%. The stock went the direction you predicted and your position is red because the move ($2) came in well under the expected move ($6.10) and the crush ate the rest.
That is the naked-long-option earnings trap in numbers. You don't just need to be right. You need to be more right than the market demanded — you need the realized move to exceed the expected move, in your direction, fast enough to outrun the crush. That's a high bar, and you're paying maximum premium to attempt it.
The breakeven math, laid bare
Let's make the bar explicit. Your $3.20 call breaks even, at expiration, at $103.20 (strike plus premium). But you're not holding to expiration — you're likely closing the morning after. Post-crush, the intrinsic-plus-shrunken-extrinsic breakeven is closer to needing the stock at roughly $103.20 the next morning just to get your money back, and that's inside the $6.10 expected move. In other words, the market priced a ±$6.10 move, and you need a +$3.20 move just to break even on a correct directional call. Every dollar of that gap between "the move I need to break even" and "the move the market priced" is the toll the crush collects. Once you can see that toll in dollars, the naked long stops looking like a bet and starts looking like a fee you volunteered to pay.
Why Buying Naked Options Into Earnings Usually Loses
Let's make the edge explicit. When you buy a naked call or put right before earnings, three forces are stacked against you at once:
One: you buy at peak IV. You are paying the single most expensive price of the entire quarter for that option. The insurance is at its most overpriced exactly when you're buying it.
Two: the crush is near-certain. Direction is a coin flip, but IV collapse is almost guaranteed. You are taking on a guaranteed headwind to chase an uncertain tailwind.
Three: theta accelerates. Weekly options into earnings have brutal theta because there's almost no time left. Even if the stock moves your way, you're fighting the calendar.
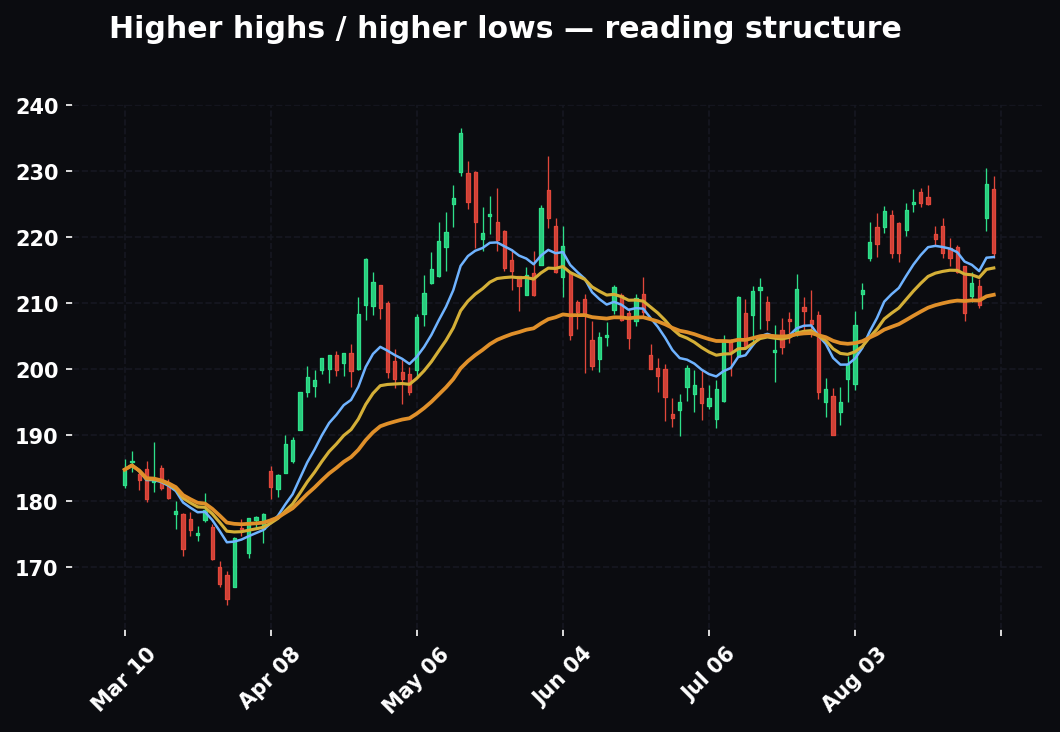
Put it together and the naked earnings buyer needs the stock to move beyond the expected move, in the right direction, immediately, just to break even against the crush and decay. Over hundreds of prints, that's a losing proposition. Not because directional reads are worthless — because the structure forces you to overpay and then bleed. The vehicle is wrong, not necessarily the view.
This is the discipline lesson at the heart of the HPT approach: a right read expressed through the wrong instrument is still a loss. The market doesn't pay you for being right. It pays you for being right in a structure that survives the mechanics.
The one time a naked long is defensible
Rules earn respect by admitting their exceptions. There is a narrow case where buying a naked option into a print is a real trade, not a donation: when implied volatility is genuinely underpricing the event. If a stock routinely moves 8% on earnings and the expected move is pricing only 4%, the option is cheap relative to the stock's own behavior, and a long has positive expectancy despite the crush — because the crush is small when IV wasn't inflated much to begin with. This is rare. It shows up most often in under-followed mid-caps, in names with a fresh catalyst the options market hasn't caught up to, and in the second or third print of a new story stock before the market learns how violently it moves. Even then, size it as a lottery ticket, not a core position. The default remains: naked long into a normal, fully-priced print is a losing structure.
Defined-Risk Earnings Plays
If naked longs overpay for the crush, the answer is to build positions where the crush works for you, or at least doesn't destroy you — and where your risk is defined to the dollar before you enter. Here are the workhorses.
Selling Premium: The Iron Condor
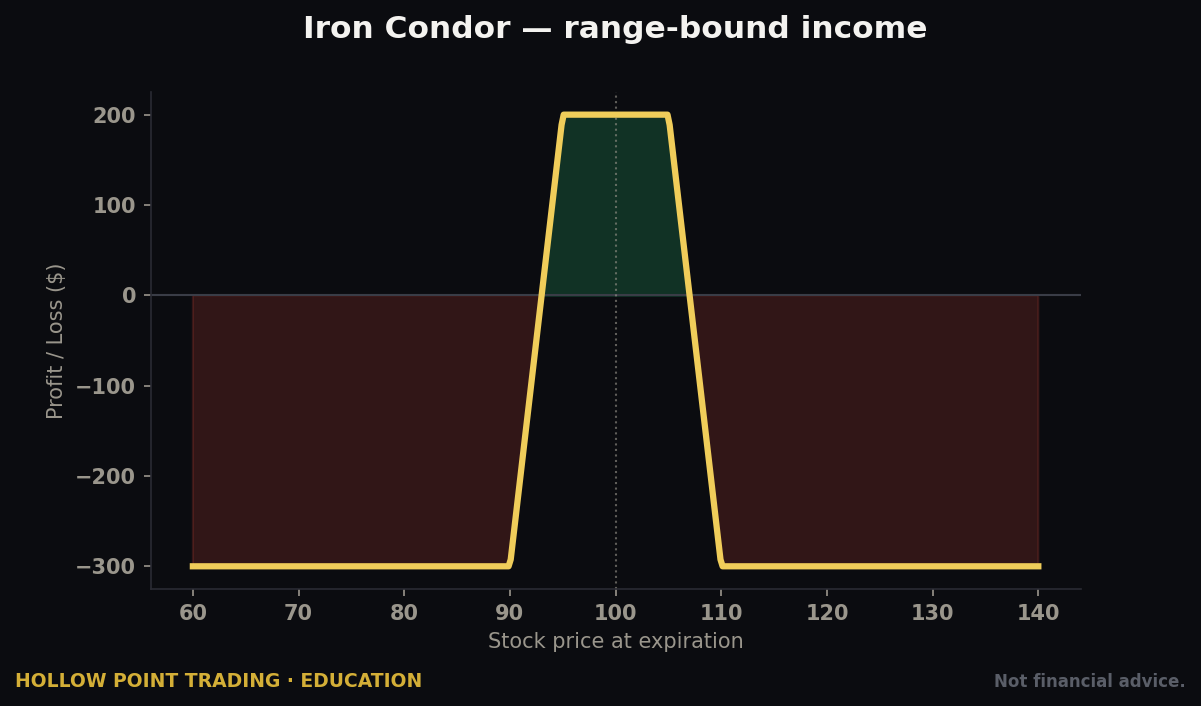
The iron condor sells the expected move. You sell an out-of-the-money call spread and an out-of-the-money put spread simultaneously, collecting premium on both sides. You're betting the stock stays inside the expected-move range. When IV crushes after the report, the value of the options you sold collapses — and since you're short them, that collapse is your profit.
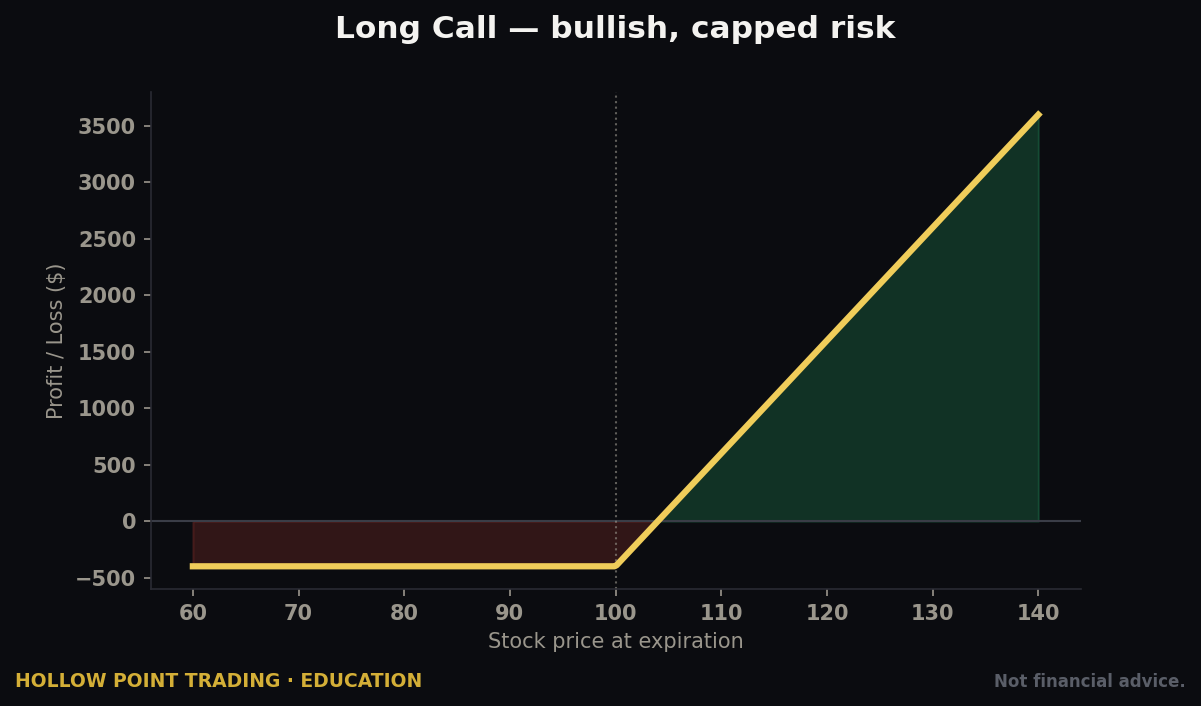
Worked example. XYZ at $100, expected move ±$6.10. You sell the $107 call and buy the $110 call (a $3-wide call spread), and sell the $93 put and buy the $90 put (a $3-wide put spread). Say you collect $1.00 total credit. Your max profit is that $1.00 (per share, so $100 per condor) if XYZ lands anywhere between $93 and $107 at expiration. Your max loss is the width minus the credit: $3.00 − $1.00 = $2.00 ($200), and it's capped — you can't lose more no matter what.
You win if the stock stays inside your short strikes, which are placed outside the expected move. You're explicitly betting the move comes in smaller than the options priced. Historically, realized earnings moves come in under the implied move more often than not — that's the statistical tailwind of premium selling. The risk: when a stock blows through the expected move (a genuine surprise), condors take the max loss. Defined, but real. Position size accordingly.
Placing the short strikes: the craft of the condor
Where you set the short strikes is the whole trade. Set them right at the expected-move boundary and you collect fat premium but you'll get tagged often — any move that merely meets expectations threatens you. Set them a full expected move out and you're safe more often but the credit is so thin the risk/reward is ugly. The desk compromise: place the short strikes just outside the expected move — at roughly 1.0 to 1.2× the expected move — where the probability of the stock finishing inside is high and the credit is still worth collecting.
Run the numbers on the trade above. You risk $2.00 to make $1.00 — a 2:1 risk/reward against you on paper. That only makes sense because the probability is heavily in your favor: if the stock stays in the box 70%+ of the time, positive expectancy holds. This is the mirror image of a directional trade. A condor is a high-probability, poor-payout trade; you win small often and must keep the occasional max loss from erasing a month of wins. That's why sizing is everything — a condor blown through when you're too big undoes ten clean ones.
The Short Strangle and Why Most Retail Shouldn't Touch It
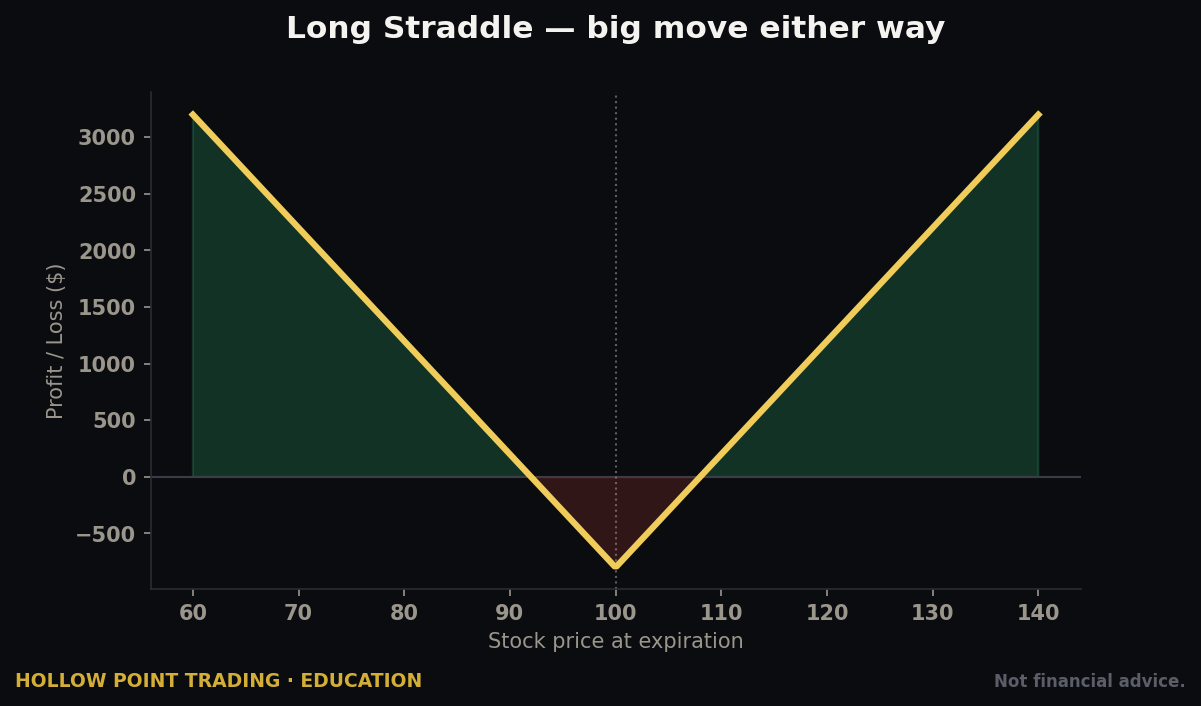
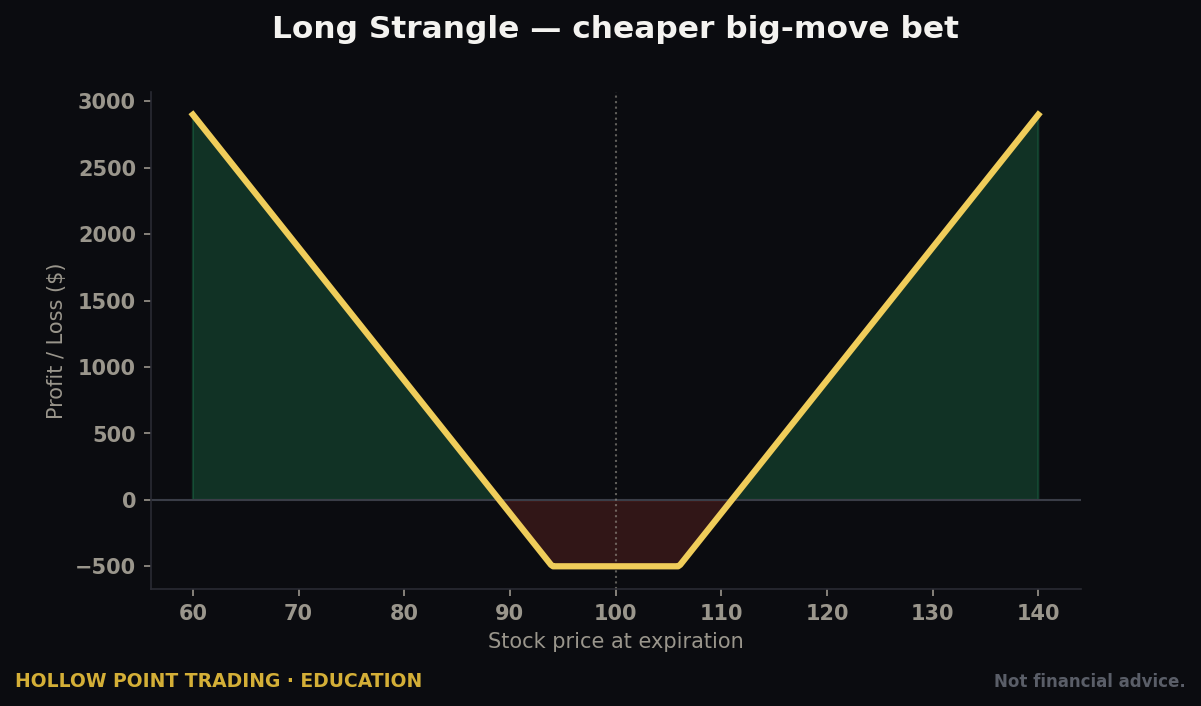
The condor's undefined-risk cousin is the short strangle — sell the OTM call and the OTM put with no long wings protecting you. It collects more premium because you're not paying for the wings, and it profits harder from the crush. It's also how accounts die overnight. A stock that gaps 25% through your short strike has no cap on your loss. Professional volatility desks run short strangles with deep capital, dynamic hedging, and portfolio margin. Retail should treat the strangle as a warning label, not a strategy — the wings on a condor cost you some credit and buy you the one thing that matters at a binary event: a known worst case.
Buying Cheap Volatility Structures the Right Way
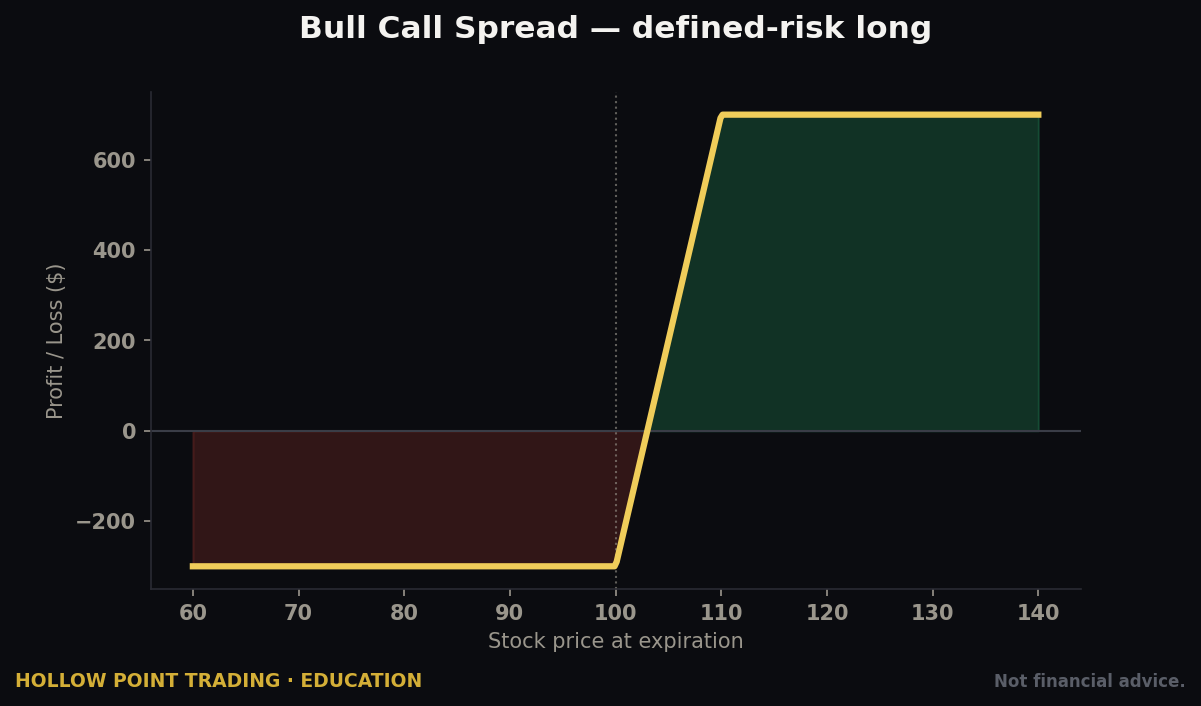
Sometimes you want long exposure to a big move — you think the market is underpricing the volatility. The trick is doing it without overpaying pure premium. A call spread or put spread (buy one option, sell a further-out one against it) reduces the IV crush hit because the option you're short also loses value in the crush, offsetting part of the loss on the option you're long.
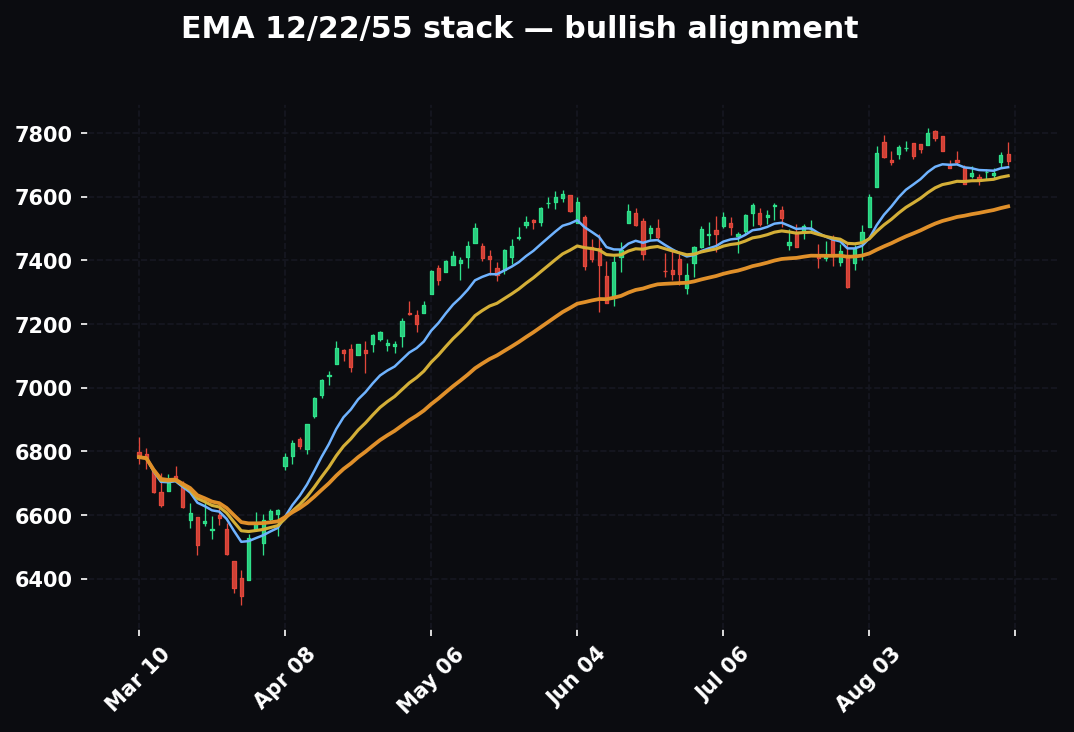
Worked example. Instead of the naked $100 call at $3.20, you buy the $100/$106 call spread: long the $100 call at $3.20, short the $106 call at $1.40, net debit $1.80. Max profit is the $6 width minus the $1.80 debit = $4.20 if XYZ closes at or above $106. Max loss is your $1.80. When IV crushes, the $106 call you're short crushes too, cushioning your long. You've capped your upside, but you've slashed what you paid and neutralized a chunk of the crush. On the $102 outcome that lost 27% naked, the spread fares meaningfully better because the short leg absorbs crush.
Let's actually run that $102 outcome through the spread. Post-crush the long $100 call is worth about $2.35 (as before). The short $106 call, now further out of the money with IV crushed, might be worth about $0.55. Your spread is worth $2.35 − $0.55 = $1.80 — you're roughly flat, versus down 27% naked. The short leg's crush and decay clawed back the loss. That's the entire point: at an event, the leg you're short is doing defensive work for you.
The Calendar and the Neutral Plays
For traders who specifically want to harvest the front-vs-back IV gap, a calendar spread — sell the front-week option (max IV, max crush), buy a later-dated option at the same strike (less inflated) — profits from the front leg crushing harder than the back. These are more advanced and sensitive to how far the stock moves, so treat them as a graduate-level tool, not a first earnings trade.
The calendar's catch: it wants the stock to sit near the strike after the print. It's a bet that the move is small AND the front IV crushes harder than the back — a two-condition trade. If the stock rockets through the strike, the calendar loses because your short front leg goes deep in-the-money against you faster than the crush helps. Use calendars when your read is "big IV, small realized move" and the stock has a history of pinning. In a name that gaps violently, skip it.
The through-line for every one of these: you know your max loss before you enter. That is the non-negotiable. Earnings is a high-variance event; the only way to play it repeatably is to make sure no single print can blow up the account. Defined risk isn't a preference here. It's survival.
A quick map of which structure fits which read
- "IV is overpriced, stock stays in the box" → iron condor. Short vega, short the move, wings for protection.
- "IV is underpriced, big move coming" → debit call or put spread. Long vega but with a short leg cushioning the crush.
- "Big IV, small move, price pins the strike" → calendar spread. Trades the term-structure collapse.
- "I don't want to guess the print at all" → skip it, trade the drift after the crush with plain technicals.
- "I have a hard directional lean and IV is underpriced" → the rare defensible naked long, sized as a lottery ticket.
How the Structures Behave in Different Market Regimes
The same condor is a different trade in a calm market than in a panicking one. Regime is the multiplier on everything above, and ignoring it is how a strategy that "backtested fine" bleeds in the live tape.
Trending market
In a strong, orderly uptrend with the index EMAs stacked and breadth healthy, earnings reactions tend to be bought. Beats get rewarded, in-line results get the benefit of the doubt, and even mild misses get bought back within a session because the macro bid is underneath everything. Post-earnings drift is at its most reliable here — the trend and the fundamental surprise point the same direction, and institutional flow reinforces the tape. In a clean uptrend, favor bullish debit spreads on quality names into the print and lean hard into long-side drift trades the morning after. Condors still work but skew your short strikes — give more room on the upside because the tape wants to melt up.
Choppy, rangebound market
In a directionless chop with the index pinned to a flat EMA stack and no breadth conviction, reactions are messy and mean-reverting. Gaps fill, spikes fade, and yesterday's winner is today's loser. This is the premium-seller's paradise — realized moves consistently come in under implied moves because there's no macro engine to sustain a directional thrust. Symmetric iron condors shine here. Drift trades, by contrast, are weak: without a trend to carry the fundamental surprise, the drift stalls and reverses. In chop, sell the move and be quick to take the condor off for a partial profit rather than holding for the last dime.
High-volatility market
When the VIX is bid, the whole tape is in fear, and correlations go to one, earnings become dangerous in both directions. Expected moves balloon, but so do realized moves — the crush is smaller than usual because IV stays elevated even after the print (the macro fear keeps a floor under vol). This is the regime where condors get run over: the stock blows through your short strike because the whole market is moving 3% a day anyway. In high-vol regimes, widen everything — wider short strikes, smaller size, or simply stand aside. The edge of premium selling erodes precisely when volatility is both high and sticky, because the reliable post-print collapse you're counting on doesn't fully happen. Respect that the strategy that prints money in chop can hand back a quarter's gains in a genuine vol spike.
The meta-rule: premium selling wants calm-to-choppy, low-realized-move regimes; drift trades want clean trends; both want you to stand down when volatility is high and sticky. Read the regime before you read the straddle.
Multi-Timeframe Treatment
Earnings is an event on the daily chart, but it echoes across every timeframe, and reading them in order keeps you from trading a five-minute head-fake as if it were the real move.
Monthly and weekly set the strategic frame. Is the stock in a multi-year uptrend pausing at a level, or rolling over from a distribution top? A beat lands very differently on a name making all-time highs on the weekly than on one bouncing inside a two-year downtrend. The higher timeframe tells you which direction the drift is allowed to run — post-earnings drift that aligns with the weekly trend is far more reliable than drift fighting it.
Daily is where you read the setup into the print and where the gap prints. Is price extended above the EMA 12/22/55 stack into earnings (downside air, priced for perfection) or coiled at support with the stack flattening (squeeze fuel)? The daily also frames the expected-move box — draw the ±expected-move levels as horizontal lines on the daily and you can see instantly whether the box runs into resistance overhead or open space.
Hourly and 15-minute are where the reaction actually resolves. The headline hits, the stock spikes, and then over the next 15 to 45 minutes the guidance digests and the real direction sets. Watching the hourly reclaim or reject the gap, and the 15-minute build a base or break down, is how you trade the reaction cleanly instead of chasing the first candle.
1- to 5-minute is execution only. Once the higher timeframes have told you the direction and the level, you drop to the 1- or 5-minute the morning after to time an entry against a reclaim of a moving average or a break of the opening range. Never let the 1-minute form your thesis — it's for the trigger, not the trend.
The discipline: form the bias top-down (monthly → weekly → daily), confirm the reaction mid-timeframe (hourly → 15m), and execute bottom-up (5m → 1m). A print you read purely off the 1-minute is a print you're gambling on.
Guidance vs. The Number
Here's the part that separates people who watch earnings from people who trade them. The reported number is rarely what moves the stock. The guidance is.
The "number" is backward-looking: revenue and earnings-per-share (EPS) for the quarter that just ended. It's history. The guidance is management's forward outlook — next quarter's revenue, full-year targets, margin expectations. Markets are discounting machines; they price the future, not the past. A company can beat on the number and fall because guidance was soft. It can miss on the number and rip because guidance was raised.
Worked example — the beat that dropped. A software company reports EPS of $0.85 versus $0.78 expected — a clean beat — and revenue in line. The stock is up 3% in the first thirty seconds of the after-hours print. Then the CFO gets on the call and guides next quarter's revenue to a range whose midpoint is below the analyst consensus. The stock reverses and closes the after-hours session down 8%. Everyone who bought the "beat" in the first thirty seconds got run over. The number was history; the guidance was the trade.
This is why you don't chase the initial spike. The knee-jerk move on the headline number is often faded once the conference call reveals the guidance and management tone. The real, tradeable direction frequently establishes itself 15–45 minutes into the call, or by the next morning's open, once the full picture is digested. If you're trading the reaction rather than gambling on the print, you wait for the guidance, not the headline.
The vocabulary of the reaction
A few more forward-looking triggers to watch, because the reaction has its own language:
The whisper number is the unofficial expectation floating among traders that sits above published consensus. A stock can beat the official number, miss the whisper, and drop — because the "real" bar was higher than the printed one. When a name has run hard into earnings, assume the whisper is above consensus and the bar to please is higher than the headline suggests.
The reaction to the reaction is how the stock trades the day after — once the real money has read the full 10-Q and digested the call. This is often more informative than the initial gap, because the overnight move can be dominated by forced covering or thin after-hours liquidity, while the next day reflects considered positioning.
Sympathy moves matter too: when a bellwether reports, its suppliers, customers, and competitors move in sympathy before they've reported anything themselves. A blowout from the sector leader can gap the whole group, setting up either a continuation or a fade when the laggards report into inflated expectations.
And watch management tone on the call, not just the numbers on the slide. A CFO hedging, walking back prior optimism, or getting grilled on a specific metric moves stocks as much as the guidance range itself. The tape reads confidence and evasion.
The Days-After Drift
The move doesn't end when the gap prints. There's a well-documented tendency for stocks to continue drifting in the direction of the earnings surprise for days or even weeks after the report. Academics call it post-earnings-announcement drift (PEAD). Traders just call it the drift, and it's one of the most reliable edges around earnings — precisely because it doesn't require you to guess the print.
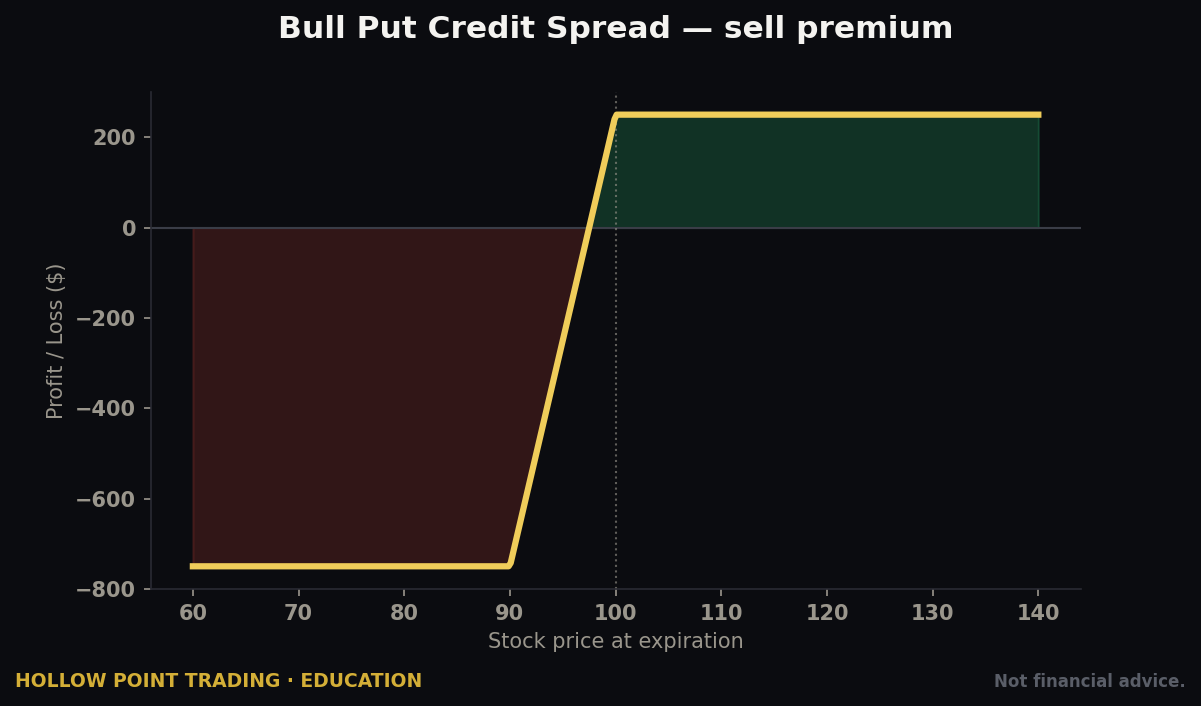
The logic: big institutions can't reprice a position on a single after-hours candle. When a company delivers a genuine fundamental surprise — not just a number beat, but a real change in the trajectory (raised guidance, margin inflection, a new product cycle) — funds accumulate or distribute over days. That sustained flow creates a drift.
How to trade it, the HPT way. You skip the print entirely. You let the crush happen, let the guidance digest, and then trade the confirmed direction with normal technical structure the next day and after. Now you're buying shares or spreads after IV has collapsed — options are cheap again — and you're trading in the direction the fundamental surprise established, with an EMA 12/22/55 trend read and a defined stop. No crush risk, no coin-flip on the number, and you're aligned with institutional flow.
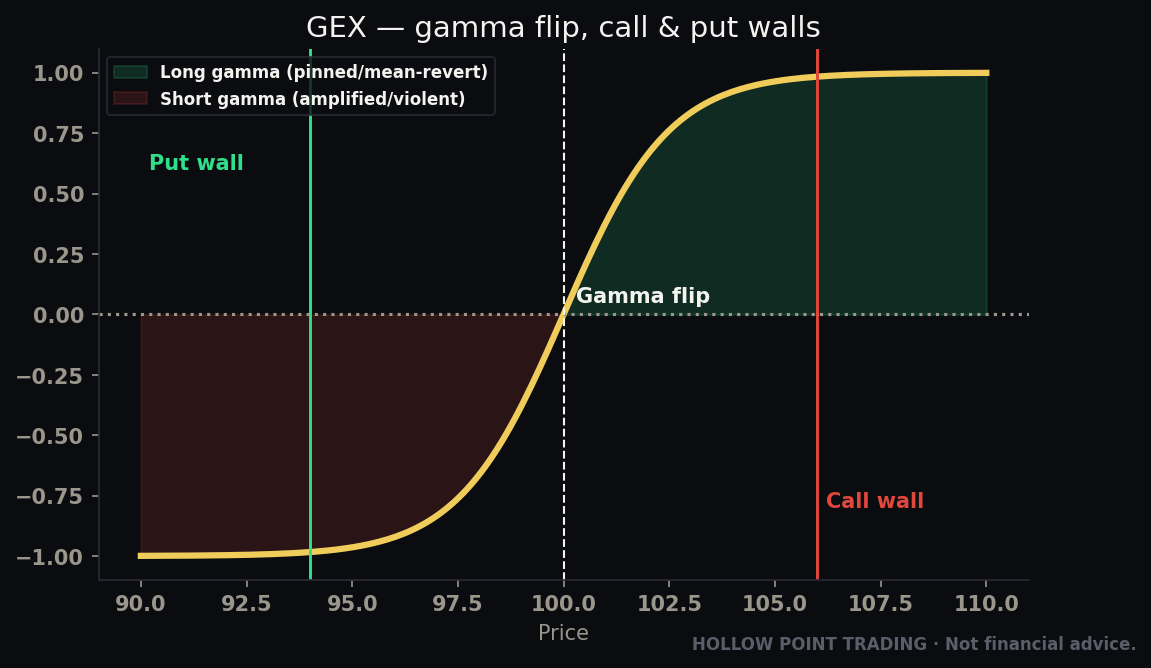
Worked example. A retailer beats and raises full-year guidance. It gaps up 9% and holds the gap. IV has crushed from 90% to 40% — options are cheap again. The next morning it opens, pulls back to reclaim the rising EMA 12/22 on the daily, and holds above the gap. You enter long there with a stop under the gap fill, targeting a measured continuation at 1:3 R/R. Over the following two weeks the drift carries it another 7%. You captured the fundamental move without ever touching the volatility minefield. That's the trade the pros actually want.
What separates a real drift from a dead-cat gap
Not every gap drifts. The drift you want to trade has three fingerprints. One: the gap holds. A stock that gaps up and immediately fills the gap the next morning is not drifting — it's fading, and the surprise wasn't believed. Two: the surprise was fundamental, not cosmetic. A number beat driven by a one-time tax benefit or a buyback shrinking share count doesn't create sustained institutional buying; a raised full-year revenue guide or a margin inflection does. Three: volume confirms. A drift on rising, above-average volume is real accumulation; a drift on thinning volume is a stock coasting on fumes toward a reversal. Check all three before you commit to a drift trade — the strongest version has the gap holding above a rising EMA stack, on volume, off a genuine guidance change.
How Earnings Combines With the Rest of the Kit
Earnings mechanics don't live alone. They stack with the other Hollow Point tools, and the best trades are the ones where three independent reads point the same way.
Confluence with the EMA 12/22/55 framework
The EMA stack is the trend spine of every HPT read, and it does two jobs at earnings. Going into the print it tells you the stock's posture — price riding above a rising, fanned 12/22/55 stack is strong and priced for good news (downside air if it disappoints); price below a rolling stack is weak and vulnerable. Coming out of the print it's your drift-entry trigger: you wait for the morning-after pullback to reclaim the 12/22 and hold the 55 as support, and that reclaim is your entry, with the stop under the 55 or the gap fill. The daily 55-EMA in particular is the bias tell — a stock that gaps up and holds above a rising daily 55 has the trend's blessing for the drift; one that gaps up but stalls under a falling 55 is fighting the tape.
Confluence with fibs and the golden pocket
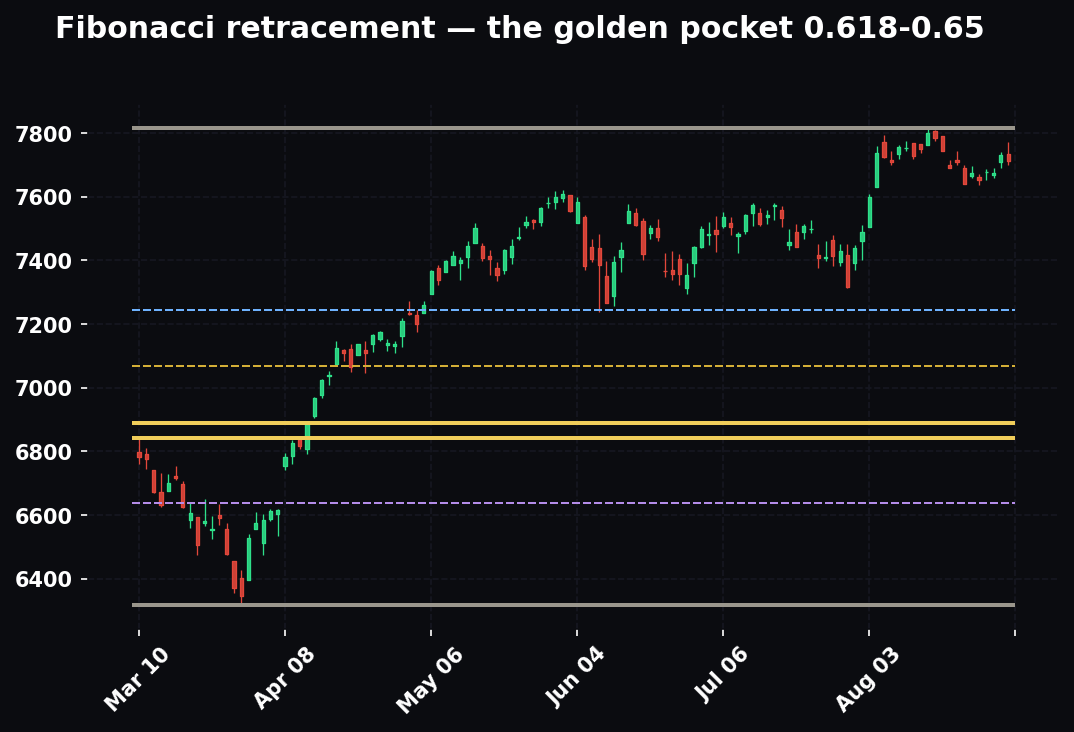
Overlay the expected-move box on the stock's fib structure and you get a far richer picture than either alone. When the upside expected-move boundary lands right at a prior swing high or a fib extension, the market is pricing a move exactly to resistance — a natural spot for a condor's short call and a natural cap on a debit spread's target. When the morning-after drift pullback lands in the golden pocket (the 0.618–0.65 retracement of the post-earnings thrust) and that pocket coincides with the reclaimed EMA stack, you have two independent tools marking the same entry. That's the kind of confluence that turns a decent trade into a high-conviction one.
Confluence with options positioning and GEX
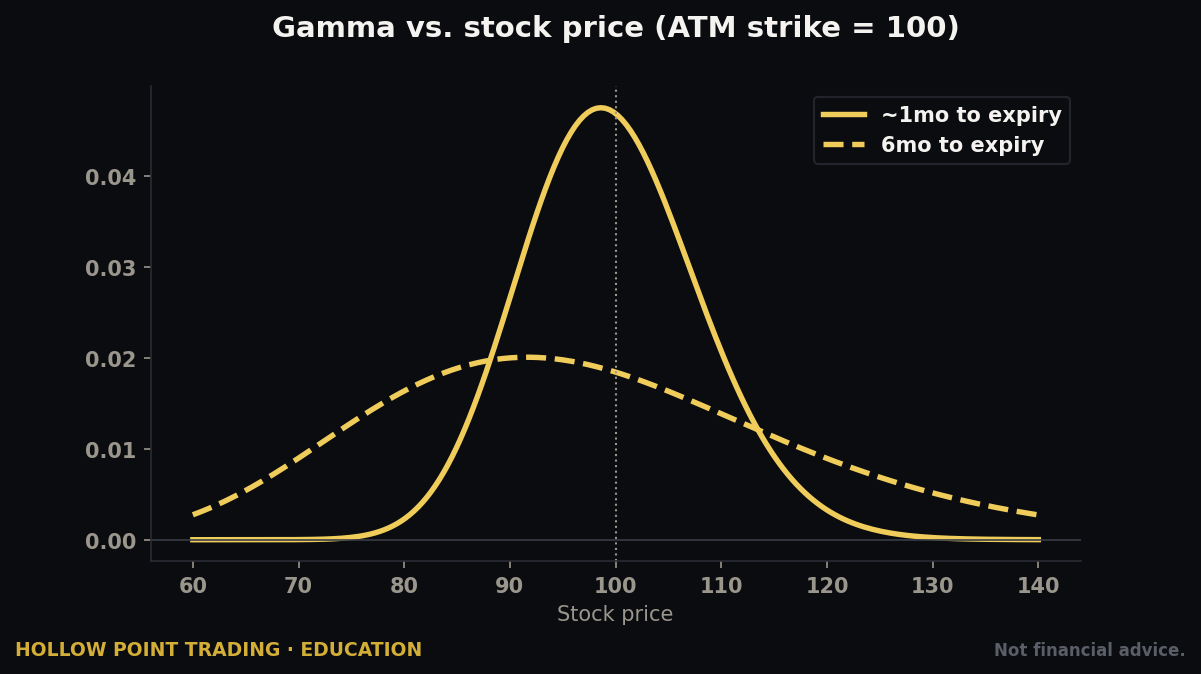
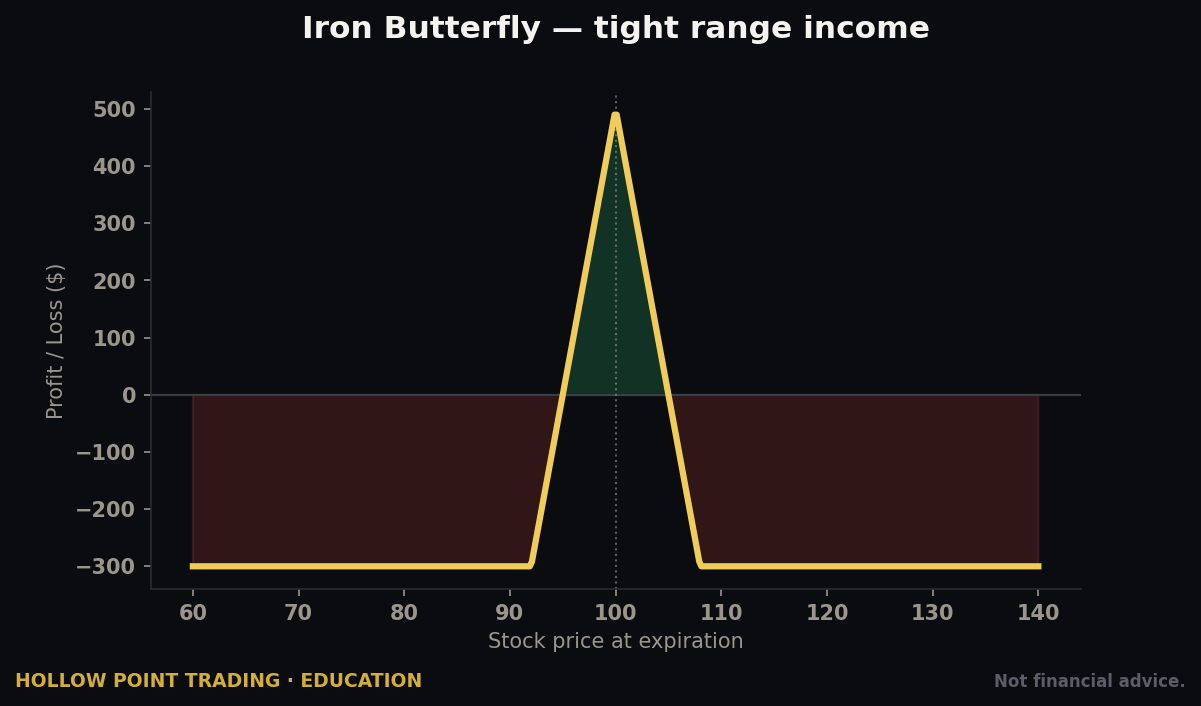
When gamma exposure (GEX) data is available, it tells you where dealers are forced to buy and sell, and it interacts powerfully with the expected move. A heavy call wall sitting just above the upside expected-move boundary is a double ceiling — both the implied move and dealer hedging pin price there, making it an excellent short-call strike for a condor. A gamma flip level below current price marks where dealer hedging turns from stabilizing to amplifying; a stock that breaks the flip on a post-earnings disappointment can accelerate down as dealers sell into weakness. Read the walls against the expected-move box: where they line up, the level is fortified; where the expected move points into open space beyond the walls, the move can run. If GEX data isn't available, say so once and trade the expected move alone — never invent a wall.
How the Pros Use It Differently From Beginners
The same print, the same chart, the same options chain — and a professional and a beginner do almost opposite things with them. Here's the split, laid out honestly.
Beginners buy; pros sell (or wait). The beginner sees a stock they like, buys calls into the print, and hopes for a pop. The pro sees inflated IV and either sells the overpriced premium in a defined structure or steps aside entirely and waits for the clean post-crush trade. The beginner is long vega into a crush; the pro is short vega into a crush or flat.
Beginners think in direction; pros think in probability and expectancy. The beginner asks "will it go up?" The pro asks "what's the implied move, what's the realized move, and where's the mispricing?" The pro is comfortable making a trade with a 2:1 payout against them because the probability is 70% in their favor — a concept the beginner, trained on directional bets, finds counterintuitive.
Beginners chase the headline; pros trade the guidance and the drift. The beginner is clicking buy in the first thirty seconds on the EPS beat. The pro is watching the conference call, reading the guidance and the tone, and often trading the next morning once the real direction is confirmed and options are cheap again.
Beginners size by conviction; pros size by variance. The beginner sizes up on the trades that feel most obvious — which are exactly the most priced-in, most reversal-prone prints. The pro sizes down on every binary event regardless of conviction, because they know a single gap-through can erase a month. Size is a function of the event's variance, not the trader's confidence.
Beginners hold for the home run; pros manage and take profit. The beginner holds the condor for the last nickel and turns a winner into a max loss when the stock drifts back through a strike. The pro takes the condor off at 40–60% of max profit the morning after the crush has done its work, banking the reliable part of the edge and refusing to risk the rest.
Beginners see one trade; pros see a portfolio of prints. The pro isn't trying to win any single earnings play — they're running dozens of defined-risk premium sells across a season, knowing the statistical tailwind pays out in aggregate while any individual print is a coin flip. That's why defined risk and consistent sizing aren't optional: the edge only exists if you survive to place the next fifty trades.
How Earnings Fits the Top-Down Process
Everything above is mechanics. Here's where it becomes a Hollow Point trade rather than a gamble. We run earnings through the same top-down funnel as everything else: macro → sector → stock → timeframe-weighted confluence → defined risk.
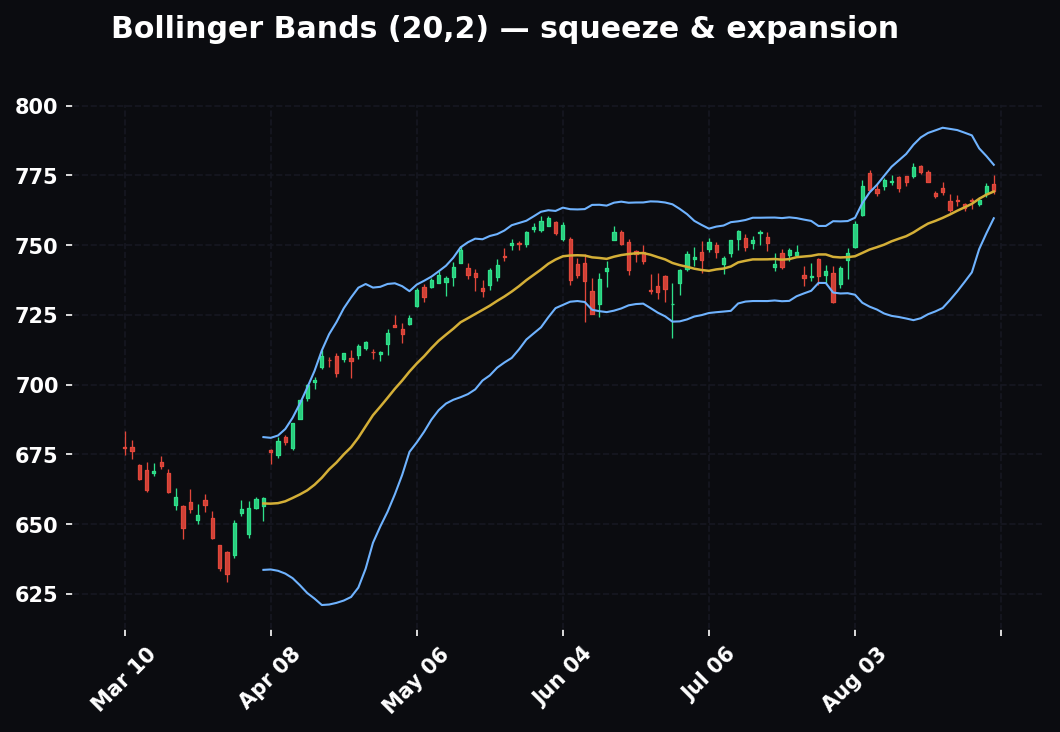
Macro first. What's the tape doing into the print? A great report into a risk-off market where the S&P is bleeding and the VIX is bid will get sold anyway — the macro overrides the micro. A beat lands very differently in a market rallying with EMAs stacked and breadth expanding. The environment sets the multiplier on the reaction. Never trade a print in a vacuum. This is the regime read from earlier, applied to a specific name: is the tape trending, chopping, or in a sticky-vol panic, and does that favor selling premium, trading the drift, or standing aside?
Sector second. How have the comps in the same sector traded on their earnings this cycle? If three semis already reported and all sold off on in-line guidance despite beats, the fourth semi is telling you the sector is priced for perfection and punishing anything short of a blowout. Sector reaction is the single best tell for how your name's guidance will be received. Build a small grid before the print: each comp, its report date, whether it beat or missed, and how the stock reacted. The pattern in that grid is often more predictive than anything on your name's own chart.
Stock third. Where is the stock in its own structure? Is it gapping into resistance after a 40% run, priced for a miracle? Or basing under a level with sentiment washed out, set up to squeeze on any decent number? The technical position going into the print shapes the risk/reward of the reaction. A stock extended above its EMA 12/22/55 stack into earnings has far more downside air than one coiled at support.
Then the volatility read. Pull the expected move. Compare it to how the stock has actually moved on its last several prints — if the implied move is $6 but it's historically moved $3, the market's overpaying for volatility and premium-selling structures are favored. If implied is $4 but it routinely moves $7, the market's underpricing it and defined long-vol structures make sense. This is the edge: comparing what the market's charging for the move to what the stock actually does.
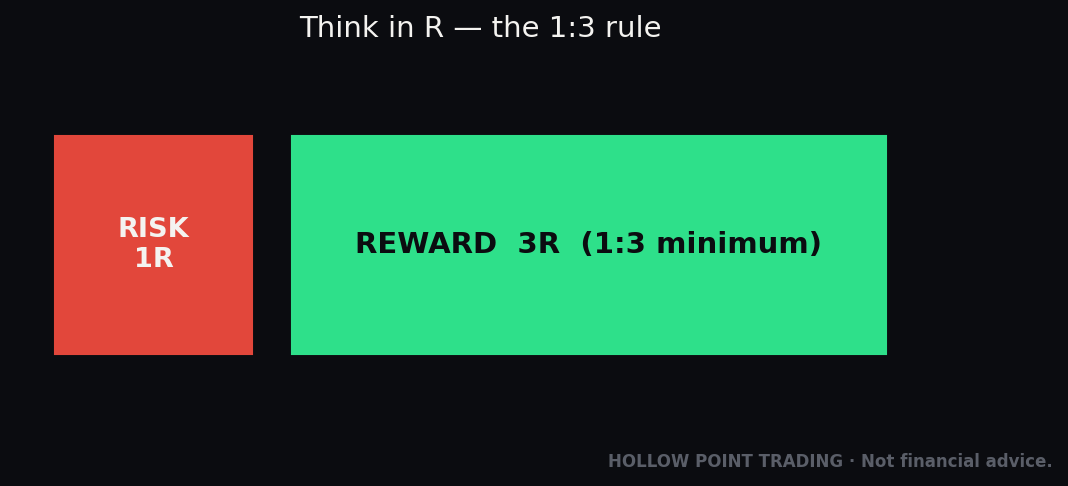
Then structure and size. Choose the vehicle that fits the read — condor if you're selling overpriced vol inside the range, spread if you're buying underpriced vol, or skip the print entirely and trade the drift after the crush. Whatever you pick, it's defined-risk, it's sized so a max loss is survivable, and it's built to a 1:3 reward-to-risk floor on the directional expressions. Discipline over prediction. The market rewards the structure, not the hunch.
A full worked funnel, start to finish
Let's run one name all the way through so the funnel isn't abstract. Call it a networking-hardware company reporting Thursday after the close, trading $80.
Macro: Index is in a healthy uptrend, EMAs stacked, VIX at 14 and quiet. Regime is trend-to-calm — favorable for both drift trades and premium selling, no sticky-vol danger.
Sector: Two comps already reported this cycle. Both beat and both rose on solid guidance — the sector is being rewarded, not punished. That skews the expected reaction bullish.
Stock: The name is coiled just under $82 resistance, sitting on a rising daily EMA 12/22/55 stack, base tightening for three weeks. This is squeeze fuel, not priced-for-perfection extension. Downside air is limited; upside has room to $88.
Volatility read: ATM straddle is $6.40 → expected move ±8%. But its last eight realized moves average 5.2%. The market is overpricing this print relative to the stock's history — premium selling is favored on the vol read alone.
Conflict and resolution: The vol read says sell premium; the technical + sector read says lean bullish. Resolution: an asymmetric structure. Rather than a symmetric condor, sell a put credit spread below the base (collecting overpriced put premium, aligned with the bullish lean) and skip or widen the call side. Or: sell the condor but skew the short strikes to give more upside room. Or cleanest of all: skip the print, and if it gaps up and holds above $82 the next morning on the drift, take the long with a stop under $80 targeting $88 — 1:3 R/R, post-crush, aligned with sector and trend.
Size: Binary event, so half the normal position, known max loss, no naked risk. Done.
That's the funnel doing its job — it didn't just pick a direction, it reconciled a conflict between the vol read and the technical read and produced a defined, survivable structure.
The Common Mistakes
Buying naked options the day of the print. You now know exactly why this loses: peak IV, guaranteed crush, brutal theta. Being right on direction isn't enough. Unless IV is genuinely underpricing the event — the rare exception — this is a donation to the market maker. Stop doing it.
Confusing a right call with a winning trade. The stock went up and you lost — that's not bad luck, that's the expected move and the crush doing exactly what they always do. Internalize that the move has to beat the implied move to pay a long. Judge your earnings trades by whether the structure was right, not whether the direction was right.
Ignoring the expected move entirely. If you're trading earnings without reading the straddle, you're playing a game without checking the odds board. The expected move is free information the market hands you. Use it, and compare it to realized history before you form any opinion.
Chasing the headline spike. The first thirty seconds is the number. The real trade is the guidance, which shows up on the call. Fading the knee-jerk is often the better trade than chasing it. The stock that pops 3% on the beat and then reverses 8% on soft guidance ran over everyone who chased the first candle.
Trading the print in isolation. No macro read, no sector read, no technical position — just a gut call on the number. That's gambling. The top-down funnel is what turns it into a trade. A beat into a risk-off tape still sells; a name whose whole sector just got punished on beats is telling you something.
Undefined risk into a binary event. Selling naked strangles or holding unhedged size into a print where a surprise can gap the stock 20% against you is how accounts die in one night. Everything into earnings is defined-risk or it's not a position, it's a prayer. The wings on a condor cost you credit and buy you a known worst case — always worth it.
Oversizing because it "feels obvious." The most obvious beats are the most priced-in, and priced-in is where reversals live. High-variance events get small size. Always. Size by the event's variance, never by your conviction.
Selling premium in the wrong regime. Condors are a paradise in chop and a minefield in a sticky-vol panic. If the VIX is bid and realized moves are running hot, the reliable post-print crush doesn't fully happen and stocks blow through your short strikes. Match the structure to the regime, not to your habit.
Selling the condor too early. Put the structure on the afternoon of the print, at peak IV, not three days early when the premium is only half-ramped and you're exposed to ordinary drift into your strikes for no extra reward. Timing the ramp is part of the edge.
Holding the winner for the last nickel. A condor that's captured 50% of max profit the morning after the crush has already collected the reliable part of its edge. Holding for the last dime risks the stock drifting back through a strike and turning a winner into a max loss. Take it off, bank it, move to the next print.
Trading a drift that isn't real. A gap that fills the next morning isn't drifting, it's fading. A beat driven by a one-time item isn't a fundamental surprise. Confirm the gap holds, the surprise is fundamental, and volume is rising before you commit to a drift trade — otherwise you're buying a dead-cat bounce.
Forming your thesis on the 1-minute chart. The reaction resolves over 15–45 minutes and confirms by the next open. A thesis built off the first one-minute candle is a thesis built off noise and thin after-hours liquidity. Read the bias top-down; use the low timeframes only for the trigger.
FAQ
Q: If IV crush is so reliable, why not just sell a condor on every print? Because "reliable" isn't "certain," and the losses when a stock blows through your short strike are larger than the individual wins. The edge is statistical and only shows up across many trades with disciplined sizing. Sell condors on the prints where the vol read (implied >> realized), the regime (calm-to-choppy, not sticky-vol), and the technicals all cooperate — not indiscriminately.
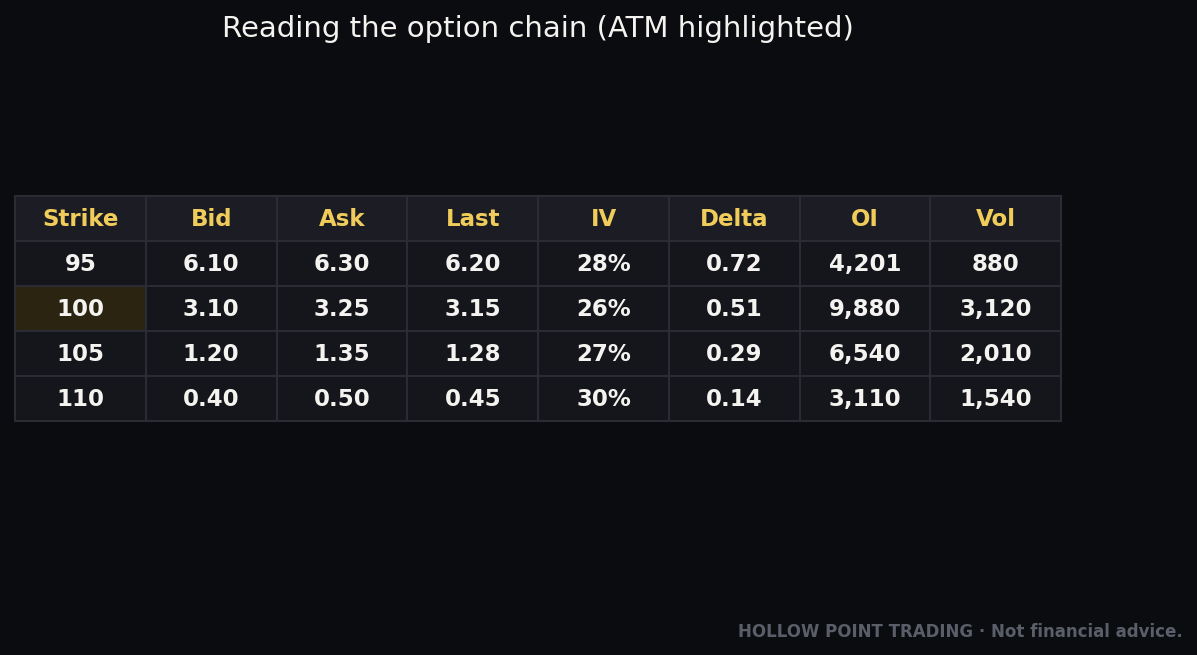
Q: How do I actually find the expected move on my platform? Pull up the options chain for the expiration that captures the print (usually the nearest weekly after the report). Find the strike closest to the current price, add the call's mid price to the put's mid price — that's the ATM straddle and roughly the expected move in dollars. Many platforms also display an "expected move" or "implied move" figure directly; if so, verify it against the straddle so you understand where the number comes from.
Q: Does IV crush affect stock shares, or only options? Only options. Shares have no volatility premium to crush — they just move with price. That's exactly why the post-crush drift trade often uses shares (or cheap post-crush spreads): you get clean directional exposure without paying or losing the vega. If you want the fundamental move and not the volatility bet, shares the morning after sidestep the whole crush problem.
Q: How long does the post-earnings drift last? Anywhere from a few days to several weeks, and it's strongest when the fundamental surprise is genuine and aligned with the higher-timeframe trend. It fades as the surprise gets fully priced in. Trade it with a trailing structure — ride it while price holds above the reclaimed EMA stack, and step off when the trend structure breaks.
Q: What if I have a genuinely strong directional conviction? Express it in a defined-risk directional structure — a debit spread — not a naked option, and ideally after the crush via the drift. If you must be in before the print, the debit spread's short leg cushions the crush while still giving you directional payout. And check the vol read first: if IV is underpricing the move, even a naked long can be defensible, sized as a lottery ticket.
Q: Can I trade earnings on an index or ETF the same way? Indices and broad ETFs don't have single-company earnings, but they have their own event risk (Fed days, CPI prints, jobs reports) that behaves identically — IV ramps into the event and crushes after. The entire framework transfers: read the expected move, respect the crush, sell overpriced event vol or trade the confirmed move after. The mechanics are event-agnostic.
Q: Iron condor vs. iron butterfly for earnings — which? The condor has its short strikes spread apart (outside the expected move) and profits over a wide range with a smaller credit. The butterfly sells the ATM strikes (short strikes together at the money) for a much larger credit but needs the stock to pin near the strike. The butterfly is a tighter, higher-payout, lower-probability bet on a small move; the condor is a wider, lower-payout, higher-probability bet. For most traders the condor's wider margin for error is the safer earnings tool.
Q: How small is "small size" for a binary event? A practical rule: size a defined-risk earnings play so that a full max loss costs no more than a fraction of what you'd risk on a normal swing trade — often a half or a quarter. The whole point of defined risk is that the max loss is known before entry, so set that max loss to a number that, if it happens on the worst print of the season, doesn't dent your ability to keep trading.
Cheat-Sheet: The Earnings Playbook
Read the odds board first
- Pull the ATM straddle in the expiration that captures the print. Call + put = expected move. Multiply by ~0.85 for a tighter estimate.
- Convert to a percentage and box the range on the daily chart: current price ± expected move.
- Check IV rank — confirm front-week IV is elevated (it will be) and note how hard the crush will likely hit. Glance at the term structure for the front-month bump.
Compare implied to realized
- Look at the stock's actual moves on its last 4–8 prints. If implied move > typical realized move → market overpaying → favor selling premium (condors, credit spreads). If implied < typical realized → market underpaying → favor defined long-vol (debit spreads).
Read the regime
- Trending market → reactions get bought; favor bullish spreads and drift trades.
- Choppy market → premium-seller's paradise; symmetric condors, take profit quick.
- High, sticky vol → widen strikes, cut size, or stand aside; the crush underdelivers.
Run the top-down funnel
- Macro: is the tape risk-on or risk-off into the print? VIX, index trend, breadth.
- Sector: how did comps trade on their prints this cycle? That's your guidance tell — build the comp grid.
- Stock: extended into resistance (downside air) or coiled at support (squeeze fuel)? EMA 12/22/55 position.
Pick the structure — always defined risk
- Selling overpriced vol, expect stock stays in range → iron condor (short strikes just outside the expected move, ~1.0–1.2×).
- Buying underpriced vol, expect a big move → debit call/put spread (short leg cushions the crush).
- Big IV, small move, price pins → calendar spread (trades the term-structure collapse).
- Want the fundamental move without the gamble → skip the print, trade the drift after IV crushes.
- Never a naked strangle; never undefined risk into a binary.
Guidance over the number
- The reported quarter is history. Guidance is the trade. Wait for the call.
- Don't chase the first-thirty-seconds spike; the real direction sets 15–45 min into the call and by the next open. Watch tone, whisper number, and sympathy moves.
The morning after — the drift trade
- Confirm the gap holds, the surprise is fundamental, and volume is rising.
- Post-crush, options are cheap again. Trade the confirmed direction with normal technicals: EMA 12/22/55 reclaim, defined stop under the gap or the 55, 1:3 R/R minimum.
- Multi-timeframe: bias from weekly/daily, confirm on hourly/15m, execute on 5m/1m.
Manage and size
- Binary event = small size. Every position has a known max loss before entry. No naked risk into a print. Ever.
- Take condors off at 40–60% of max profit; don't hold for the last nickel.
- Put premium-selling structures on the afternoon of the print, at peak IV.
The whole thing reduces to one reframe: earnings is a volatility trade wearing a directional costume. The market prices the move, charges you peak premium for it, and crushes the volatility the instant the uncertainty resolves. Once you see the machine for what it is, you stop being the person who buys flood insurance the night before the storm — and start being the one who either sells it at peak prices or waits for the cheap, clean, confirmed move the morning after. Right read, right structure, right size, defined risk, matched to the regime and confirmed by the funnel. That's the trade.
Bound by rules, feared by trade.