
Fibonacci is the most-used and most-abused tool in technical analysis. Half the charts on the internet have a fib retracement slapped on them at a random angle, "proving" a level that never mattered. The other half belong to traders who understand that fibs aren't magic — they're a disciplined way of measuring where a pullback is likely to end, and a framework for stacking confluence until the odds tilt in your favor.
This is the definitive HPT reference on it. We're going to build it from the ground up: the number sequence, where every ratio actually comes from, how to anchor a retracement so it's not garbage, every level you'll ever use, extensions for targets, and the golden-pocket setup we run at Hollow Point. By the end you'll draw fibs like a professional and — more importantly — know when to throw them off the chart.
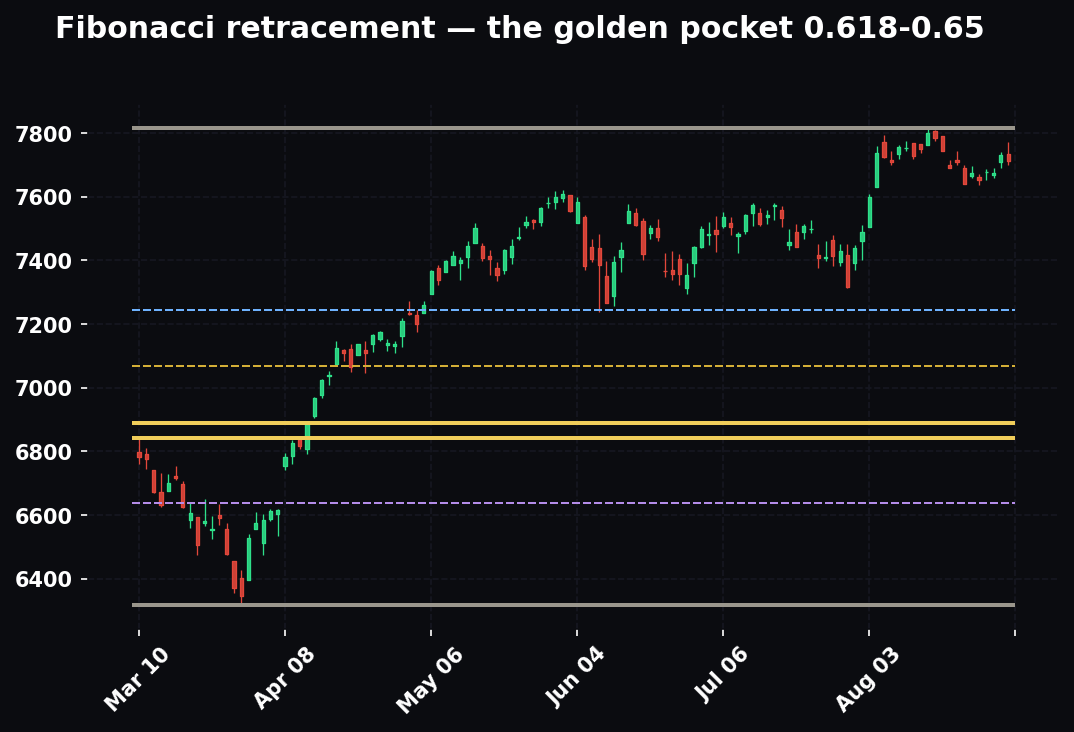
Part 1: Why Fibonacci Works (The Honest Version)
Let's kill the mysticism first, because it gets in the way of using the tool.
You'll hear people say fib levels work because they're "in nature" — in nautilus shells, sunflower seeds, galaxies, the human face. That's true and completely irrelevant to your P&L. A market doesn't retrace to 61.8% because a seashell told it to.
Fibonacci works in markets for three grounded reasons:
It's a shared reference. Millions of traders draw the same levels on the same swings. When enough participants place resting orders, stops, and targets at 61.8%, the level becomes real through sheer participation. It's a self-fulfilling coordination point — a Schelling point. The number matters less than the fact that everyone agrees to look at it.
It quantifies "normal" pullback depth. Markets don't move in straight lines. They impulse, then rest, then continue. Fibonacci gives you a measured, repeatable way to say "a healthy pullback in an uptrend gives back somewhere between a third and two-thirds of the last leg." That range — roughly 38.2% to 65% — is where trends most often resume. Fibs put a ruler on that intuition.
It's a discipline tool. This is the HPT reason. A fib level tells you where your idea is right and, crucially, where it's wrong. Below the swing that anchored the retracement, the read is dead. That built-in invalidation is worth more than any predictive edge.
So: not magic. A shared, quantified, disciplined map of where pullbacks end. That's the whole value proposition, and it's plenty.
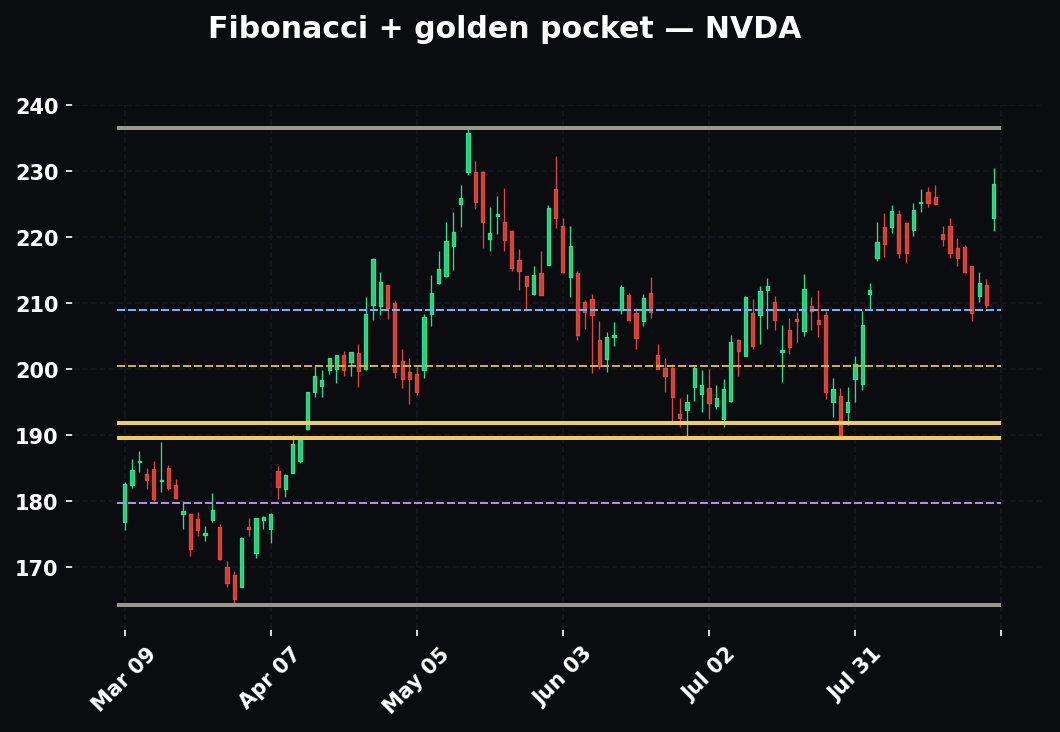
Part 2: The Sequence and the Math
The Fibonacci sequence is built by adding the two previous numbers:
0, 1, 1, 2, 3, 5, 8, 13, 21, 34, 55, 89, 144, 233, 377, 610, 987...
That's it. Each term is the sum of the two before it. Simple. The magic isn't in the numbers themselves — it's in the ratios between them, which is where every trading level comes from.
Where the ratios actually come from
Take any two adjacent numbers deep in the sequence and divide the smaller by the larger:
- 34 ÷ 55 = 0.618
- 55 ÷ 89 = 0.618
- 89 ÷ 144 = 0.618
That constant — 0.618 — is the inverse of the golden ratio (φ, "phi," ≈ 1.618). It's the single most important number in fib trading. Now divide a number by the one two places up:
- 34 ÷ 89 = 0.382
- 55 ÷ 144 = 0.382
That's 0.382. Three places up:
- 21 ÷ 89 = 0.236
- 34 ÷ 144 = 0.236
That's 0.236. Every retracement ratio is just a term of the sequence divided by another term a fixed distance away. Nothing arbitrary about it.
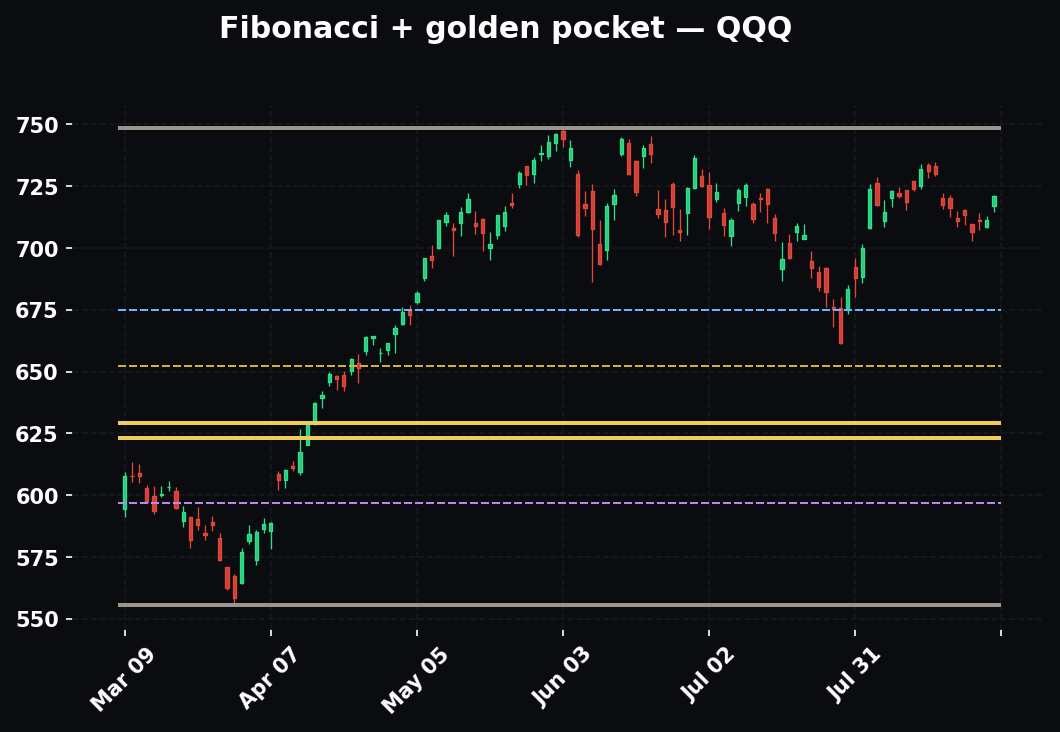
The rest of the levels come from simple operations on 0.618:
- 0.786 = √0.618 (the square root of the golden ratio inverse)
- 0.5 = not a fib number at all — it's the halfway point from Dow Theory, folded in because markets respect the 50% giveback
- 1.618 = φ itself (divide a number by the one below it: 55 ÷ 34 = 1.618)
- 1.272 = √1.618
- 1.414 = √2
- 2.618 = 1.618² (or 1.618 + 1)
- 4.236 = 1.618³
Notice how the whole toolkit is generated from one constant and its roots and powers. When you look at a fib level, you're looking at a specific mathematical relationship to the leg you measured — not a mystery.
Part 3: The Ratios That Matter
Here's the complete working set. Memorize the bolded ones.
| Ratio | Type | What it means |
|---|---|---|
| 0.236 | Retracement | Shallow pullback — strong trend |
| 0.382 | Retracement | First meaningful support in a strong trend |
| 0.5 | Retracement | The psychological halfback |
| 0.618 | Retracement | The golden ratio — bottom of the pocket |
| 0.65 | Retracement | Top of the HPT golden pocket |
| 0.786 | Retracement | Deep retrace — last stand before invalidation |
| 1.0 | Extension | The prior swing high/low |
| 1.272 | Extension | First projection target |
| 1.414 | Extension | Secondary projection |
| 1.618 | Extension | The primary measured-move target |
| 2.0 | Extension | Double the leg |
| 2.618 | Extension | Extended trend target |
| 3.618 / 4.236 | Extension | Parabolic / blow-off targets |
If you only ever used 0.382, 0.5, 0.618–0.65, and 0.786 for entries and 1.272, 1.618, 2.618 for targets, you'd have everything you need for 95% of setups. The rest is refinement.
Part 4: Retracements — What They Actually Are
A Fibonacci retracement measures how much of a completed price move gets given back before the move (potentially) continues. You anchor it to a single, clean directional leg — a "swing" — and the tool prints horizontal levels at each ratio between the start and end of that leg.
The core idea: in an uptrend, price impulses higher, then pulls back. The retracement tells you the likely depths of that pullback. In a downtrend, price impulses lower, then bounces, and the retracement measures the likely height of that bounce.
You are not predicting the future with a retracement. You're marking a decision zone — a place where, if the trend is going to resume, it should resume, and where you'll get a defined entry with a tight, logical stop.
The anatomy of a leg
Every retracement needs two points:
- The anchor low (swing low) — the start of an up-leg
- The anchor high (swing high) — the end of an up-leg
Drag from the low to the high in an uptrend (from the high to the low in a downtrend), and the tool fills in 0.236, 0.382, 0.5, 0.618, 0.65, 0.786, and 1.0. Level 0 sits at the end of the move (the high in an uptrend), level 1.0 at the start (the low). Price retraces down through those levels.
This directionality trips up beginners constantly, so burn it in: you always drag in the direction the impulse traveled. Low-to-high for an up-leg. High-to-low for a down-leg.
Part 5: How to Draw a Retracement Correctly — Anchoring the Swing Leg
This is the whole ballgame. A fib is only as good as the leg you anchor it to. Anchor it to a garbage leg and every level below is noise. Anchor it to the leg — the one the market is actually reacting to — and the levels sing.
Here's the HPT method for anchoring.
Step 1: Identify a clean, complete impulse leg
You want a move that is:
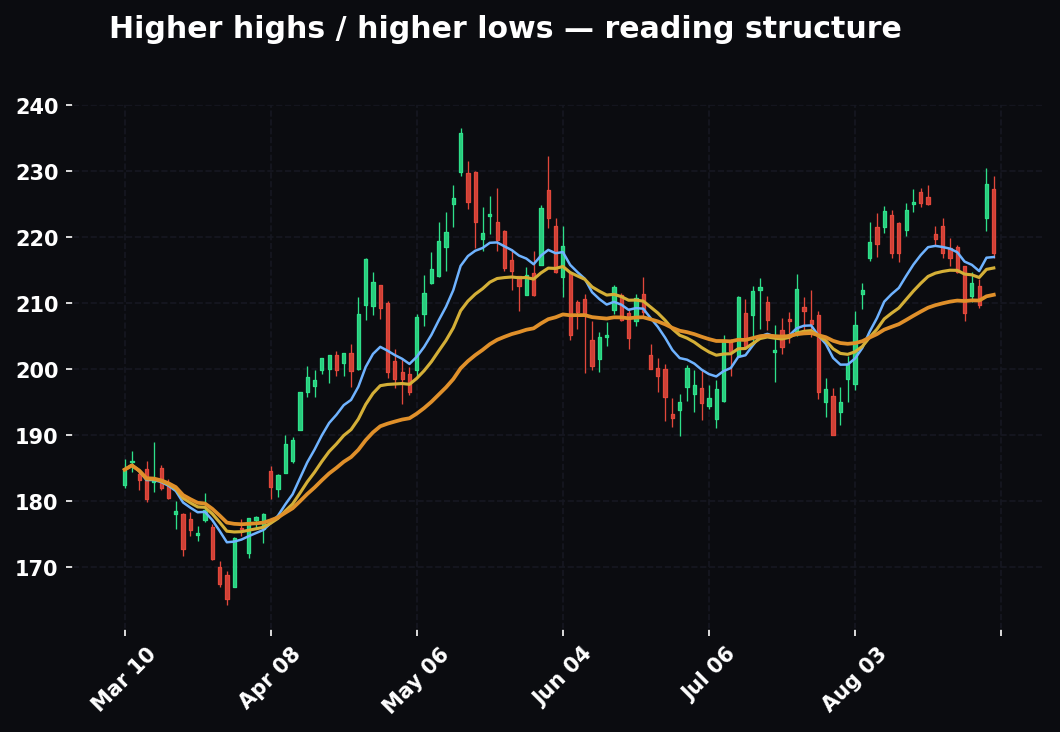
- Directional and decisive — a strong push, not a chop-fest. Big-bodied candles, expansion, obvious intent.
- Complete — it has a clear beginning (a swing pivot) and a clear end (a swing pivot). Don't anchor to a leg that's still in progress.
- Structurally meaningful — it created a new swing high or low, broke a level, or drove the current trend. The market should care about this leg.
The best legs are the ones that changed something — the breakout leg, the leg off a major reversal, the leg that made the high of the day or the week.
Step 2: Anchor to the actual wick extremes (usually)
Anchor low to high using the true extremes of the leg — the wick low to the wick high. That's what the exchange printed; that's where stops actually sit.
The exception: if a single spike wick is a clear anomaly (a one-tick flush on a news blip that instantly reversed), some traders anchor to the candle bodies instead, on the logic that bodies represent where price accepted value. Both are defensible. Pick one convention and stay consistent — flip-flopping between wicks and bodies to make a level "fit" is just curve-fitting your own confirmation bias. HPT default: wicks, unless the wick is a proven anomaly.
Step 3: Match the leg to your timeframe and intent
A 5-minute scalp reads a 5-minute impulse leg. A swing trade reads the daily or weekly leg. Don't anchor a daily fib and then try to scalp the 1-minute off it — the levels will be too far apart to be actionable, and you'll be trading a map at the wrong scale. The leg's timeframe should match the trade's timeframe. More on stacking these in Part 10.
Step 4: Let the market confirm the anchor
Here's the tell that you anchored correctly: price reacts at the levels. If your 0.382 and 0.618 keep producing clean rejections, wicks, and volume — you found the leg the market is using. If price slices through your levels like they aren't there, you anchored to a leg nobody's watching. Re-anchor. The chart is telling you which swing matters; listen to it.
This is the honest counterweight to the biggest fib sin (forcing levels, Part 12). You don't get to decide the leg is right. Price does.
Part 6: Every Retracement Level, One at a Time
Each level has a personality and a use. Here's the full breakdown.
The 0.236 — the shallow-trend tag
0.236 is a tiny giveback. When price only pulls back to 0.236 before resuming, you're in a powerful, one-directional trend — buyers (or sellers) are so eager they won't let it retrace. You rarely enter at 0.236; it's more a read on trend strength. A market holding above 0.236 on pullbacks is telling you it's strong. When a runaway trend finally closes back below 0.236, that's your first hint momentum is cooling.
The 0.382 — first real support
0.382 is the first level where a healthy pullback commonly finds a floor in a strong trend. In momentum names and index futures ripping in one direction, 0.382 is often as deep as it gets. It's a valid entry in strong trends — but the stop is far (below 0.618/0.786), so the reward math only works if you're catching a genuine runner. Treat 0.382 holds as evidence of trend strength; treat 0.382 failures as evidence the pullback wants to go deeper into the pocket.
The 0.5 — the psychological halfback
Not a true Fibonacci ratio, but you never leave it off. Markets respect the 50% giveback because it's the intuitive "half of the move" that every human eye sees. In many setups, 0.5 forms the lower boundary of a healthy pullback and the upper boundary of the golden zone. When 0.5 and 0.618 are close together on a chart, that whole band becomes a high-probability reaction area. A pullback that stalls at 0.5 is constructive; one that blows through it is heading for the pocket.
The 0.618 — the golden ratio
The king. 0.618 is the number — the inverse golden ratio, the level with the deepest history and the heaviest participation. In a valid trend, the 0.618 retrace is the sweet spot: deep enough that you're getting a real discount and a tight stop, shallow enough that the trend is still intact. When people say "buy the dip," a disciplined trader means "buy the 0.618, with a stop below 0.786." This is the anchor of the entire golden-pocket concept.
The 0.65 — the top of the pocket
0.65 isn't a classical fib ratio — it's the HPT (and broadly, the smart-money) upper bound of the golden pocket, the tight 0.618–0.65 zone. The logic: the highest-probability reversals cluster in a narrow band just past 0.618, not scattered all the way to 0.786. Drawing the pocket as 0.618–0.65 keeps your entries tight and your stops honest. Some traders widen the pocket to 0.618–0.786; HPT runs the tighter 0.618–0.65 and treats 0.786 as the last-chance / invalidation shelf.
The 0.786 — the deep retrace and last stand
0.786 (√0.618) is the deepest retrace that still — barely — keeps a trend-continuation read alive. Price this deep has given back nearly four-fifths of the leg. A hold and reversal off 0.786 can produce an excellent R/R entry because your stop (just below the origin) is so close. But be honest with yourself: a market that needs the 0.786 to hold is a weak trend. Treat 0.786 as the invalidation line for the pocket setup — hold and go, or lose it and the leg is dead.
Below 0.786 sits 1.0 — the origin of the leg. Close below 1.0 and the retracement has become a full reversal. The move that anchored your fib no longer exists as support. The read is over.
Part 7: The Golden Pocket in Depth
The golden pocket is the 0.618–0.65 zone (HPT convention), and it deserves its own section because it's where most of the tradeable edge lives.
Why this zone specifically? Three reasons converge:
Participation. 0.618 carries the most eyeballs and the most resting orders of any single retracement level. The pocket concentrates that participation into a tight band.
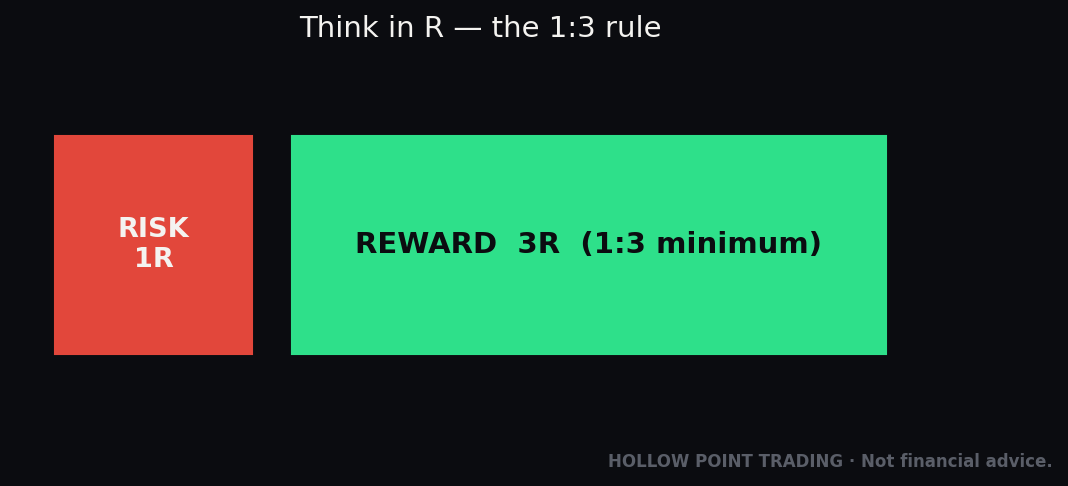
Optimal R/R geometry. Enter in the pocket (~0.62–0.65), stop below 0.786 (or below the leg origin for a wider stop), target the prior high and extensions beyond. That structure naturally produces 1:3 or better reward-to-risk — the HPT non-negotiable. The pocket is close enough to the invalidation that your stop is tight, and far enough from the target that your reward is large. The math works here in a way it doesn't at 0.382.
Institutional footprint. Larger players accumulate on deep, "uncomfortable" pullbacks — precisely the moves that shake out weak retail hands. The golden pocket often coincides with where a big buyer wants to fill without chasing. You'll frequently see a volume spike and a long wick tag the pocket and reverse. That's a footprint, not a coincidence.
The pocket is not a buy-blindly zone. It's a place to look for a trigger. Price entering the pocket is the alert; the entry comes when the pocket produces evidence — a reversal candle, a volume spike, a reclaim of a micro-level, a divergence. We'll build the full setup in Part 11.
Part 8: Extensions and Projections — Where the Move Goes
Retracements tell you where a pullback ends. Extensions tell you where the next leg is likely to end — your targets. Without extensions, you have entries and no exits, which is half a trading plan.
Terminology matters here, because platforms use these words loosely:
- Fibonacci Extension — projects targets beyond the prior swing, measured from the original leg. Uses ratios above 1.0 (1.272, 1.618, 2.618...).
- Fibonacci Projection / Trend-Based Fib Extension — a three-point tool. You mark the impulse leg (point 1 → point 2), then the retracement low (point 3), and it projects the next leg's targets from point 3. This is the more precise targeting tool because it accounts for where the pullback actually ended.
- Fibonacci Expansion — similar family, projects beyond point 2 using the leg length.
For practical purposes: use the trend-based (three-point) tool for targets. Anchor point 1 = swing low, point 2 = swing high, point 3 = the pullback low (ideally your golden-pocket entry). The tool then prints:
The 1.272 extension — first target
1.272 (√1.618) is the first logical target past the prior high. In many measured moves, the new leg travels 1.272× the original before its first meaningful pause. This is where you take partial profit and de-risk. If you entered in the golden pocket, price reaching the prior high (1.0) already puts you comfortably green; 1.272 is where you bank the first tranche.
The 1.414 extension — the in-between
1.414 (√2) is a secondary, less-watched target that sometimes catches a stall between 1.272 and 1.618. Useful as a partial-exit shelf when 1.272 and 1.618 are far apart. Optional; don't clutter the chart with it unless price is respecting it.
The 1.618 extension — the primary target
The measured move. 1.618 is φ itself and the single most important extension target. An enormous share of impulse legs travel almost exactly 1.618× before exhausting. This is your primary profit objective — where a golden-pocket entry realizes its full 1:3+ potential. If you take one target, take 1.618.
The 2.618 extension — the extended-trend target
2.618 (1.618²) is the target for strong, trending, momentum-driven conditions — when the move has real fuel behind it (a macro catalyst, a squeeze, index-wide participation). Don't set 2.618 as your base case; set it as the runner target for the portion of your position you let ride after banking 1.272 and 1.618. In parabolic conditions, 3.618 and 4.236 come into play — blow-off territory, where you're managing an exit, not planning an entry.
Worked extension example
A stock breaks out from $100 (swing low) to $150 (swing high) — a $50 leg. It pulls back into the golden pocket at ~$119 (0.618) and holds. You enter at $119, stop at $110 (below 0.786). Now project targets using the trend-based tool from the $119 low:
- 1.0 (prior high): $150
- 1.272: 119 + (50 × 1.272) = ~$182...
Wait — extensions off the retracement low project the new leg length as a multiple of the original leg. From the $119 pullback low, a 1.272 extension of the $50 leg targets 119 + 63.6 = $182.60; 1.618 targets 119 + 80.9 = $199.90; 2.618 targets 119 + 130.9 = $249.90. Your risk was $119 − $110 = $9. Your reward to 1.618 is ~$81. That's better than 1:8 on the runner — which is exactly why the pocket entry matters. Even scaling out, the blended R/R clears 1:3 with room to spare.
Part 9: Retracement vs Extension vs Projection — Don't Confuse Them
Quick disambiguation, because mixing these up produces nonsense levels:
- Retracement (2-point): measures pullback depth within a leg. Levels between 0 and 1. Entries live here.
- Extension (2-point): projects beyond the leg using the same two anchors. Levels above 1. Rough targets.
- Trend-based projection (3-point): projects the next leg from the pullback low. Levels above 1, more precise. Best targeting tool.
Rule of thumb: retracements for entries, trend-based projections for targets. Keep them on separate mental layers so you don't stare at a 0.618 retracement and a 1.618 extension and confuse which move each is measuring.
Part 10: Multi-Timeframe Fibs — The Confluence Engine
A single fib on a single timeframe is a decent tool. Fibs stacked across timeframes is a system. This is where the HPT macro → sector → stock philosophy meets the fib toolkit.
The principle: draw retracements on multiple timeframes and look for levels that overlap. When the daily 0.618, the 4-hour 0.5, and the 1-hour 0.618 all land within a few ticks of each other, you don't have a level — you have a wall. Multiple independent swings, all pointing at the same price. That's a confluence zone, and confluence zones are where high-probability reversals happen.
How to run multi-timeframe fibs
- Start high, work down (macro → micro). Draw the higher-timeframe fib first — weekly or daily — to establish the dominant pullback zone. That's your bias. This is the macro read: where is the big money's discount zone?
- Refine on the trade timeframe. Drop to the timeframe you'll actually execute on (say, 1-hour or 15-minute) and draw the fib on the relevant sub-leg. Look for where the lower-timeframe pocket nests inside the higher-timeframe pocket.
- Trigger on the entry timeframe. Drop once more (5-minute, 1-minute) to time the actual entry — the reversal candle, the reclaim, the volume spike inside the stacked zone.
The magic is alignment. A 15-minute golden pocket that sits inside a daily golden pocket, at a spot the weekly is also pointing to, is a far better trade than any one of those levels alone. The timeframes are voting, and they agree.
Timeframe-weighted confluence
Not all timeframes carry equal weight. The HPT convention: higher timeframes dominate. A daily 0.618 outranks a 5-minute 0.618. When a low-timeframe fib disagrees with a high-timeframe fib, trust the higher one for bias and use the lower one only for timing. Weight the vote by timeframe — the weekly and daily set the thesis; the intraday fibs fine-tune the entry.
Part 11: Confluence — Fibs Never Trade Alone
Here's the rule that separates traders who make money with fibs from traders who lose with them: a fib level is only a signal when something else agrees with it. By itself, a 0.618 is a line on a chart. Stacked with three other pieces of evidence at the same price, it's a trade. This is the beating heart of the HPT approach — confluence over conviction, discipline over prediction.
Here's everything that stacks with fibs, and how.
Confluence #1 — Market structure
The single best fib confluence. Does your golden pocket line up with:
- A prior swing high or low (old resistance becoming support)?
- A breakout level being retested from above?
- A higher-low forming in an uptrend (HL structure intact)?
- A supply/demand zone or order block?
When the pocket sits on a structural level, you have two independent reasons for price to react there. Structure + fib is the foundation; everything else is a bonus.
Confluence #2 — The EMAs (12/22/55)
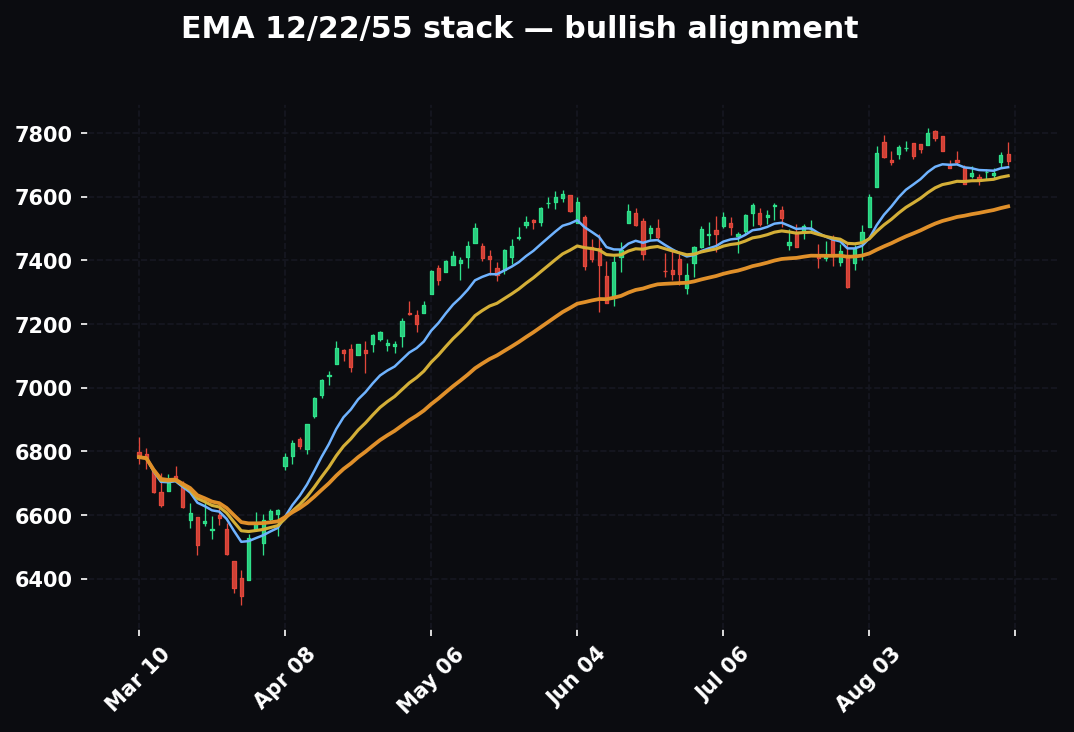
At HPT we read trend off the 12/22/55 EMA stack, not the standard 9/21. When a fib level lines up with a key EMA, the confluence is powerful:
- Golden pocket + 55 EMA — the premium setup. The 55 is the trend tell (on the daily especially). When the 0.618–0.65 pocket coincides with a rising 55 EMA, you have a fib level and the trend's dynamic support at the same price. That's a "back up the truck" confluence in a valid trend.
- Golden pocket + 22 EMA — a faster, momentum-driven version. Common in strong trends where pullbacks are shallow and the 22 catches them.
- 12 EMA reclaim inside the pocket — a clean trigger. Price tags the pocket, then reclaims the 12 EMA on the entry timeframe → momentum is flipping back to trend direction.
The EMA stack also confirms you're trading with the trend. If price is in a golden pocket but below a bearish 12/22/55 stack, you're trying to catch a falling knife — the fib is pointing one way and the trend the other. Skip it. The pocket only earns a long when the higher-timeframe stack still supports up.
Confluence #3 — Volume Profile
Overlay the volume profile (or anchored volume profile) and check what sits at your fib level:
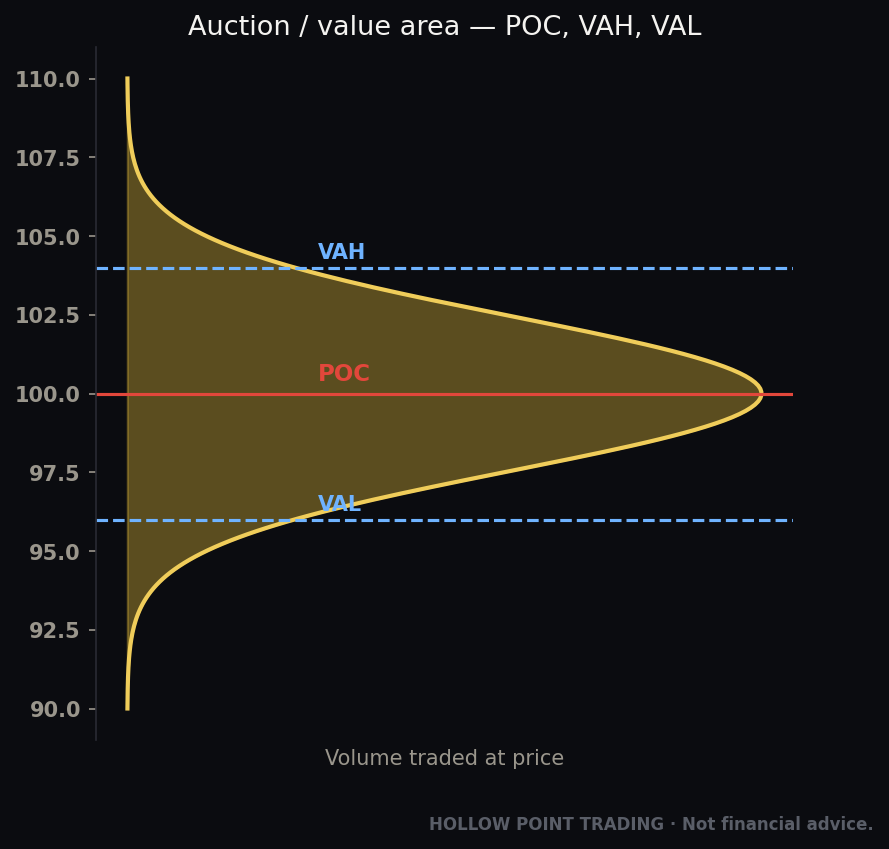
- Point of Control (POC) at the pocket — the price where the most volume traded is now acting as a magnet/support. Fib + POC is heavy confluence.
- Value Area Low (VAL) at the pocket — price returning to the bottom of value and holding is a classic continuation.
- A high-volume node (HVN) at the level — lots of prior acceptance = support.
- A low-volume node (LVN) below the pocket — a "gap" in volume that price would slice through fast if the pocket fails. That tells you where your stop should sit and how fast you'll get hit if you're wrong.
Confluence #4 — VWAP and anchored VWAP
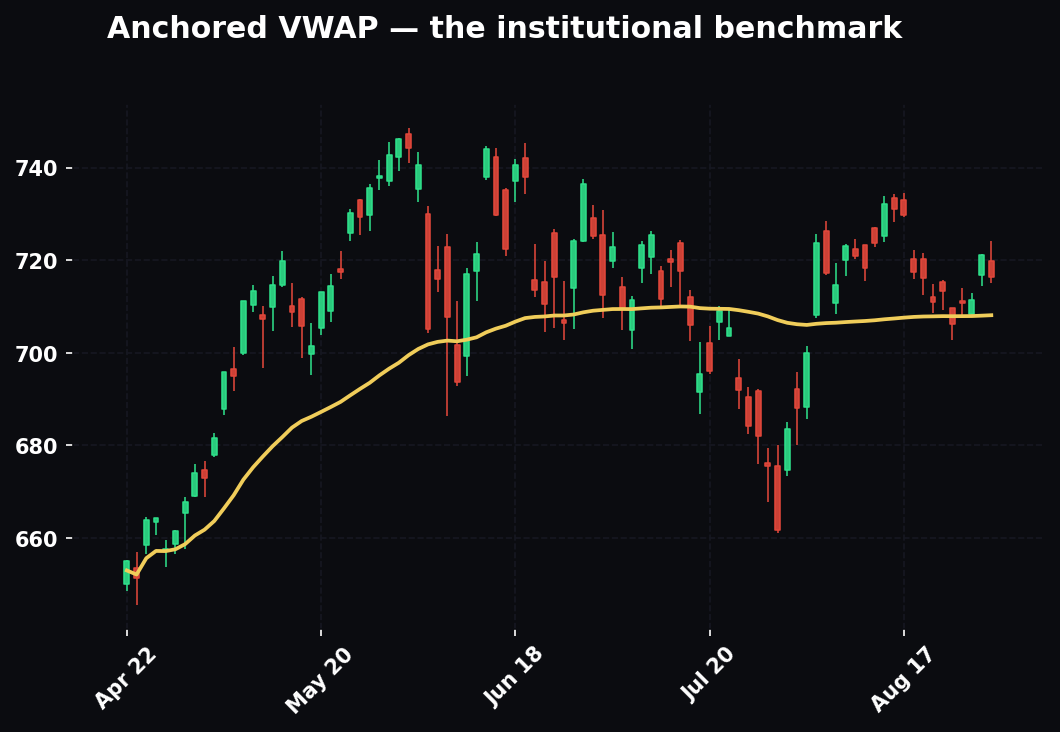
VWAP (and VWAP anchored to a meaningful event — an earnings gap, a swing low, a session open) acts as institutional fair value. When the golden pocket lines up with VWAP or an anchored VWAP, big-money passive flow is likely defending the same price you are. Especially potent intraday.
Confluence #5 — Round numbers
Markets respect big round numbers — $100, $500, ES 5000, NQ 20000 — because that's where human psychology, options strikes, and resting orders cluster. When a fib level sits at or just past a round number, the confluence is real. Note the nuance: stops often sit just beyond the round number, so price frequently pierces it by a hair (a stop-run) before reversing. A pocket at $99.50 that spikes to $98.80 and reclaims is textbook.
Confluence #6 — Other fibs (clusters)
Covered in Part 10 — when multiple fibs from different legs/timeframes overlap, that is confluence. A fib cluster (several ratios from several swings landing in a tight band) is one of the highest-probability zones on any chart.
Confluence #7 — Momentum and divergence
Check RSI and MACD as price enters the pocket:
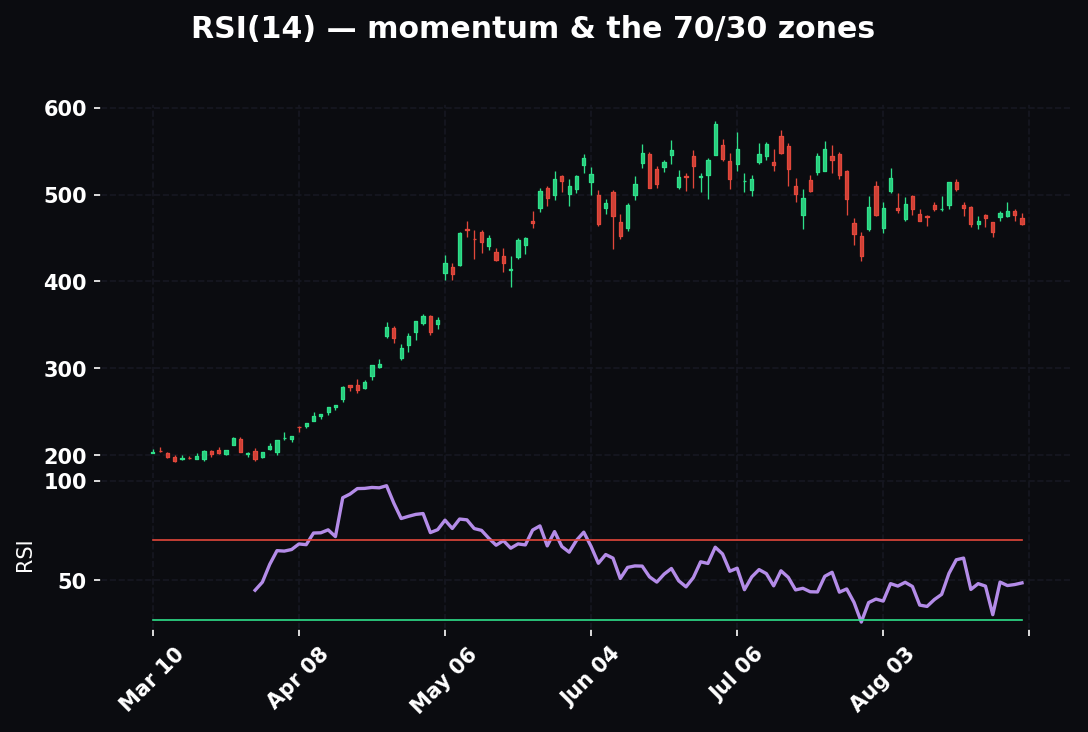
- Bullish RSI divergence into a golden pocket (price makes a lower low, RSI makes a higher low) → selling pressure is exhausting exactly where the fib says it should. Strong trigger.
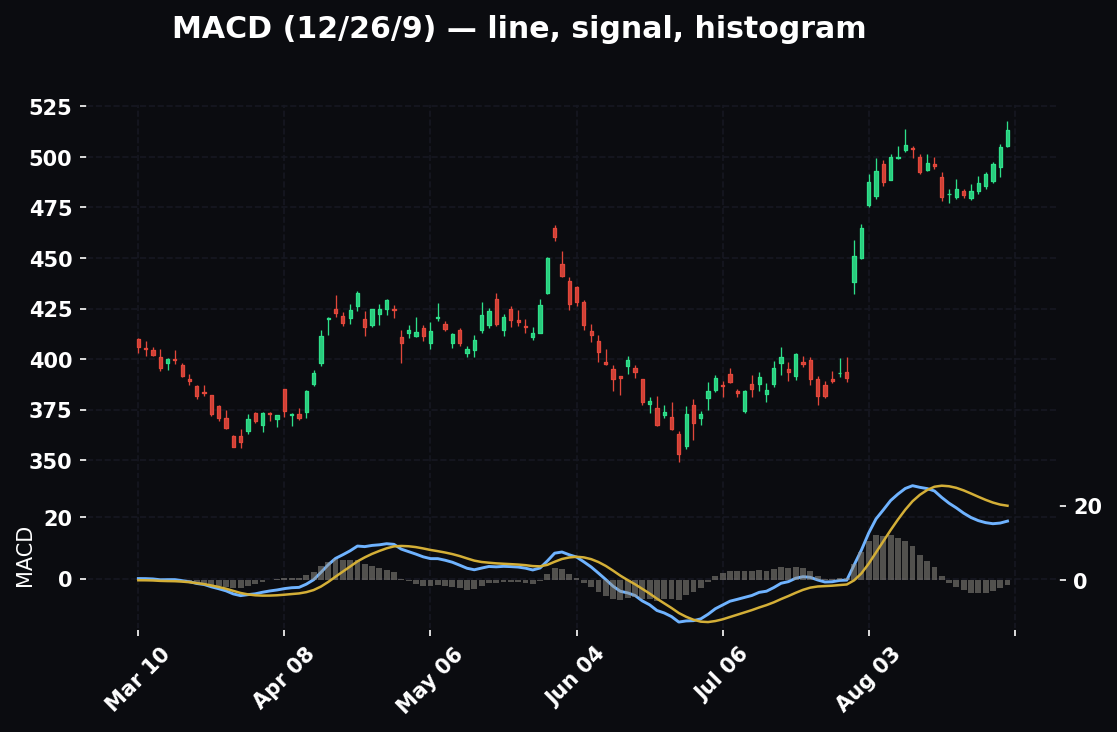
- MACD histogram contracting / about to cross in the pocket → downside momentum fading at support.
- RSI holding above the 40–50 zone on the pullback → trend momentum intact.
Momentum won't anchor a trade, but it's excellent confirmation that the pocket is doing its job.
The confluence-counting discipline
Here's how to use all of the above without fooling yourself: count the confluences, and let the count set your conviction and size. A bare 0.618 with nothing else = pass. A 0.618 + prior structure + 55 EMA + POC + round number + RSI divergence = a high-conviction, full-size trade. The more independent tools point at the same price, the better the odds. But — and this is the honest part — the confluences must be real. Which brings us to the mistakes.
Part 12: The HPT Golden-Pocket Setup
Let's assemble everything into the actual playbook we run.
The setup, start to finish
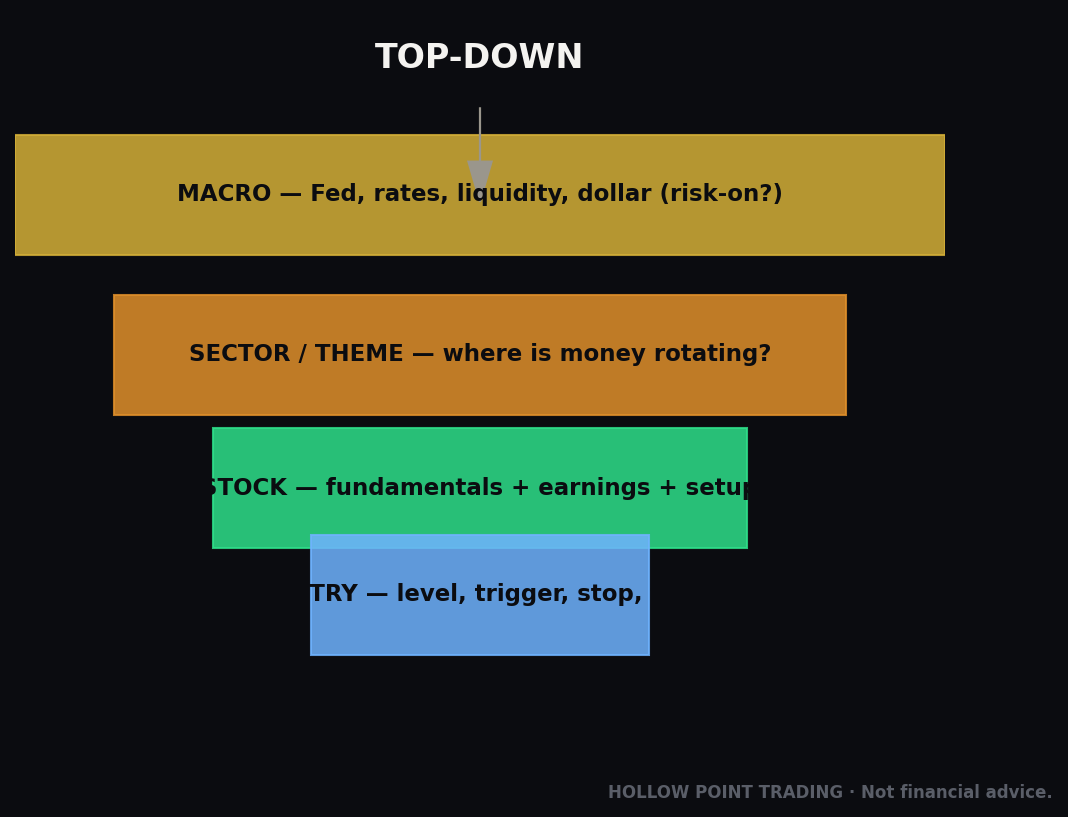
1. Establish the macro trend (top-down). Higher-timeframe bias first. Is the daily 12/22/55 stack bullish? Is the sector supporting the name? Is the broad tape (ES/NQ, VIX, DXY, yields) confirming risk-on? You only take golden-pocket longs in an uptrend and shorts in a downtrend. Fibs are a trend-continuation tool, not a reversal tool. Trying to buy a golden pocket against a dominant downtrend is how accounts die.
2. Find the leg. Identify the clean impulse leg that drove the current trend. Anchor the retracement — wicks, low to high (up-leg) — on the relevant timeframe.
3. Wait for price to enter the 0.618–0.65 pocket. This is the alert, not the entry. Do nothing yet. Discipline over prediction — you don't buy because price is near the pocket; you buy when the pocket proves itself.
4. Stack confluence. Is structure there? The 55 EMA? POC/VAL? A round number? Another timeframe's pocket? VWAP? Count them. Two or more independent confluences = tradeable. Fewer = pass.
5. Wait for the trigger inside the pocket.
- A reversal candle (bullish engulfing, hammer, pin bar) on the entry timeframe, or
- A volume spike on a rejection wick tagging the pocket, or
- A reclaim of a micro-level or the 12 EMA, or
- A momentum divergence confirming.
6. Enter. Fill in the pocket (0.62–0.65) on the trigger.
7. Set the stop. Below 0.786 (tight version) or below the leg origin / 1.0 (conservative version). The stop must sit where the read is invalidated — below the level, the trend-continuation thesis is dead and you're out, no negotiation.
8. Set targets with the trend-based extension. Anchor the 3-point tool (low → high → pocket low). Scale out:
- First partial at 1.272 — de-risk, move stop to breakeven.
- Core at 1.618 — the measured move, primary target.
- Runner at 2.618 — let it ride in strong trends only.
9. Confirm the math clears 1:3. If the entry-to-stop distance versus entry-to-1.618 doesn't give you at least 1:3 reward-to-risk, the trade isn't valid no matter how pretty the setup. No exceptions. This is the rule that makes the whole thing profitable even at a sub-50% hit rate.
Why this setup makes money
Two reasons, both structural, neither predictive:
- The pocket gives you a tight stop and a big target → the geometry produces 1:3+ almost by construction. You can be wrong more than half the time and still print, because your winners are 3× your losers.
- The confluence filter throws out the marginal setups → you only take the trades where multiple independent tools agree, which raises the hit rate on the ones you do take.
Tight risk + asymmetric reward + selective entries. That's the entire edge. The fib is just the ruler that measures it.
Part 13: Common Mistakes — How Fibs Go Wrong
Every fib failure traces back to one of these. Learn them cold; they'll save you more money than any level ever makes you.
Mistake #1 — The wrong anchor
The number-one error. You anchor to a random, meaningless, or incomplete leg, and every level below is fiction. Symptoms: price ignores your levels, slices through the "pocket," reacts nowhere.
Fix: anchor only to clean, complete, structurally significant legs — the breakout leg, the reversal leg, the leg that made the high. And let price confirm: if the levels don't produce reactions, you anchored wrong. Re-draw. The market votes on your anchor whether you like it or not.
Mistake #2 — Forcing levels (curve-fitting)
The most seductive error. You drag the fib around — wick to body, this swing to that swing — until a level "lines up" with where price already reversed. Congratulations, you've proven nothing except that a tool with seven levels will always have one near any given price. This is confirmation bias with extra steps.
Fix: decide your anchoring convention before you look at where you want the level to be. Anchor to the objective swing, wicks, done. If it doesn't line up, it doesn't line up — that's information, not a problem to be dragged away.
Mistake #3 — Too many fibs on the chart
Five retracements, three extensions, and a projection all at once — now the entire chart is "a fib level." When everything is support, nothing is. You've created the illusion of confluence out of your own clutter.
Fix: one or two meaningful fibs per timeframe. If you're stacking multi-timeframe, keep each clean and look for genuine overlap — don't paper the chart.
Mistake #4 — Trading fibs against the trend
Buying a golden pocket in a downtrend because "it's at support." Fibs are continuation tools. In a strong downtrend, price will tag your 0.618 bounce level and keep going — you're catching a knife and calling it confluence.
Fix: trade fibs with the higher-timeframe trend (12/22/55 stack). Retracement longs in uptrends, retracement shorts in downtrends. The dominant trend is the first confluence; without it, don't take the trade.
Mistake #5 — Treating a level as a line, not a zone
Price rarely reverses to the tick. Traders who set a limit order exactly at 0.618 get skipped by a spike to 0.63 and watch the trade run without them — or get filled and stopped by normal noise.
Fix: treat the pocket as a zone (0.618–0.65) and require a trigger inside it. You're trading a reaction, not a price.
Mistake #6 — No invalidation / no stop
Using fibs to find entries but not exits. "It's the golden pocket, it has to hold." No, it doesn't. Every fib read has a price where it's wrong — below 0.786, or below the leg origin.
Fix: the stop is part of the setup, not an afterthought. Define invalidation before you enter. If it breaks, you're out. Discipline over prediction.
Mistake #7 — Ignoring the fib as invalidation on the other side
Flip of #6: when a golden pocket fails and price closes below the leg origin, that's not just a stop-out — it's a signal. The trend that anchored your fib is likely reversing. Some of the best short setups are failed long pockets (and vice versa).
Fix: when a pocket fails cleanly, don't just lick your wounds — flip your read and look for the setup in the new direction.
Mistake #8 — Fib in isolation
Trading a bare level with zero confluence because "it's the 61.8%." The level alone has a mediocre hit rate. All the edge is in the stack.
Fix: never trade a fib alone. Structure, EMA, volume, round number, momentum — count the confluences or pass.
Part 14: When Fibs Fail — The Honest Failure Cases
Even perfectly drawn, well-confluenced fibs fail. Here's when, so you're not surprised.
Strong trends blow through everything. In a violent, one-directional move — a short squeeze, a gap-and-go, a news-driven melt-up — price may retrace only to 0.236 or not at all. Waiting for a golden pocket that never comes means missing the move. Read trend strength first: if pullbacks keep holding above 0.382, the market's telling you it won't give you the deep discount.
Regime changes ignore prior structure. When the macro regime flips — a Fed pivot, a recession print, a war headline — the old swing legs become irrelevant overnight. The fib you drew on last month's rally means nothing once the entire context resets. Fibs are technical; catalysts are fundamental, and fundamentals win. This is why HPT weaves the news and the tape into every read — the chart doesn't exist in a vacuum.
Low-liquidity / choppy markets produce noise. In a thin, ranging, low-volume market, price wanders through fib levels randomly. No participation, no self-fulfilling reaction. Fibs need a real trend and real volume to work.
Over-watched levels get front-run. When everyone sees the same obvious golden pocket, price sometimes stops just short (front-running) or spikes just past (stop-running) before reversing. This isn't the fib failing — it's the fib being too popular. Give the level room; trade the zone and the trigger, not the exact line.
The through-line: fibs are a probability tool, not a certainty tool. They tilt odds; they don't guarantee outcomes. That's precisely why the 1:3 R/R and the stop exist — so the failures cost you one unit and the successes pay you three-plus. You survive the failures by design.
Part 15: A Full Worked Example
Let's run one clean trade end to end, HPT-style.
Macro read: Broad tape risk-on. Sector leading. Daily 12/22/55 stack bullish and rising. Green light for continuation longs.
The leg: The name broke out and ran from a swing low of $200 to a swing high of $260 — a clean $60 impulse leg, big bodies, expanding volume. Anchor the retracement, wicks, $200 → $260.
Fib levels print:
- 0.382 → $260 − 22.9 = $237.10
- 0.5 → $230.00
- 0.618 → $260 − 37.1 = $222.90
- 0.65 → $221.00
- 0.786 → $260 − 47.2 = $212.80
Golden pocket = $222.90 – $221.00.
Confluence check as price pulls back:
- The pocket sits right on a prior breakout level at $221 (old resistance) → structure ✓
- The rising daily 55 EMA is at $221.50 → EMA ✓
- Volume profile POC from the base sits at $222 → volume ✓
- $220 round number just below → round number ✓
- Four independent confluences. High conviction.
Trigger: Price wicks down to $220.40 (a hair below the round number — a stop-run), tags the pocket and the 55 EMA, prints a bullish engulfing on the 15-minute with a volume spike, and reclaims the 12 EMA. That's the trigger.
Entry: $222.50, inside the pocket, on the engulfing close.
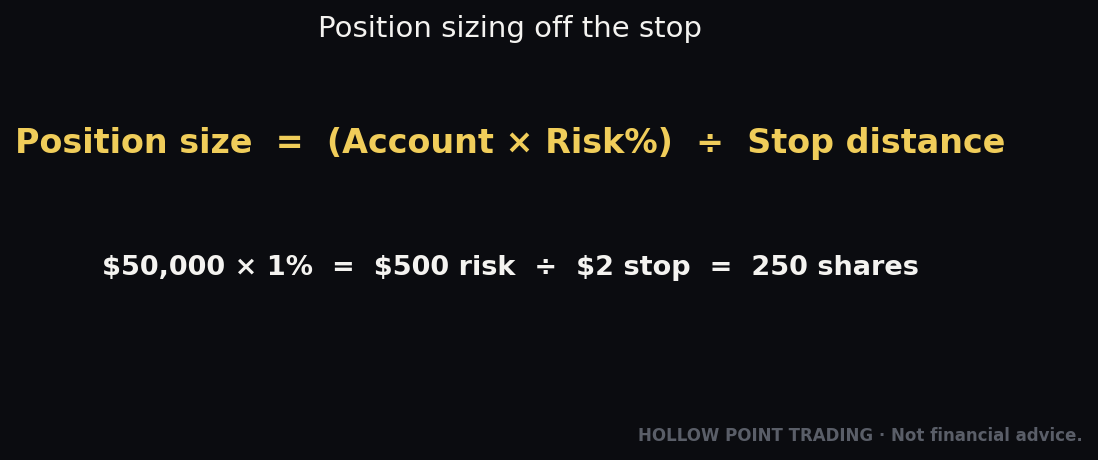
Stop: below 0.786 and below the round number → $212.00. Risk = $10.50.
Targets (trend-based extension, $200 → $260 → $222.50 pocket low):
- 1.0 (prior high): $260 — first resistance, tighten stops
- 1.272: 222.50 + (60 × 0.272 above the high)... project the new leg → ~$298
- 1.618: → ~$319
- 2.618: → ~$379
The math: Risk $10.50. Reward to 1.618 (~$319) = ~$96.50. That's ~1:9 on the core, blended well past 1:3 even after scaling the first tranche at 1.272.
Management: Bank a third at 1.272 (~$298), move stop to breakeven. Bank the core at 1.618 (~$319). Let the runner ride toward 2.618 with a trailing stop under the rising 22 EMA. If instead price had closed back below $212 at any point — read invalidated, one-unit loss, move on, no story-telling.
That's the whole system in one trade: top-down bias, clean anchor, confluence-gated entry, defined invalidation, asymmetric targets, disciplined management.
Part 16: The Complete Fibonacci Cheat-Sheet
Bookmark this section.
Retracement levels (entries)
| Level | Read | Use |
|---|---|---|
| 0.236 | Very shallow — strong trend | Trend-strength gauge, rarely an entry |
| 0.382 | First support in strong trends | Entry in confirmed momentum trends |
| 0.5 | Psychological halfback (Dow) | Upper bound of healthy pullback |
| 0.618 | Golden ratio — pocket bottom | Primary entry zone |
| 0.65 | Pocket top (HPT) | Golden pocket = 0.618–0.65 |
| 0.786 | Deep — last stand | Aggressive entry; invalidation shelf |
| 1.0 | Leg origin | Below = full reversal, read dead |
Extension levels (targets)
| Level | Use |
|---|---|
| 1.272 | First target — take partial, de-risk |
| 1.414 | Optional secondary shelf |
| 1.618 | Primary measured-move target |
| 2.618 | Extended-trend runner target |
| 3.618 / 4.236 | Parabolic / blow-off — manage exit |
How to draw (retracement)
- Find a clean, complete, meaningful impulse leg.
- Anchor low → high (up-leg) or high → low (down-leg).
- Use wick extremes (bodies only for proven anomalies — pick one convention, stay consistent).
- Match the leg's timeframe to the trade's timeframe.
- Let price confirm the anchor — reactions = right leg; slices = re-anchor.
How to draw (targets)
Use the trend-based / 3-point extension: point 1 = swing low, point 2 = swing high, point 3 = pullback (pocket) low. Read 1.272 / 1.618 / 2.618.
The HPT golden-pocket checklist
- [ ] Higher-timeframe trend supports the direction (12/22/55 stack)
- [ ] Clean anchor on a meaningful leg
- [ ] Price is inside the 0.618–0.65 pocket
- [ ] Two or more real confluences (structure / 55 EMA / POC / round number / VWAP / MTF fib / divergence)
- [ ] A trigger fired inside the pocket (reversal candle / volume spike / reclaim / divergence)
- [ ] Stop below 0.786 or leg origin — invalidation is defined
- [ ] Math clears 1:3 to the 1.618 target
- [ ] If any box is unchecked → pass
The confluence stack (what to look for at your level)
- Prior swing high/low, breakout retest, HL structure, supply/demand zone
- 12 / 22 / 55 EMA (55 = the trend tell; pocket + 55 = premium)
- Volume Profile POC / VAL, high-volume node
- VWAP / anchored VWAP
- Major round number (expect stop-run pierces)
- Overlapping fibs from other legs/timeframes (clusters)
- RSI/MACD divergence and momentum
The seven deadly fib sins
- Wrong anchor (meaningless leg)
- Forcing/curve-fitting levels to fit price
- Too many fibs — clutter as fake confluence
- Trading fibs against the trend
- Treating a level as a line, not a zone
- No stop / no defined invalidation
- Trading a fib in isolation
When fibs fail
- Violent one-way trends (retrace only to 0.236 or not at all)
- Macro regime changes (old legs go irrelevant)
- Thin, choppy, low-volume markets (random wander)
- Over-watched levels (front-run / stop-run — trade the zone)
Closing: The Ruler, Not the Crystal Ball
Fibonacci doesn't predict the future. It measures the present — where a pullback is likely deep enough to resume, where the next leg is likely to exhaust, and precisely where your idea is wrong. That last part is the point. The golden pocket isn't a magic buy button; it's a disciplined zone where confluence stacks, stops sit tight, and the 1:3 math works in your favor whether any single trade wins or loses.
Draw clean legs. Anchor honestly. Never trade a level alone. Stack the confluence — structure, the 12/22/55, volume, round numbers, momentum, and the tape and macro above it all. Define invalidation before you enter. Let the math, not the hope, decide whether the trade exists.
That's how you use the most-abused tool in trading like a professional instead of a tourist. Not by believing in the number — by respecting the rules around it.
Bound by rules, feared by trade.