
A wireless network needs money for more than towers and software. It also needs the right to use spectrum, and an acquisition can consume cash even when the acquired business adds future opportunities. Verizon’s reporting offers a practical weekend lesson: a company can generate substantial free cash flow while its broader investing and financing commitments demand a separate funding analysis.
Hollow Point Trading’s October 3, 2026, 4:00 p.m. Central edition is being prepared after its scheduled slot. It is Saturday and U.S. equity markets are closed. The fresh daily chart records the completed October 2 session. The company evidence below is historical June-quarter reporting, with the next scheduled earnings discussion on October 26. No third-quarter result is assumed.
Macro — Connectivity has several kinds of capital needs
Recurring customer payments make a telecommunications business look different from a company that sells an occasional large machine. The network behind those payments still requires investment. Maintenance, expansion, spectrum rights and the purchase of an existing operation can reach different lines of the cash-flow statement. Their accounting location does not remove their economic cost.
Interest rates matter through the price of financing and through the return investors require from a stock. A dividend does not make an equity interchangeable with a bond: the share price can fall, business obligations can change and shareholder distributions depend on company decisions. This edition does not claim a fresh interest-rate move caused Friday’s price action. It uses financing as a framework for asking whether cash generation and cash commitments fit together.
The useful macro question is therefore concrete. Which investments support the existing service, which expand it, and how are the combined demands funded? A reassuring operating-cash number is one part of that answer. Debt proceeds, repayments and cash balances complete the picture. The balance between them can change even when subscriber activity remains resilient.
Fundamental — Start with the definition, then read the exclusions
Verizon’s June 30 Form 10-Q defines free cash flow as operating cash less capital expenditures, including capitalized software. It explicitly says this measure does not capture finance-lease payments, business acquisitions or wireless-license cash payments. The first-half reconciliation is $18.419 billion of operating cash minus $8.210 billion of capital expenditures, producing $10.209 billion of free cash flow.
Those exclusions are the analytical center of this article. The label describes a useful measure of liquidity; it does not mean every remaining dollar is available without further obligations. Read the reconciliation and the complete statement together. Otherwise a reader can give a number a broader meaning than the company’s own definition supports.
The spectrum payment sits beyond the June cutoff
The same filing reports $9.480 billion of first-half business-acquisition cash, net of acquired cash, and $1.155 billion of wireless-license acquisitions. It also discloses approximately $3.1 billion of additional spectrum payments in July following Auction 113. The July payment belongs after the June reporting cutoff; it should not be inserted into the first-half statement as though it happened earlier.
This creates two separate reading tasks. One is to understand exclusions within a reported period. The other is to place a subsequently disclosed payment in the correct period. Combining the two carelessly can double-count a cost or misstate when cash moved. A spectrum investment can have a strategic rationale and still use cash that a narrow free-cash-flow subtraction leaves outside its boundary.
For a fictional teaching example, suppose a network produces 20 units of operating cash and spends 8 on the capital-expenditure line. Its defined free cash flow is 12. If it also pays 3 for licenses, that payment does not change the arithmetic of the definition; it changes the broader funding picture. These invented units are not Verizon estimates. They demonstrate why a definition and a complete cash budget answer different questions.
A further acquisition or a debt repayment would need its own treatment. Simply subtracting every financing payment from the headline metric is also incomplete if the business simultaneously raises debt. The purpose is to reconcile the cash statement, including sources and uses, without relabeling a personally constructed subtotal as the issuer’s reported measure.
Growth in cash needs a quality check
The filing attributes the first-half operating-cash increase primarily to cash-tax timing under legislation and working-capital benefits tied to lower upgrades, partly offset by lower earnings. That explanation gives readers a reason to examine the durability of the increase. A timing benefit can improve a period’s cash without proving that the same increment will repeat indefinitely.
The July 24 earnings release reports first-half free-cash-flow growth of 16% and raises its full-year growth outlook to 9–10%. The outlook is guidance, not an achieved full-year result. Verizon’s investor calendar lists its third-quarter earnings discussion for October 26 at 8:30 a.m. Eastern, or 7:30 a.m. Central. That future disclosure is the catalyst for testing the bridge with another period of actual evidence.
A constructive fundamental scenario would show continuing cash generation alongside a clear account of spectrum, acquisition and financing demands. A weaker scenario would show that favorable timing is fading while other requirements remain substantial. Neither scenario can be settled by annualizing the June total alone. Compare the period, definition, timing explanation and complete statement before deciding what the cash means.
Technical — Friday’s narrow range follows a steep retreat
The fresh TradingView chart shows NYSE-listed VZ using the Cboe One feed, internally BATS:VZ, on the daily timeframe. October 2 opened at $46.05, reached $46.39, fell to $45.79 and closed at $45.92, down 0.13%. The established 55-day EMA reads $47.72. RSI(14), the only lower panel, is 34.48. These are historical observations with the market closed.
The focused September–October frame contrasts a previous area above $51 with recent candles near $46. Price remains beneath the declining average. A small range at the bottom of that visible retreat suggests a pause worth monitoring; it does not establish that sellers have finished. The average is a changing trend reference, while Friday’s high and low are fixed boundaries of that completed session.
Bull scenario: acceptance above $46.39 followed by a held retest would improve the immediate range. A broader repair would require evidence around the updated 55-day EMA, currently $47.72, and the visible $48 area. Failure back below the reclaimed range boundary would invalidate that specific recovery premise. A stronger daily bar would still need follow-through.
Base scenario: movement between $45.79 and $46.39 would leave the range unresolved. Several small candles can form a base or merely interrupt a decline. Watch whether subsequent closes hold a boundary rather than treating the small candle’s appearance as a buy instruction.
Bear scenario: losing $45.79 and failing to reclaim it would weaken stabilization anchored to Friday’s low. A durable reclaim would weaken that breakdown interpretation. The captured frame does not justify inventing a precise lower support. RSI below 50 describes weak momentum and does not provide a countdown to a bottom.
Risk — A funding explanation does not forecast the next candle
Reopening gaps can cross a proposed trigger and invalidation before an order executes. A daily image does not reveal an options spread, implied volatility or time decay. Spectrum spending, tax timing and price behavior have different evidence clocks; this chart cannot establish that a particular cash-flow item caused the visible decline.
This is educational research, not a personalized investment recommendation. No HPT holding, executed trade, prescribed size or realized return is asserted. The next official results may change both the cash analysis and the relevant market levels. Treat all scenarios as conditions to evaluate, with capital at risk.
The cash-flow definition identifies what a number subtracts. The cash-flow statement identifies what the company still has to fund.
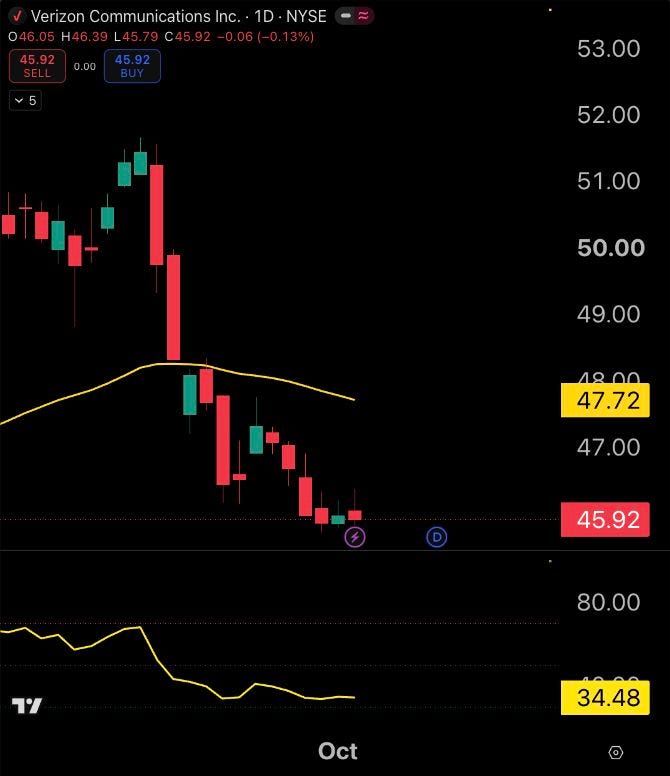
Source: TradingView, NYSE-listed VZ / Cboe One (BATS:VZ), daily (1D); captured October 3, 2026 at 4:05 p.m. CT. Latest completed bar: October 2. U.S. equity market closed. Established EMA(55) $47.72; RSI(14) 34.48, sole lower panel. Feed-specific historical snapshot; no live weekend equity price, causal proof or guaranteed outcome.
Sources and next evidence
Verizon Form 10-Q, period ended June 30, 2026 — cash-flow statement, liquidity discussion and spectrum disclosure
Verizon July 24, 2026 earnings release — reported cash flow and full-year guidance
Verizon investor calendar — October 26, 2026 earnings discussion, checked October 3
Discussion: Which cash-statement line would you examine first to decide whether Verizon’s reported free cash flow can support its broader funding commitments, and what next-quarter evidence would change that assessment?