
Hollow Point Trading — October 3, 2026, 8:00 a.m. CT weekend edition. U.S. equity markets are closed on Saturday. The chart is a fresh capture of the completed week ending October 2, not a live weekend quote.
A revenue table can tell two stories at once. One line shows what a business earns from its services; another shows what remains after contractual adjustments. Reading the first and ignoring the second can make growth look stronger than the amount that actually reaches the reported revenue line. Visa’s client-incentive bridge makes that distinction unusually visible.
Macro — Follow the payment, then follow the contract
Consumer spending creates activity for payment networks, but activity is only the start of the economic chain. The network must also attract and retain participating institutions and commercial relationships. A macro thesis about spending therefore needs a second question: what portion of the economics is retained after the terms of those relationships?
This matters when interpreting a resilient-consumer headline. More purchases can support more network activity, while contractual incentives can also grow. An investor who treats all service-category revenue as the final top line skips a part of the business model. The operating environment and the commercial terms have to be examined together.
That is a research framework, not a claim about what consumers did this week. We are not estimating real-time spending from a Saturday stock chart. Nor are we attributing the latest weekly pullback to a single accounting line. The purpose of this edition is to connect a documented revenue bridge with a separately observed technical condition.
Fundamental — Read the subtraction in Visa’s own table
Visa’s July 28 fiscal Q3 release reports service revenue of $4.922 billion, data-processing revenue of $6.042 billion, international-transaction revenue of $3.853 billion and other revenue of $1.496 billion. Their sum is $16.313 billion. The table then subtracts $4.680 billion of client incentives, producing $11.633 billion of net revenue.
The release reports net revenue growth of 14% year over year and client-incentive growth of 18%. Those are reported fiscal-quarter results, not a forecast for the current quarter. The subtraction is visible in the revenue section; it is not an additional operating-expense deduction to apply again.
The quarter ended June 30. This July disclosure is the historical fundamental evidence checked anew for October 3. It does not report the fiscal period ending September 30, and this article makes no claim that those later results have been released.
The worksheet — A larger starting line can hide a slower finish
Imagine a fictional network with 100 units of service-category revenue and 20 units of incentives. Its net revenue is 80. In the next period, category revenue rises to 110, while incentives rise to 25. Net revenue is now 85. The starting total grew 10%, but the final revenue line grew only 6.25%. This is an invented arithmetic example, not Visa’s growth calculation.
Now place operating expenses below that 85-unit line. Subtracting the same 25-unit incentive amount once more would double count it. The practical habit is to draw the statement as a waterfall and identify where each item has already entered the calculation. A familiar label such as “expense” should not replace the actual presentation in the company’s statement.
For later reporting, compare the category totals, incentive amount and net revenue together. If incentives rise faster, ask about the terms, timing and underlying relationships before declaring a permanent deterioration. If net revenue improves, ask which inputs contributed. One period’s relative growth rates do not reveal contract-level economics or guarantee a trend.
This framework also changes how an investor reads margins. Start with the company’s reported revenue definition, then use the relevant expenses below it. Do not construct an alternative profit measure by moving a subtraction twice. Precision about the bridge is more useful than a broad claim that payment volume must flow directly into profit.
Technical — The weekly pullback is approaching a visible checkpoint
The publisher-owned TradingView chart uses weekly candles, showing the decline into spring 2026, the subsequent recovery and the retreat from the marked 385.57 swing-high reference. The completed week ending October 2 reads open 366.70, high 370.50, low 356.75 and close 360.66. Those historical values are shown by the NYSE/Cboe One feed with the market closed.
The established weekly 55 EMA reads 341.79. RSI, the sole lower panel, reads 55.41. Price remains above the average while momentum has cooled from the summer rise. That combination supports a pullback-within-recovery interpretation more than an already-proven collapse through the entire recovery structure. It still needs price confirmation.
The nearest marked retracement is 356.32, just beneath the captured week’s 356.75 low. Below it, the chart shows the selected-swing midpoint at 347.28, the 55 EMA at 341.79 and another retracement at 338.25. These references have different meanings: a last-week low, a selected-range fraction and a moving average are not interchangeable support guarantees.
Next-session scenarios — Define the condition before the outcome
Constructive hold: if the next equity session holds the 356.32–356.75 area and price begins to recover, 366.70 is a nearby checkpoint and 370.50 is the completed week’s high. A sustained move through 370.50 would provide stronger evidence that the immediate weekly pullback is repairing. The marked 385.57 high remains a later reference, not an automatic destination.
Deeper pullback: sustained trade beneath 356.32, followed by a failed reclaim, would weaken the near-term hold thesis. The next chart references are 347.28 and then the 341.79 EMA area. Reaching one does not establish demand by itself; the reaction and subsequent acceptance matter. A brief intraday violation and a completed weekly loss should also be kept distinct.
Broader failure: a weekly close below the EMA, accompanied by unsuccessful recovery attempts, would challenge the above-average recovery interpretation. The 338.25 retracement would then be another observed checkpoint. These are conditional scenarios, and the original bullish hold case is invalidated by a sustained failure below its specified area rather than rescued by moving the threshold lower.
Risk — An accounting bridge is not an entry signal
A correct understanding of net revenue does not determine next-session order flow. News, gaps and wider market moves can take price across a chart reference without an orderly opportunity to act. Options introduce additional risks through time decay, implied volatility and liquidity. This article describes education and research, not an HPT position, executed trade or personalized recommendation.
The next fundamental checkpoint is the company’s subsequent official financial disclosure; no unverified release date or later-period result is supplied here. Keep that evidence clock separate from the chart clock. A technical reclaim can occur before a new statement, and a better statement can coexist with a weak price response.
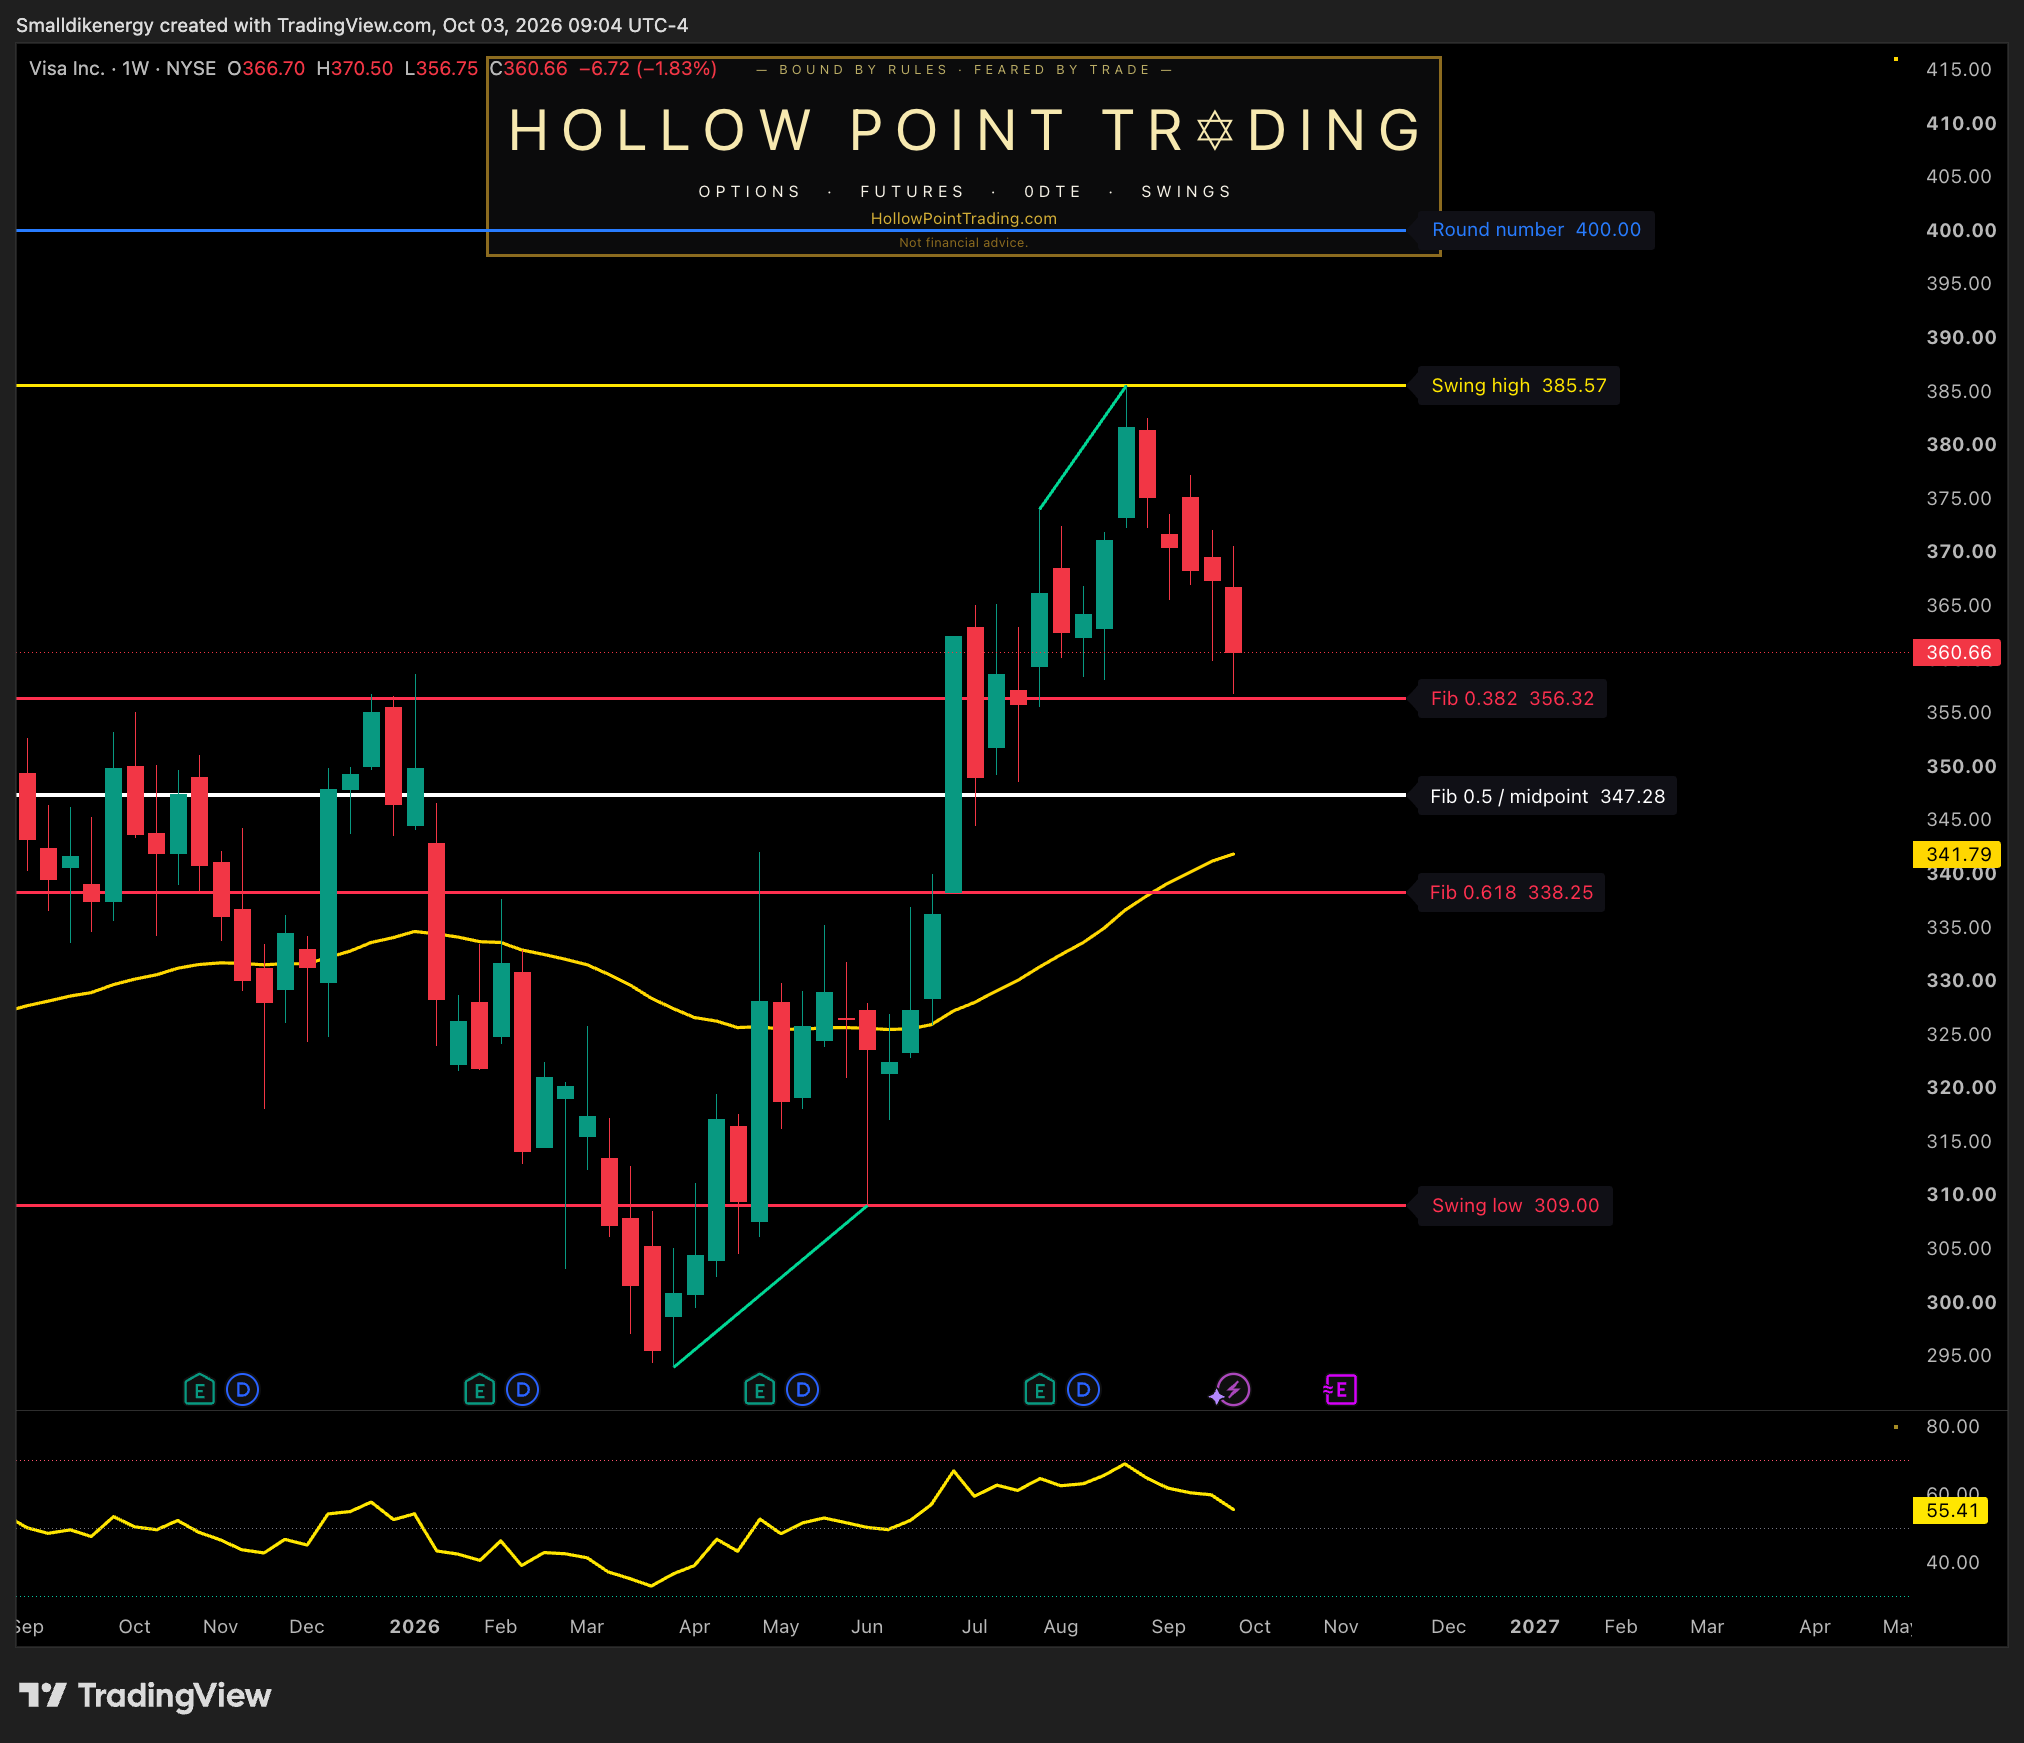
Source: TradingView, dedicated publisher HPT Daily Articles Sep30 chart, captured October 3, 2026 at 8:04:04 a.m. CT (9:04 a.m. EDT). Requested NYSE:V; observed BATS:V, NYSE by Cboe One; weekly (1W). Completed week ending October 2; Saturday market closed. Gold 55 EMA 341.79; RSI 55.41 is the only lower panel. Selected-swing levels and feed/adjustment choices may differ from other displays. Static educational chart, not live weekend pricing or a guaranteed fill.
Sources — Reported figures, arithmetic and inference
Visa fiscal Q3 2026 earnings release, July 28, 2026, SEC exhibit — the reported revenue categories, incentives and net revenue bridge.
Visa’s official fiscal Q3 results announcement, July 28, 2026 — company publication and investor-relations context.
Sources checked anew October 3. The sum of reported categories is arithmetic; the fictional 100-to-110 worksheet is teaching material. Chart scenarios are inference, not reported corporate guidance or actual future results.
Discussion: When you review Visa’s next statement, what evidence would explain the incentive bridge—and what price behavior around 356.32 would distinguish a controlled pullback from a failed hold?