
Hollow Point Trading | October 14, 2026 | First read of the 7:30 a.m. Central release
September’s inflation report delivered a difficult combination: a sharp increase in gasoline prices, underlying inflation that did not cool as much as economists expected, and another loss of purchasing power for workers.
The headline CPI rose 3.7% from a year ago. Core CPI rose 2.6%. The detail that matters for the market is that monthly core inflation came in at 0.3%, against a 0.2% Reuters consensus.
The headline monthly number, 0.6%, matched expectations. That distinction matters. A number can be high and still be priced in. The more useful question is what changed relative to what investors expected, and whether bonds and stocks accept that change.
This is an explanation of the released data and its market implications. The scenarios below are a framework for reading the response; they are not a live quote report.
1. What actually dropped
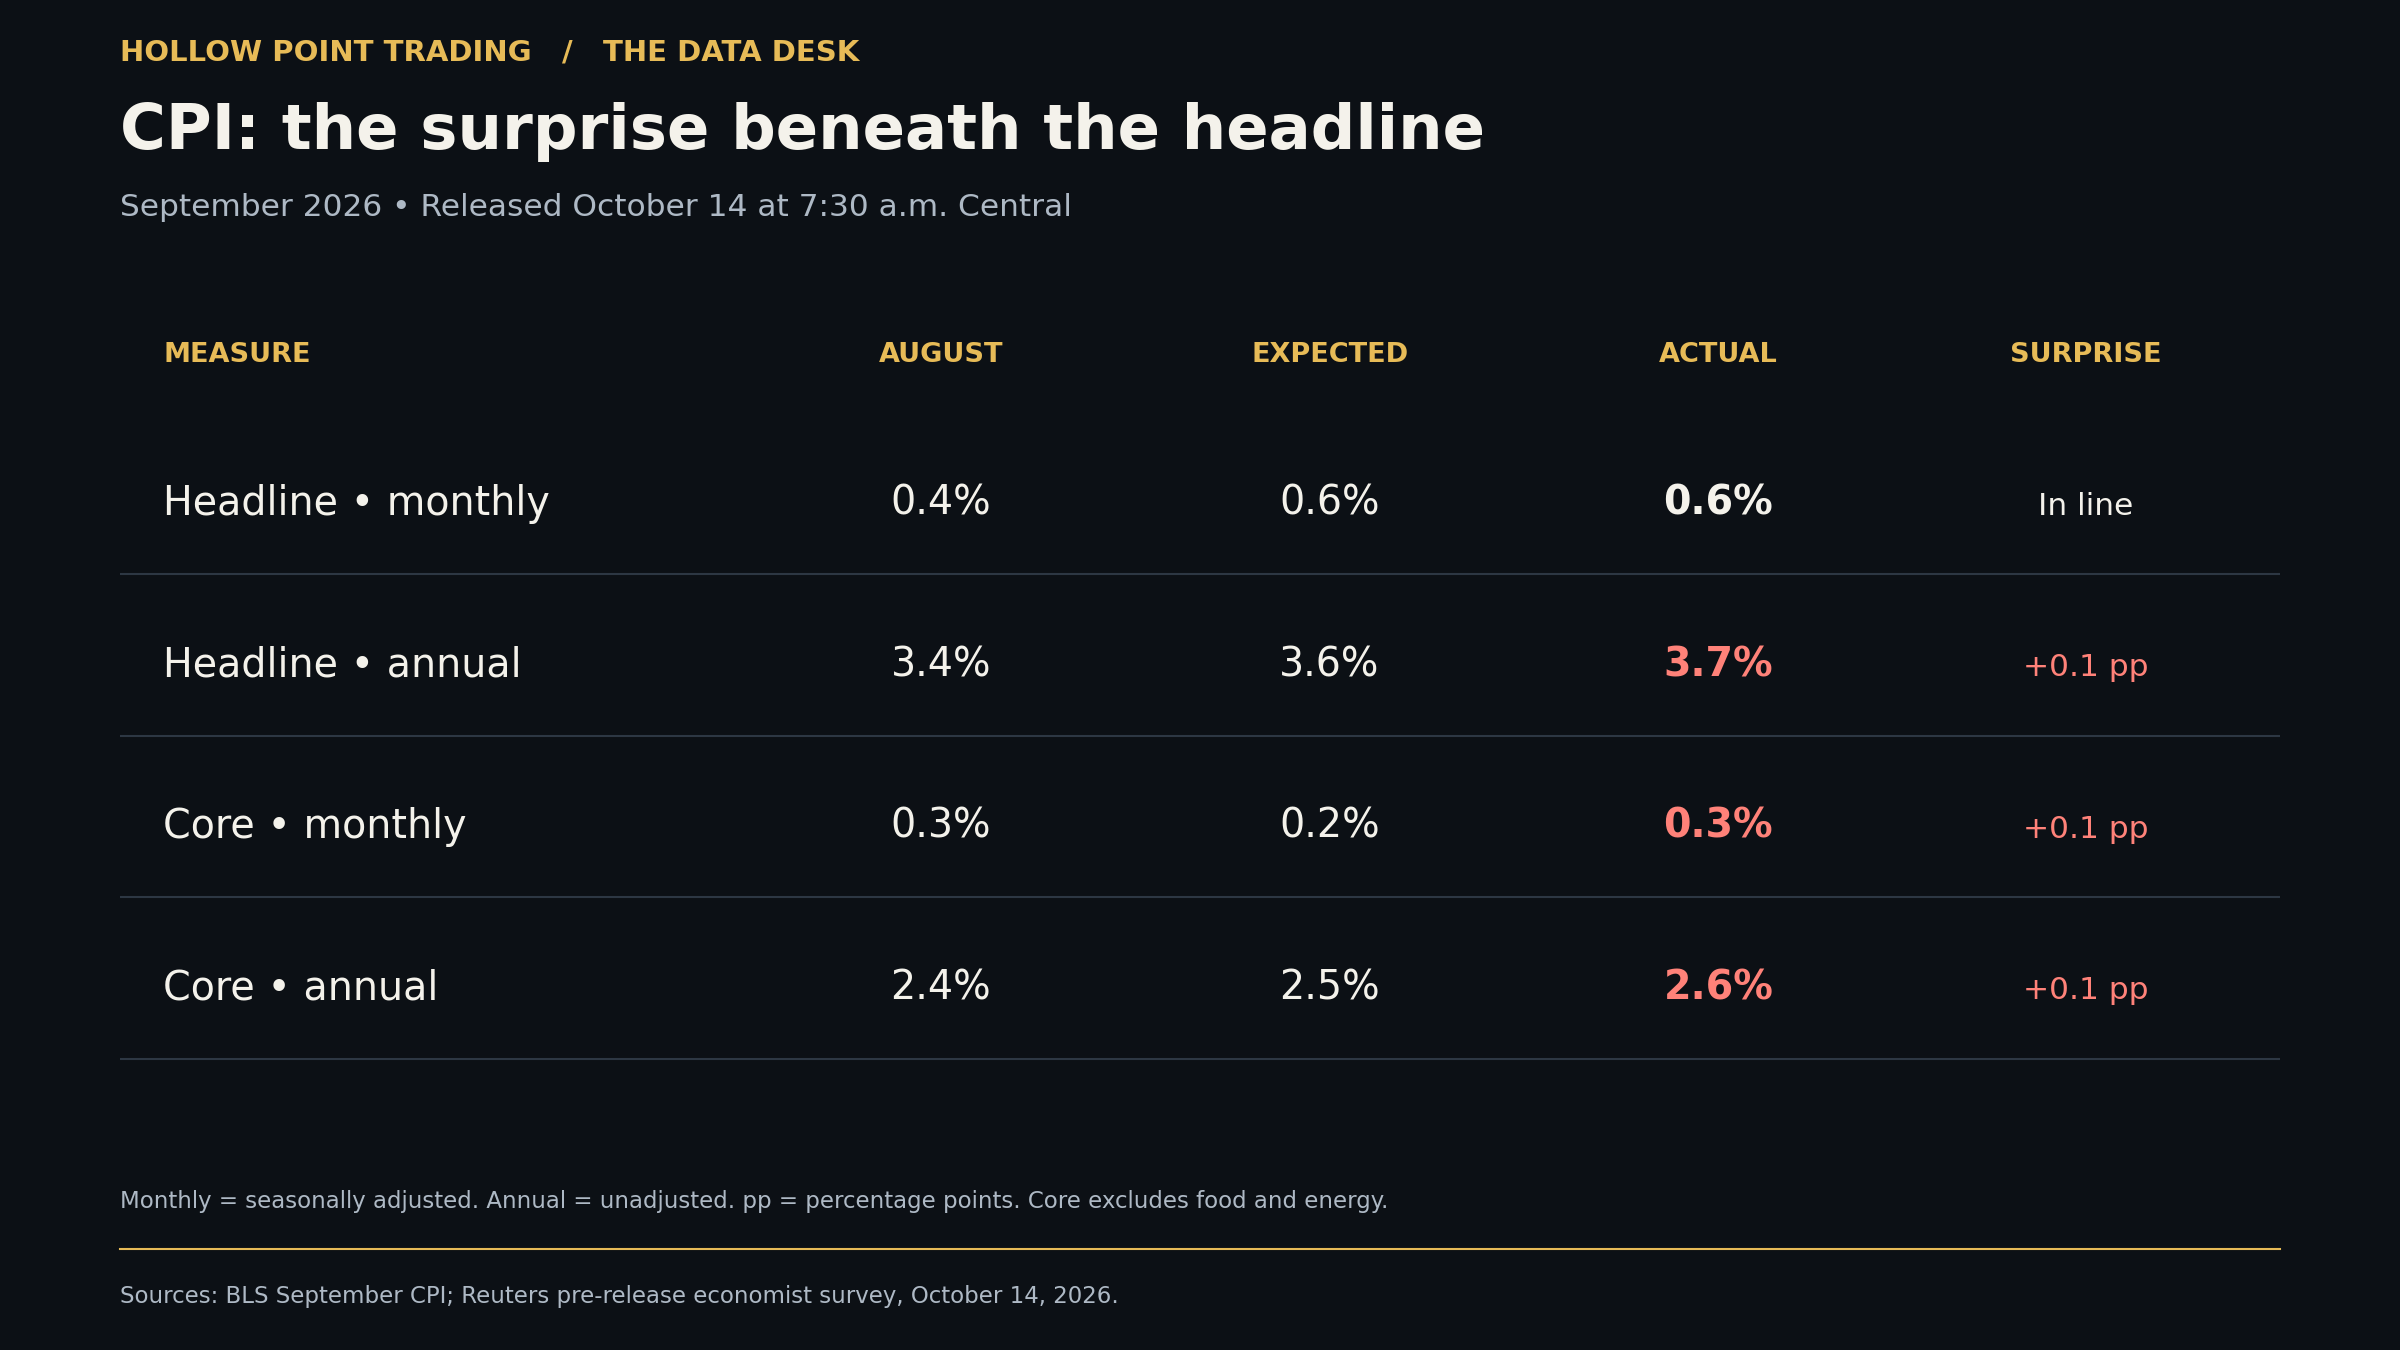
The scorecard compares the official September result with August and the Reuters pre-release consensus. “pp” means percentage points.
Headline CPI measures the broad consumer basket. Core CPI excludes food and energy to help reveal the underlying trend. That exclusion does not mean food and fuel are unimportant to your household budget. It helps analysts distinguish volatile price shocks from more persistent pressure.
Three of the four readings in the scorecard exceeded consensus. The annual headline rate rose from 3.4% to 3.7%; the annual core rate rose from 2.4% to 2.6%. The monthly core reading held at August’s 0.3%, instead of easing to the expected 0.2%.
My read: this report gives the Fed less reassurance about cooling inflation than the consensus forecast had promised. It does not, by itself, tell us the next policy decision or the direction of the next candle.
Sources: BLS September CPI release; Reuters pre-release economist survey.
2. The monthly trend explains more than one annual number
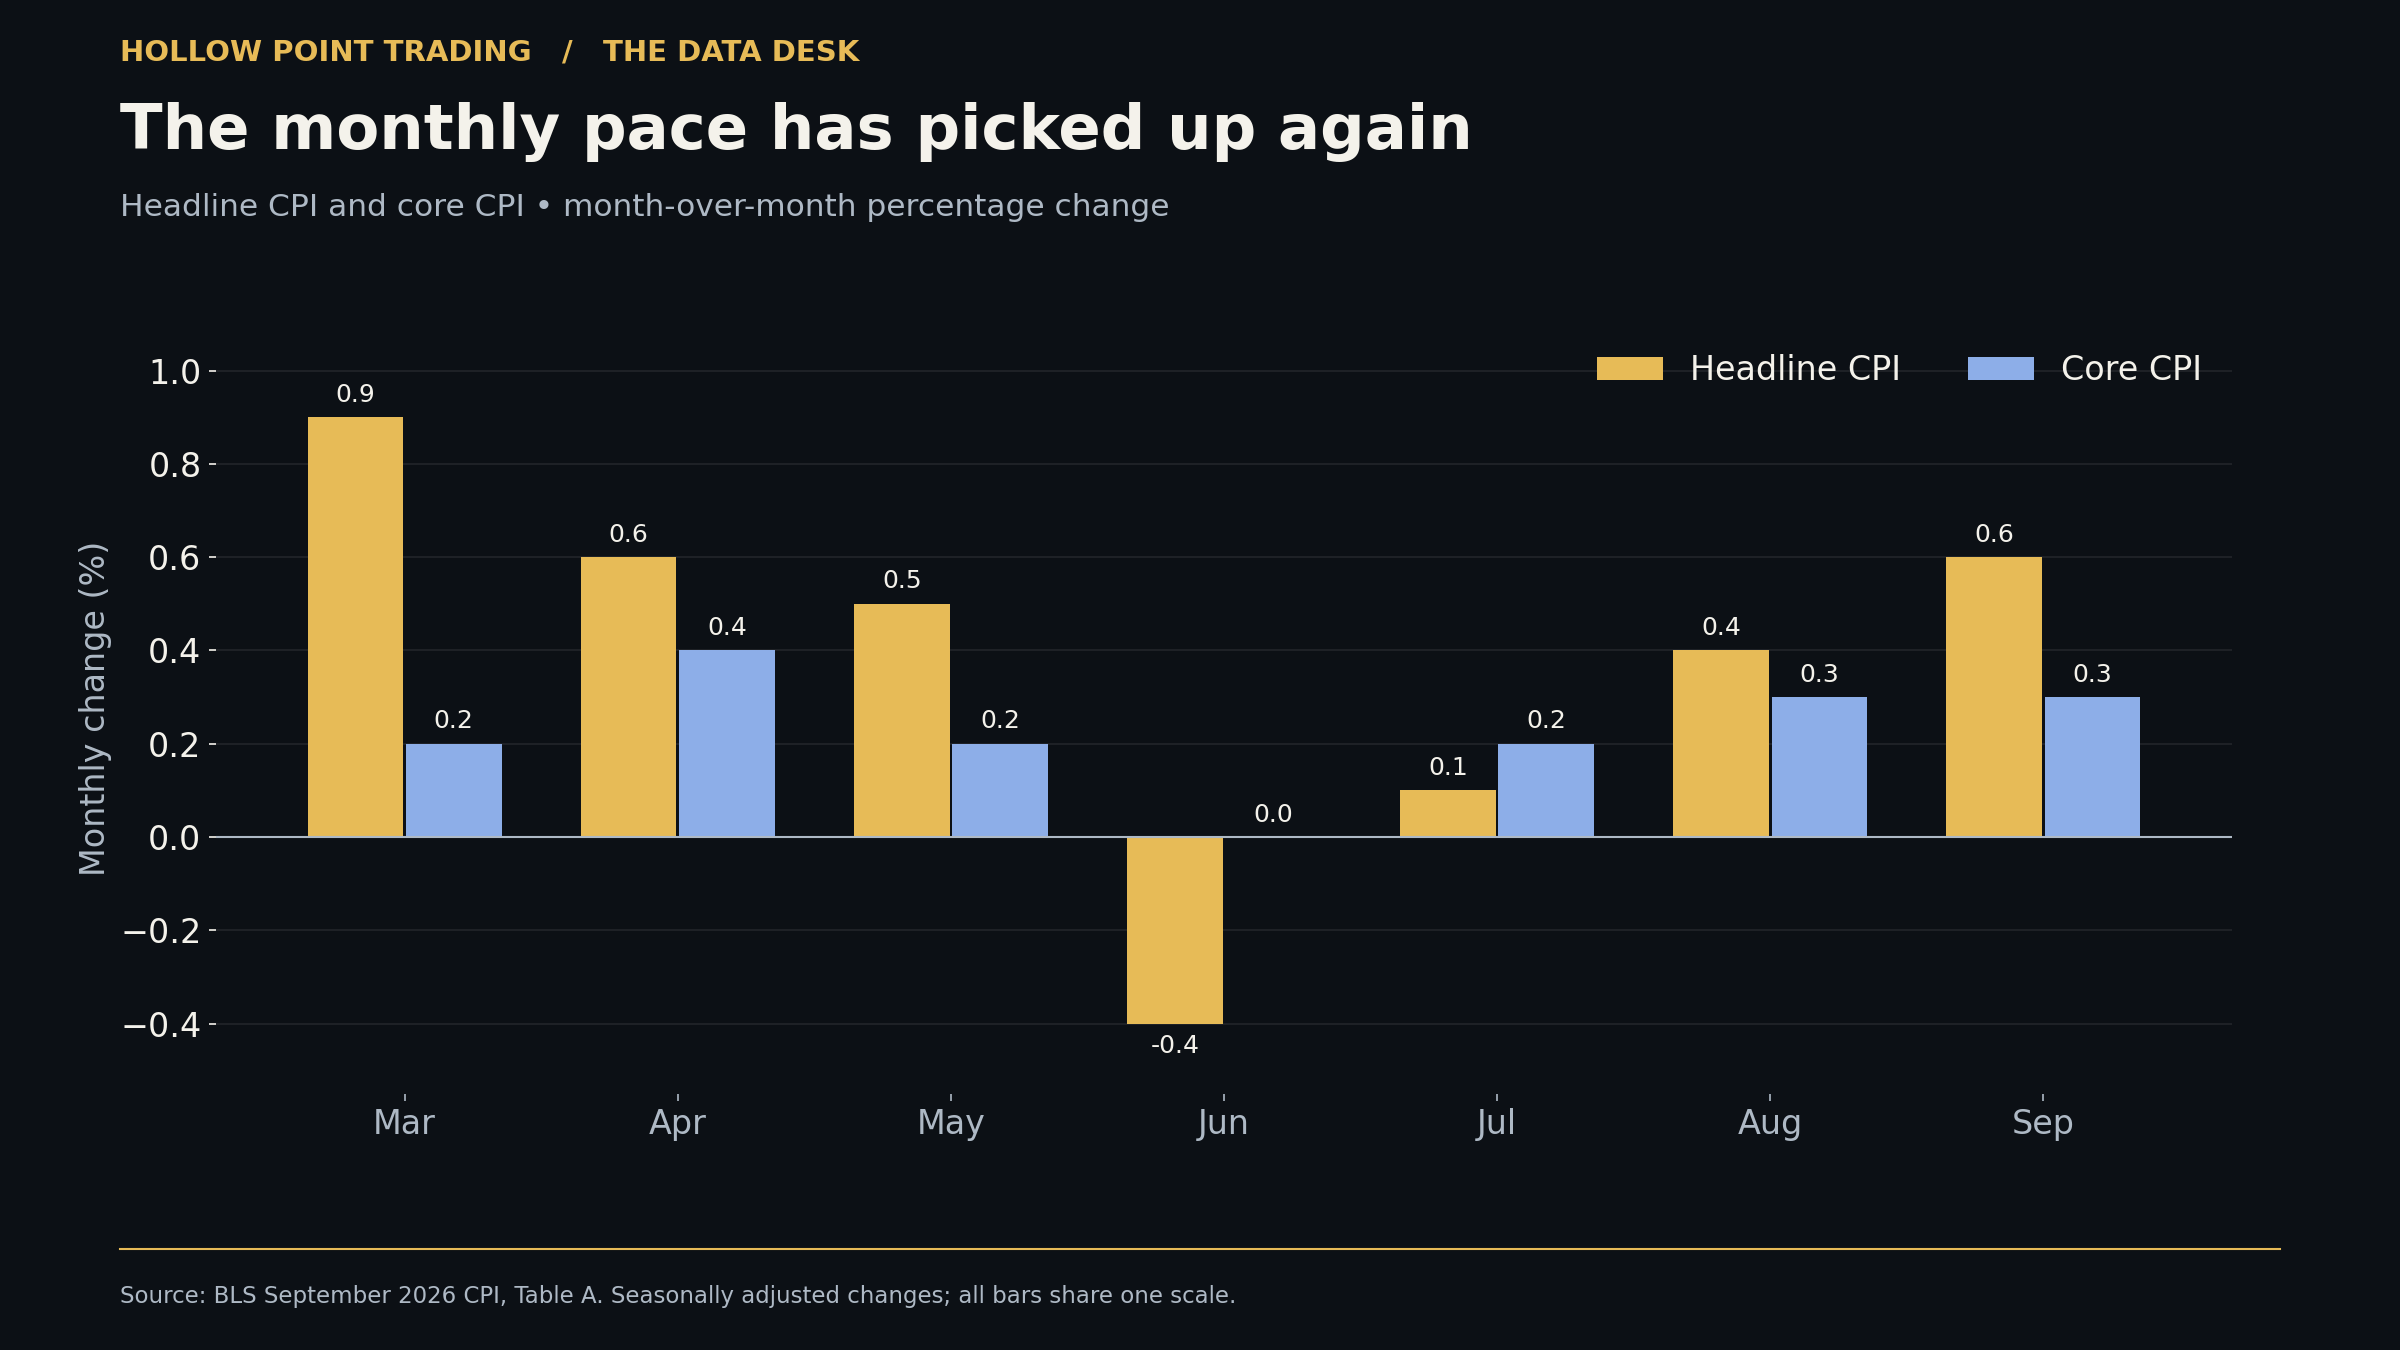
Monthly inflation has picked up since June. The bars show price changes, not cumulative price levels.
The headline monthly sequence moved from a 0.4% decline in June to increases of 0.1% in July, 0.4% in August and 0.6% in September. Core inflation followed a quieter but still firmer path: 0.0%, 0.2%, 0.3%, 0.3%.
The annual rate compares today’s price level with the price level twelve months earlier. The monthly rate tells us more about the latest pace. Both matter, but they answer different questions.
For perspective, repeating a 0.3% monthly increase for twelve months would compound to roughly 3.7%. That is an illustration using the rounded monthly number, not a forecast or the official annual core rate. It shows why a steady run of 0.3% readings would be uncomfortable even when one individual month seems small.
Source: BLS CPI, Table A. Annualized illustration: (1.003¹² − 1) × 100.
3. Gasoline did the heavy lifting. The rest still matters.
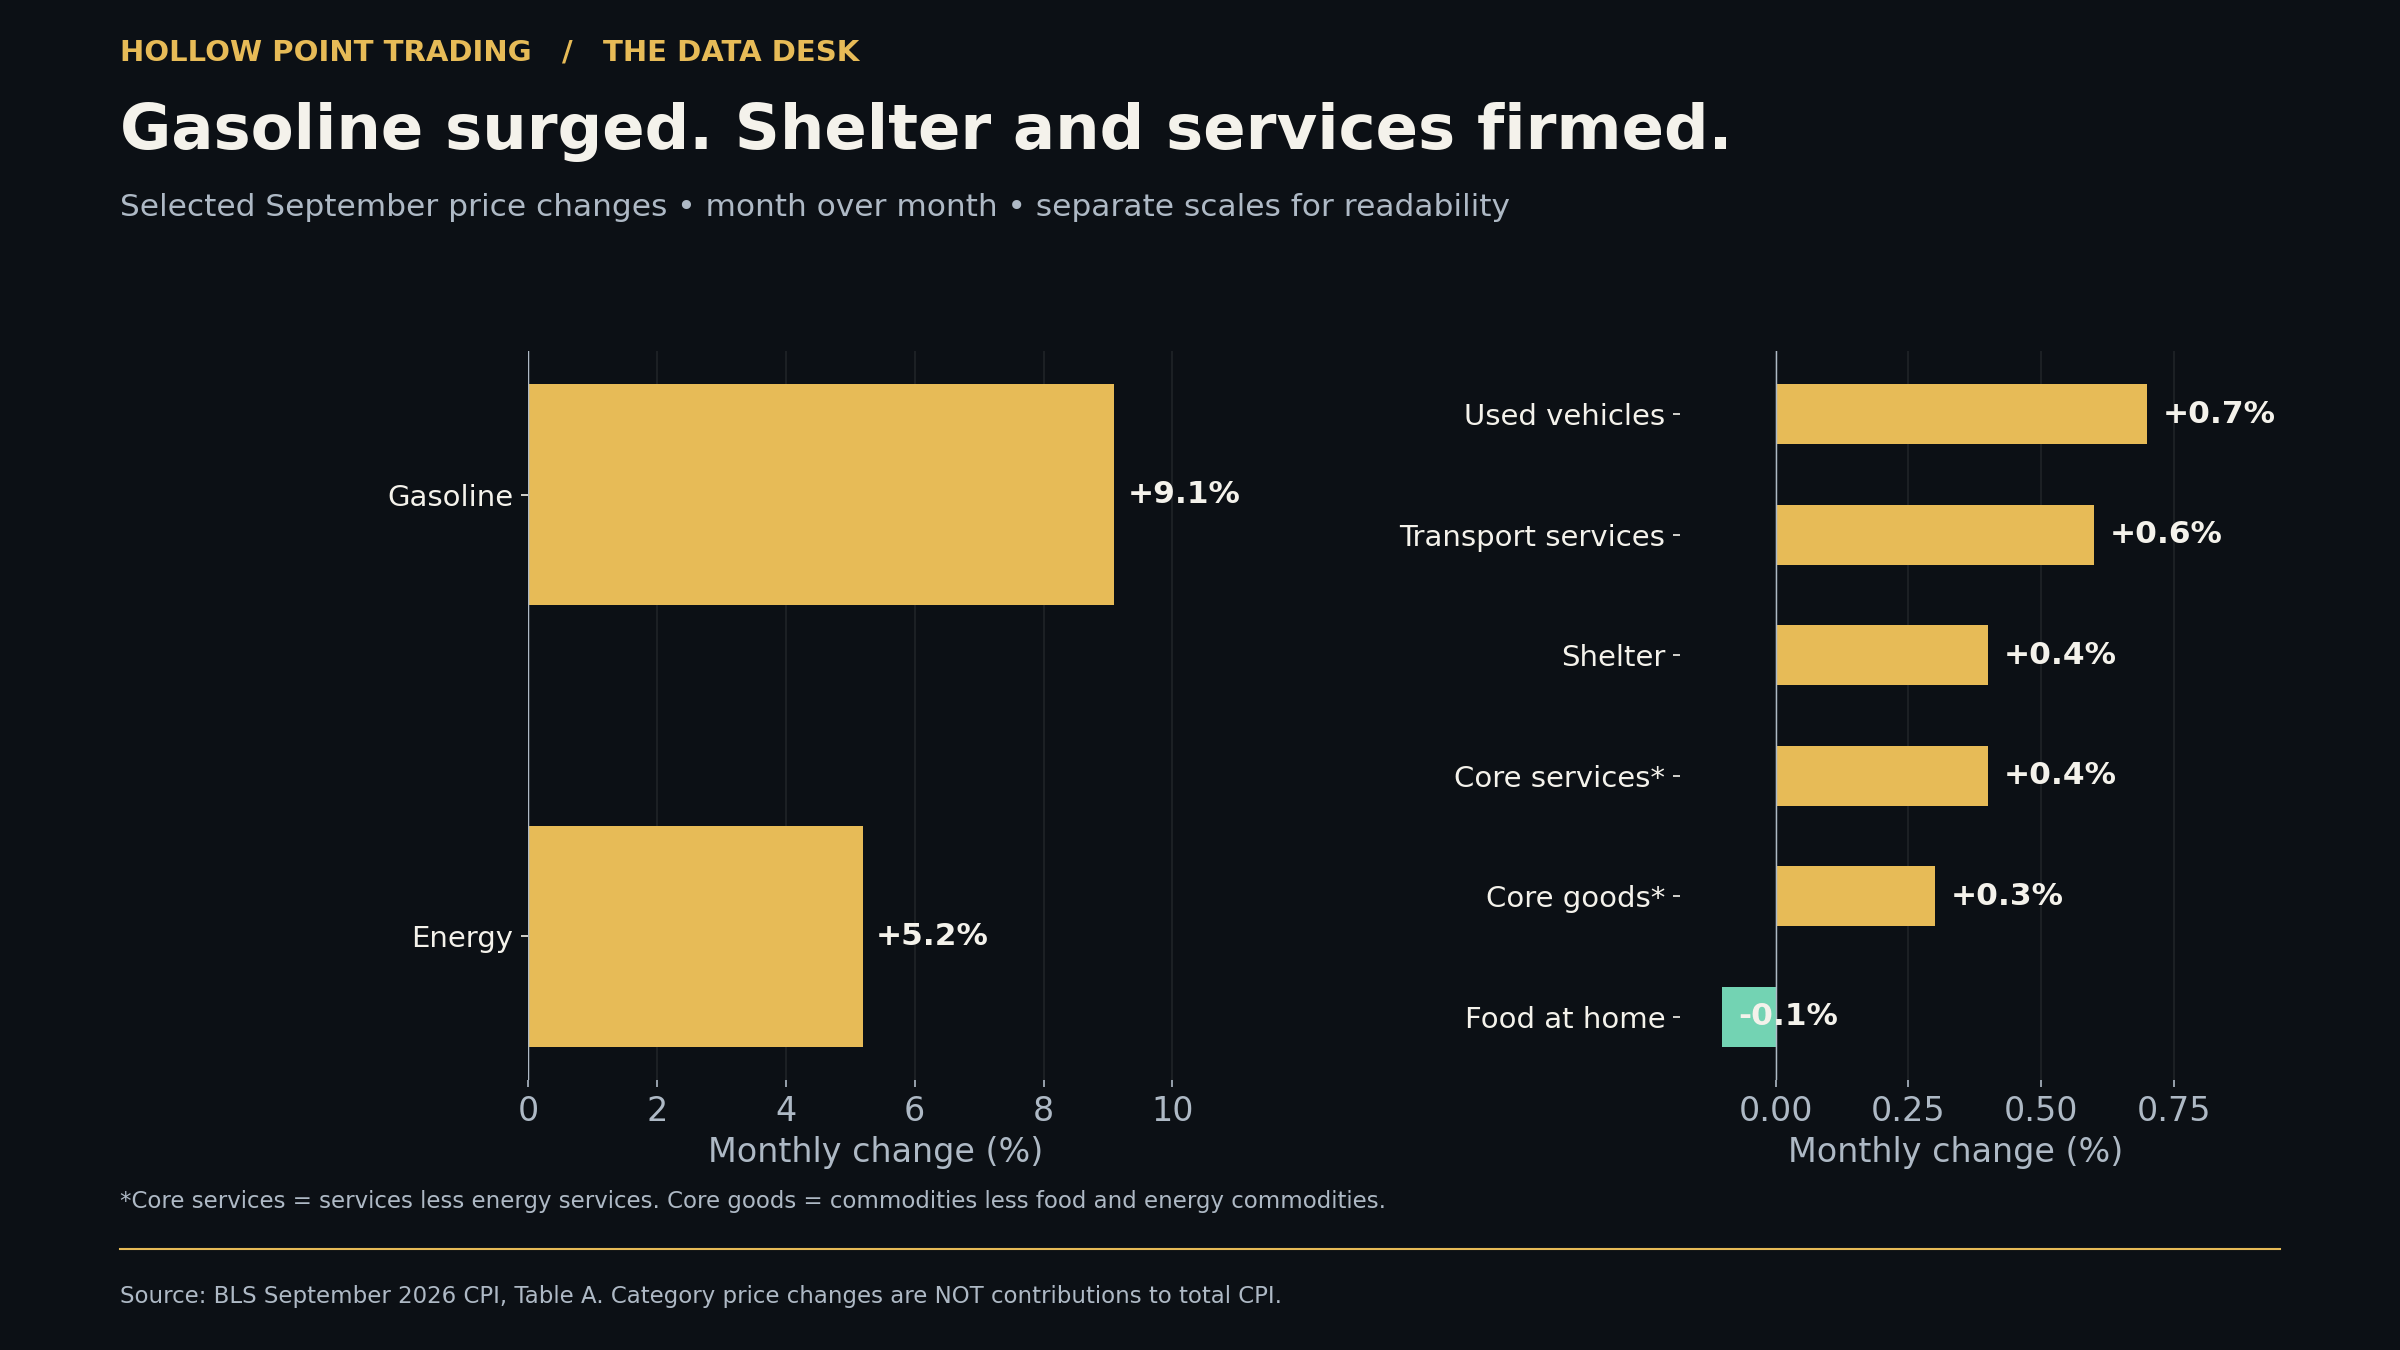
Separate scales keep the smaller changes readable. These are category price changes, not each category’s contribution to total inflation. Gasoline is part of energy, and shelter is part of core services; these bars should not be added together.
Gasoline rose 9.1% in September and accounted for more than half of the monthly headline increase, according to BLS. Energy overall rose 5.2%. This is the main reason the headline print looks so much hotter than core.
But shelter rose 0.4%, up from 0.3% in August. Services excluding energy also rose 0.4%, while core goods rose 0.3%. Used cars and trucks increased 0.7%, and transportation services increased 0.6%.
There was some relief: grocery prices slipped 0.1% and overall food prices were unchanged for the month. That is a welcome monthly improvement, but groceries were still 1.8% more expensive than a year earlier.
The practical distinction is persistence. An energy reversal could cool future headline readings. A sustained acceleration across shelter, services and goods would be harder for policymakers to dismiss. One release cannot establish how long either pattern will last.
Source: BLS September CPI components and commentary.
4. The second release: workers lost purchasing power
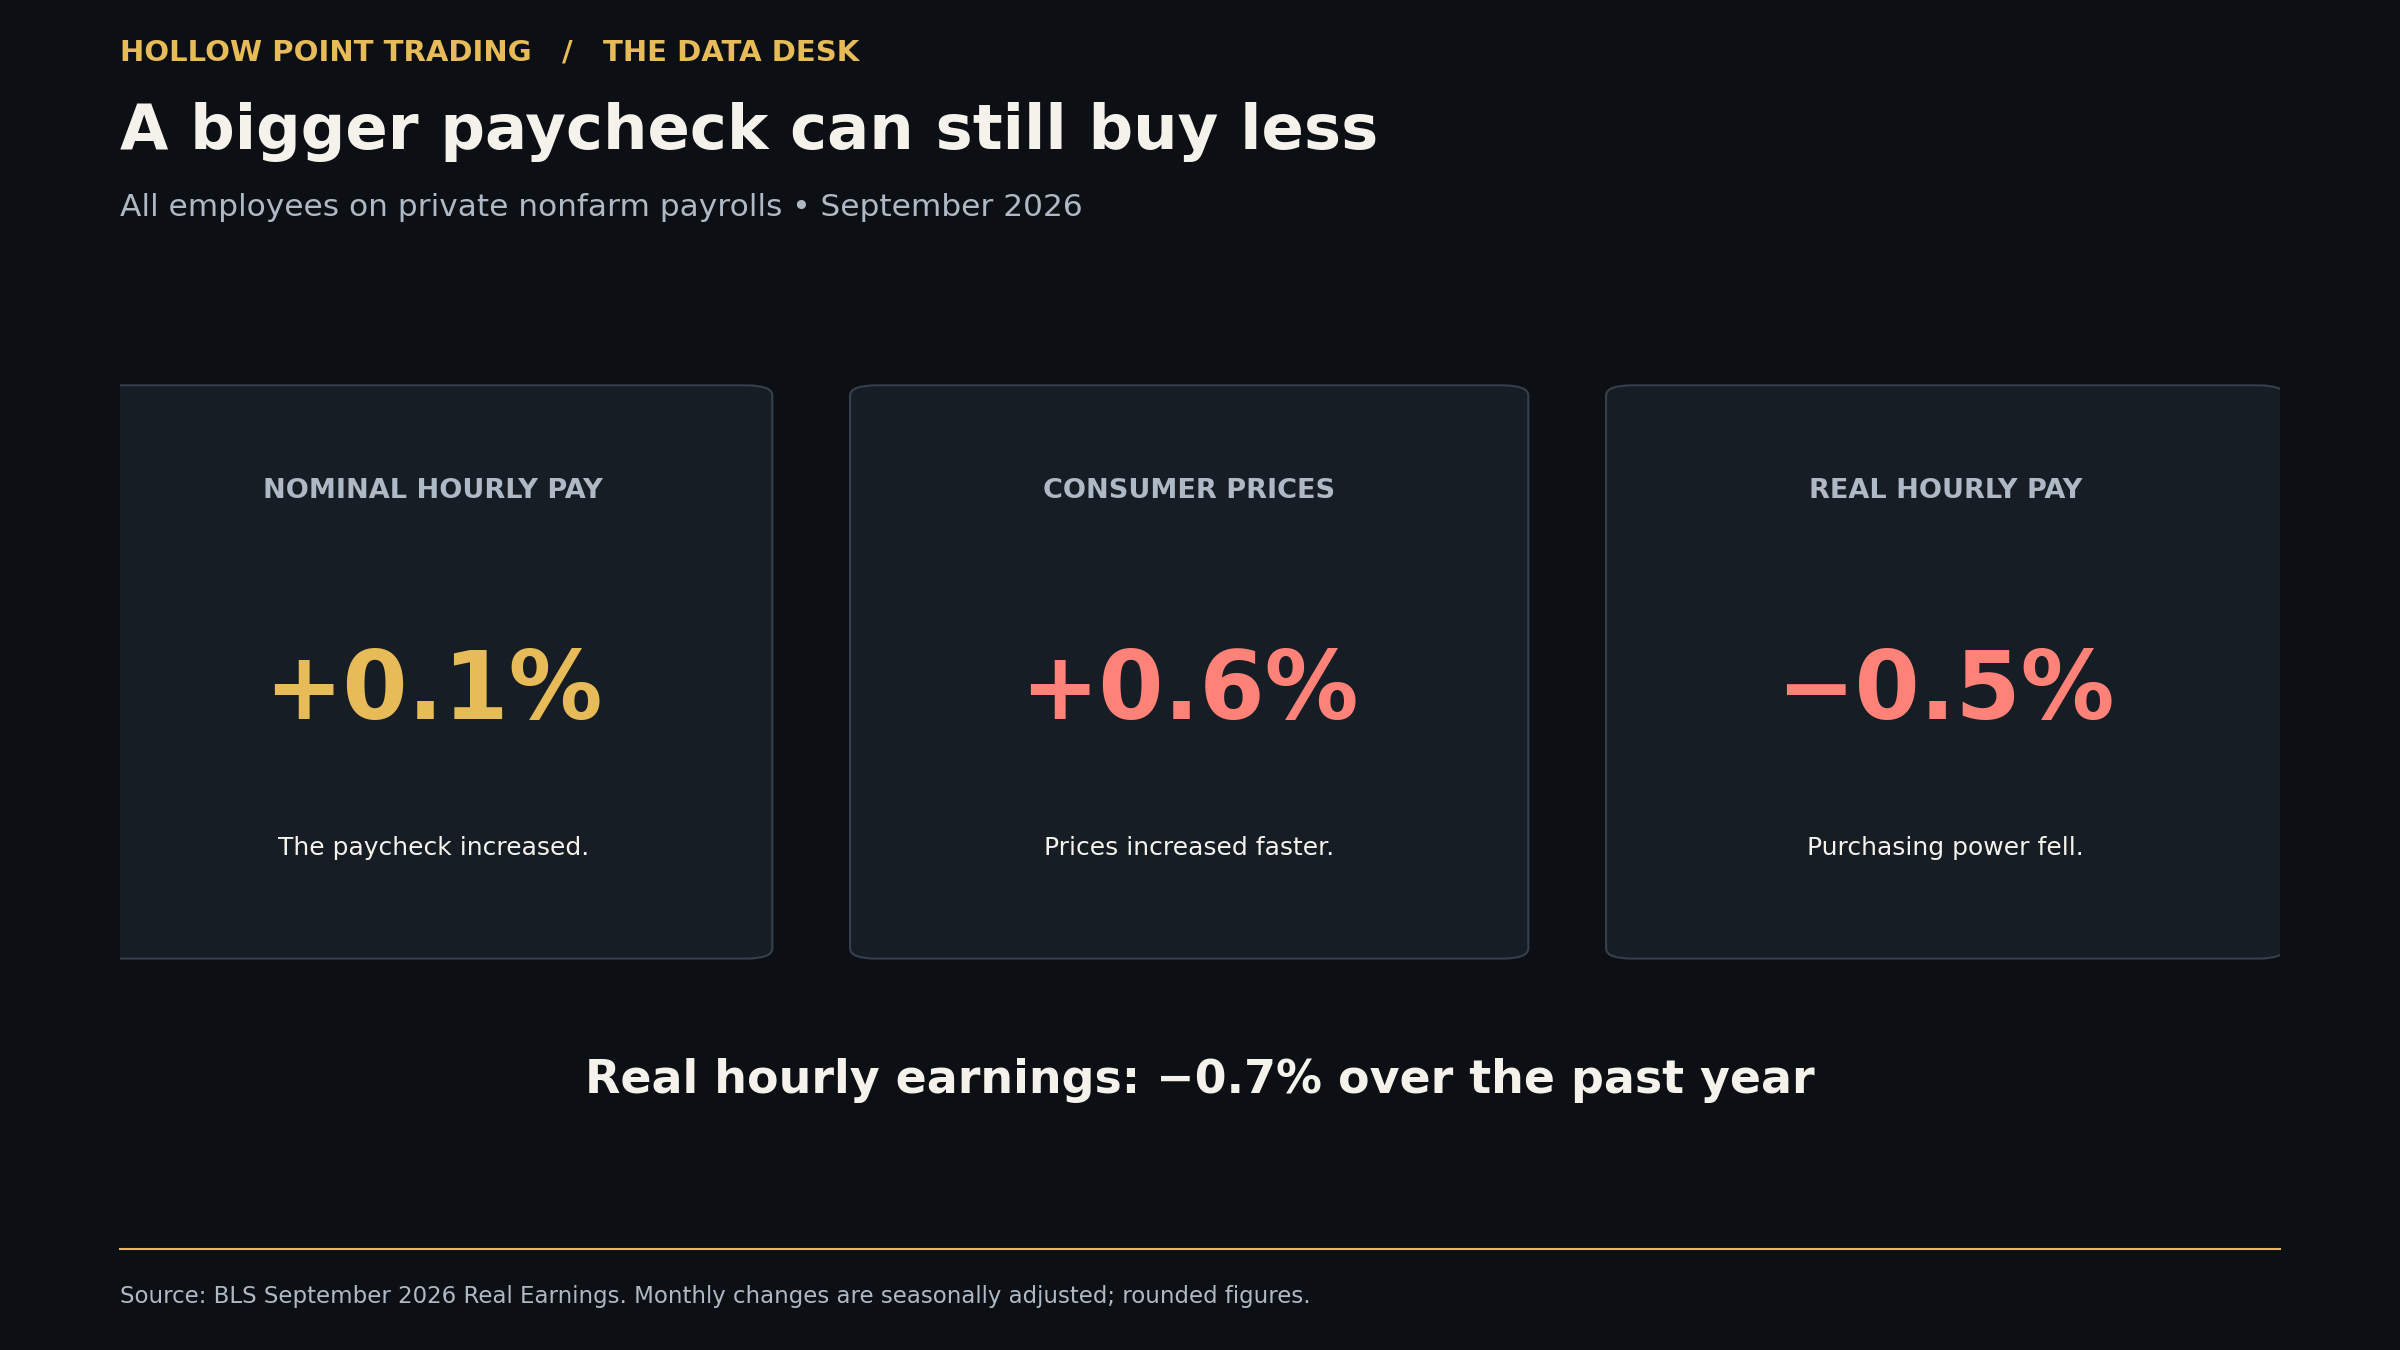
Nominal pay is the dollar amount earned. Real pay adjusts that amount for inflation. These are averages across private nonfarm employees, not the outcome for every worker.
The real-earnings report released alongside CPI puts the household impact in plain English. Average hourly earnings rose 0.1% in dollar terms, but consumer prices rose 0.6%. After adjusting for inflation, hourly earnings fell 0.5% in September.
Real average weekly earnings also fell 0.5% for the month. Compared with September last year, real hourly earnings were down 0.7%; real weekly earnings were down 0.1%.
That squeeze matters because spending depends on what income can buy. Households facing higher necessary expenses have less room for discretionary purchases unless they draw on savings, increase borrowing, or find additional income. It is a reason to watch consumer-company commentary and spending data closely. It is not proof, by itself, of an economy-wide spending collapse.
Source: BLS September Real Earnings release.
5. What this means for the Fed, bonds and stocks
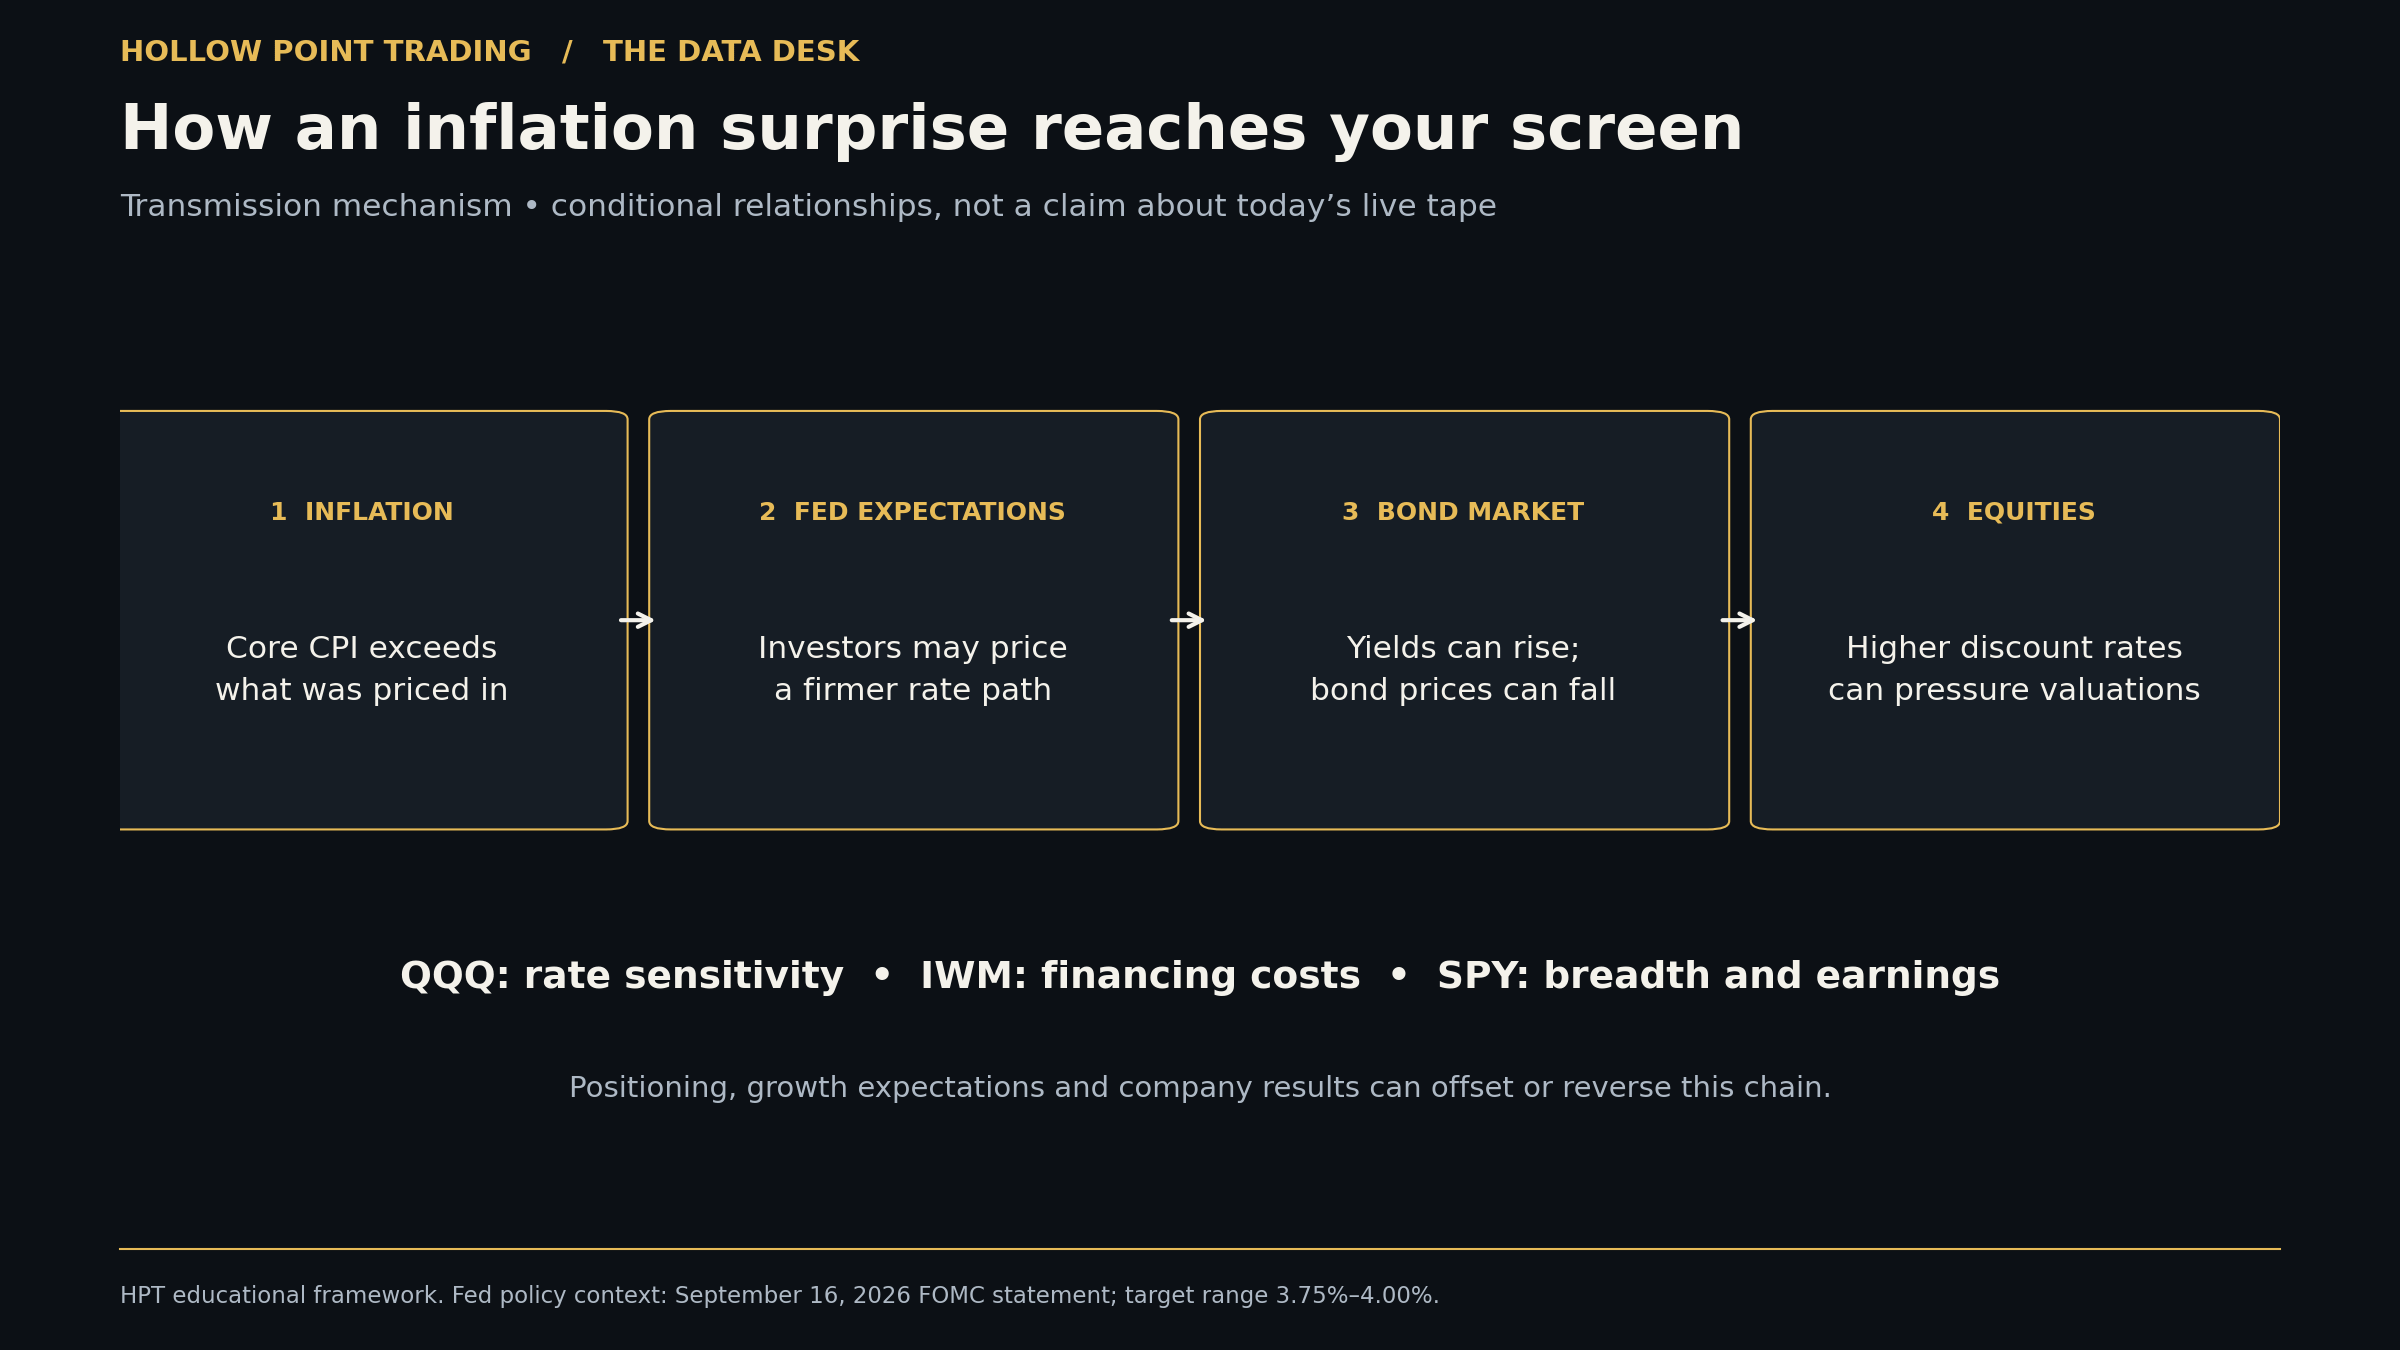
This diagram shows a possible transmission mechanism. Each step needs market confirmation.
The Fed raised its policy-rate target by a quarter point on September 16, bringing it to 3.75%–4.00%. Against that backdrop, a hotter-than-expected core reading can reinforce the case for keeping policy restrictive or considering further tightening.
There is an important measurement distinction: the Fed’s 2% longer-run inflation goal uses the PCE price index. CPI supplies useful evidence, but today’s 3.7% headline CPI is not the precise measure the Fed targets. The central bank also considers employment, growth and other information.
Sources: September FOMC statement; Federal Reserve explanation of its inflation goal.
For markets, the useful chain is inflation surprise → expected policy path → bond yields → financing costs and stock valuations. Higher discount rates reduce the present value of future earnings, all else equal. Earnings growth and investor positioning can offset that effect, so the relationship is not a mechanical trading rule.
QQQ and growth stocks: watch whether a higher-yield environment pressures the valuations investors are willing to pay for future growth.
SPY and the broader market: watch breadth. A handful of large stocks holding the index up is different from broad participation.
IWM and smaller companies: tighter financing conditions can matter more for businesses that need to refinance or depend heavily on borrowing. Company balance sheets still differ.
Energy and consumer businesses: rising fuel prices can support some producers while squeezing fuel users and household budgets. Exposure, hedges and pricing power determine the company-level effect.
6. How to read the response without chasing the first move
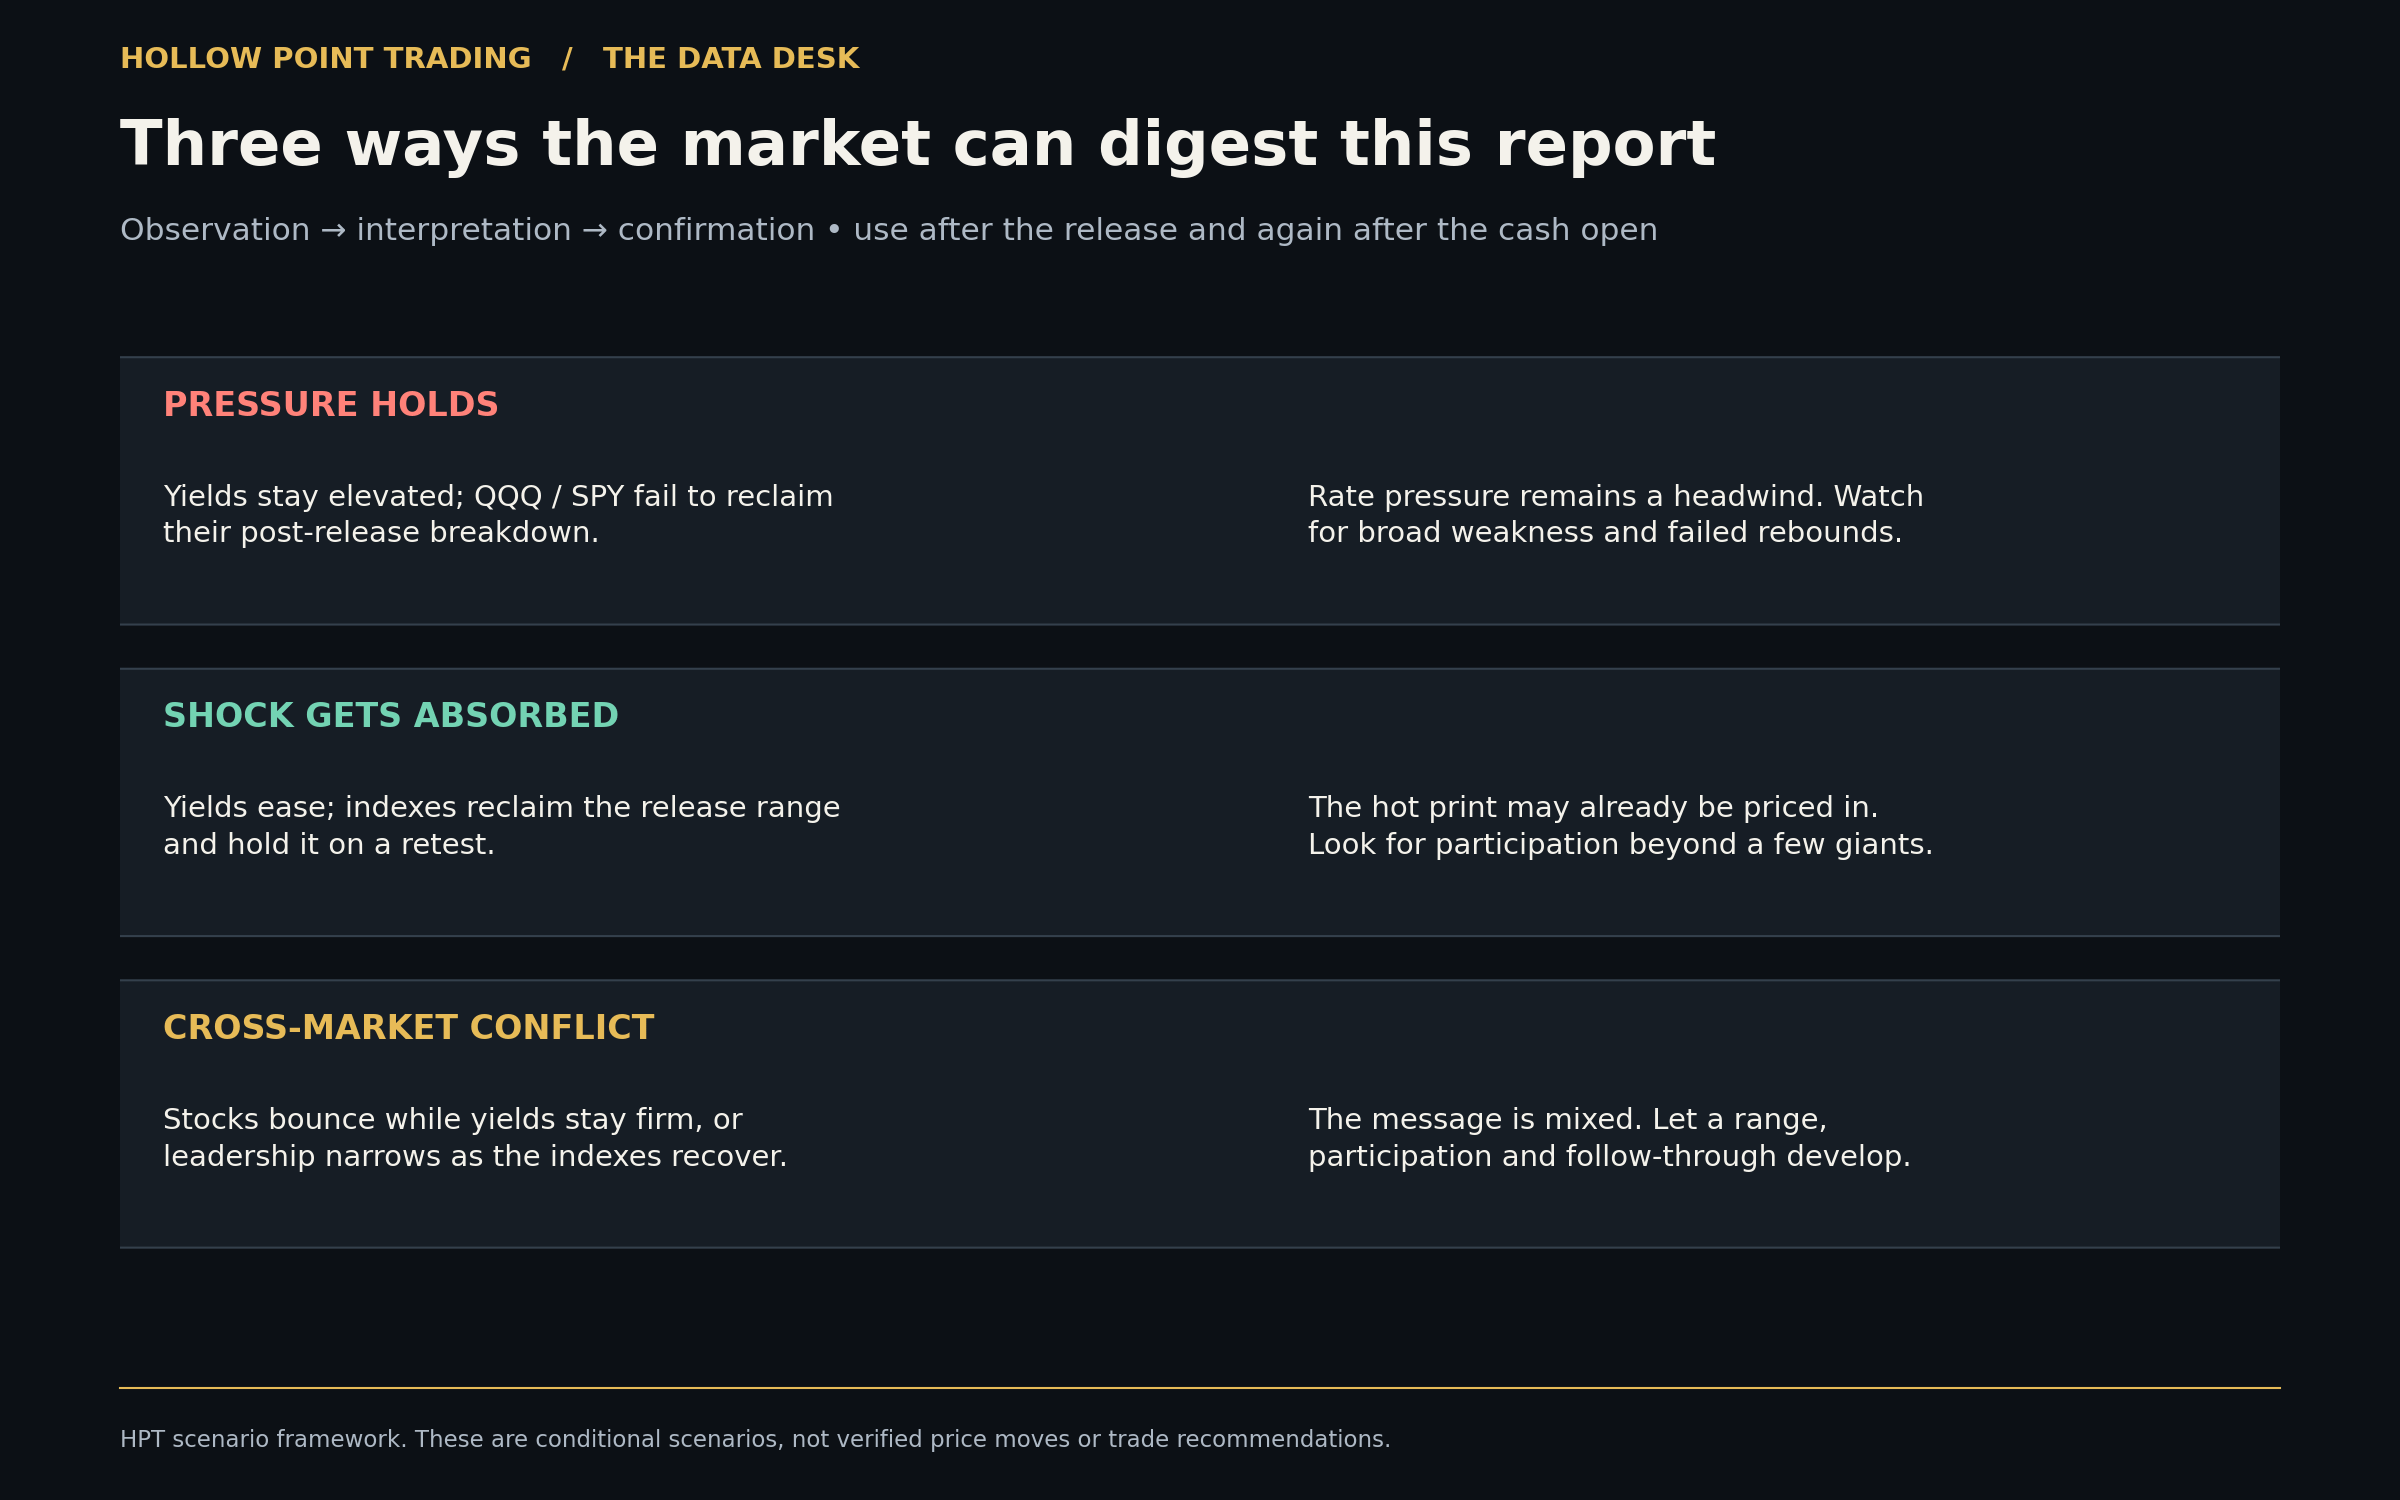
These are conditional scenarios. “Reclaim” means price moves back above a level it lost and then holds it; a retest checks whether that recovery has support.
Start with the two-year Treasury yield, which is sensitive to the expected policy path. Then compare the ten-year yield, the dollar and the equity response. They need not move together, but disagreement is information.
If yields stay elevated and indexes repeatedly fail to recover the release range, that supports the interpretation that rate pressure is being repriced. If yields ease and the indexes recover and hold that range with broader participation, the market may be absorbing the bad news.
A stock bounce alongside persistently firm yields deserves a closer look at leadership and follow-through. It can work, but the macro explanation alone is not enough to validate it.
At the 8:30 a.m. Central cash open, reassess participation. A premarket reaction and a cash-session trend are different observations. Let price establish the level that would invalidate your interpretation before deciding that the first move has settled the day.
7. Which stocks are exposed, and why?
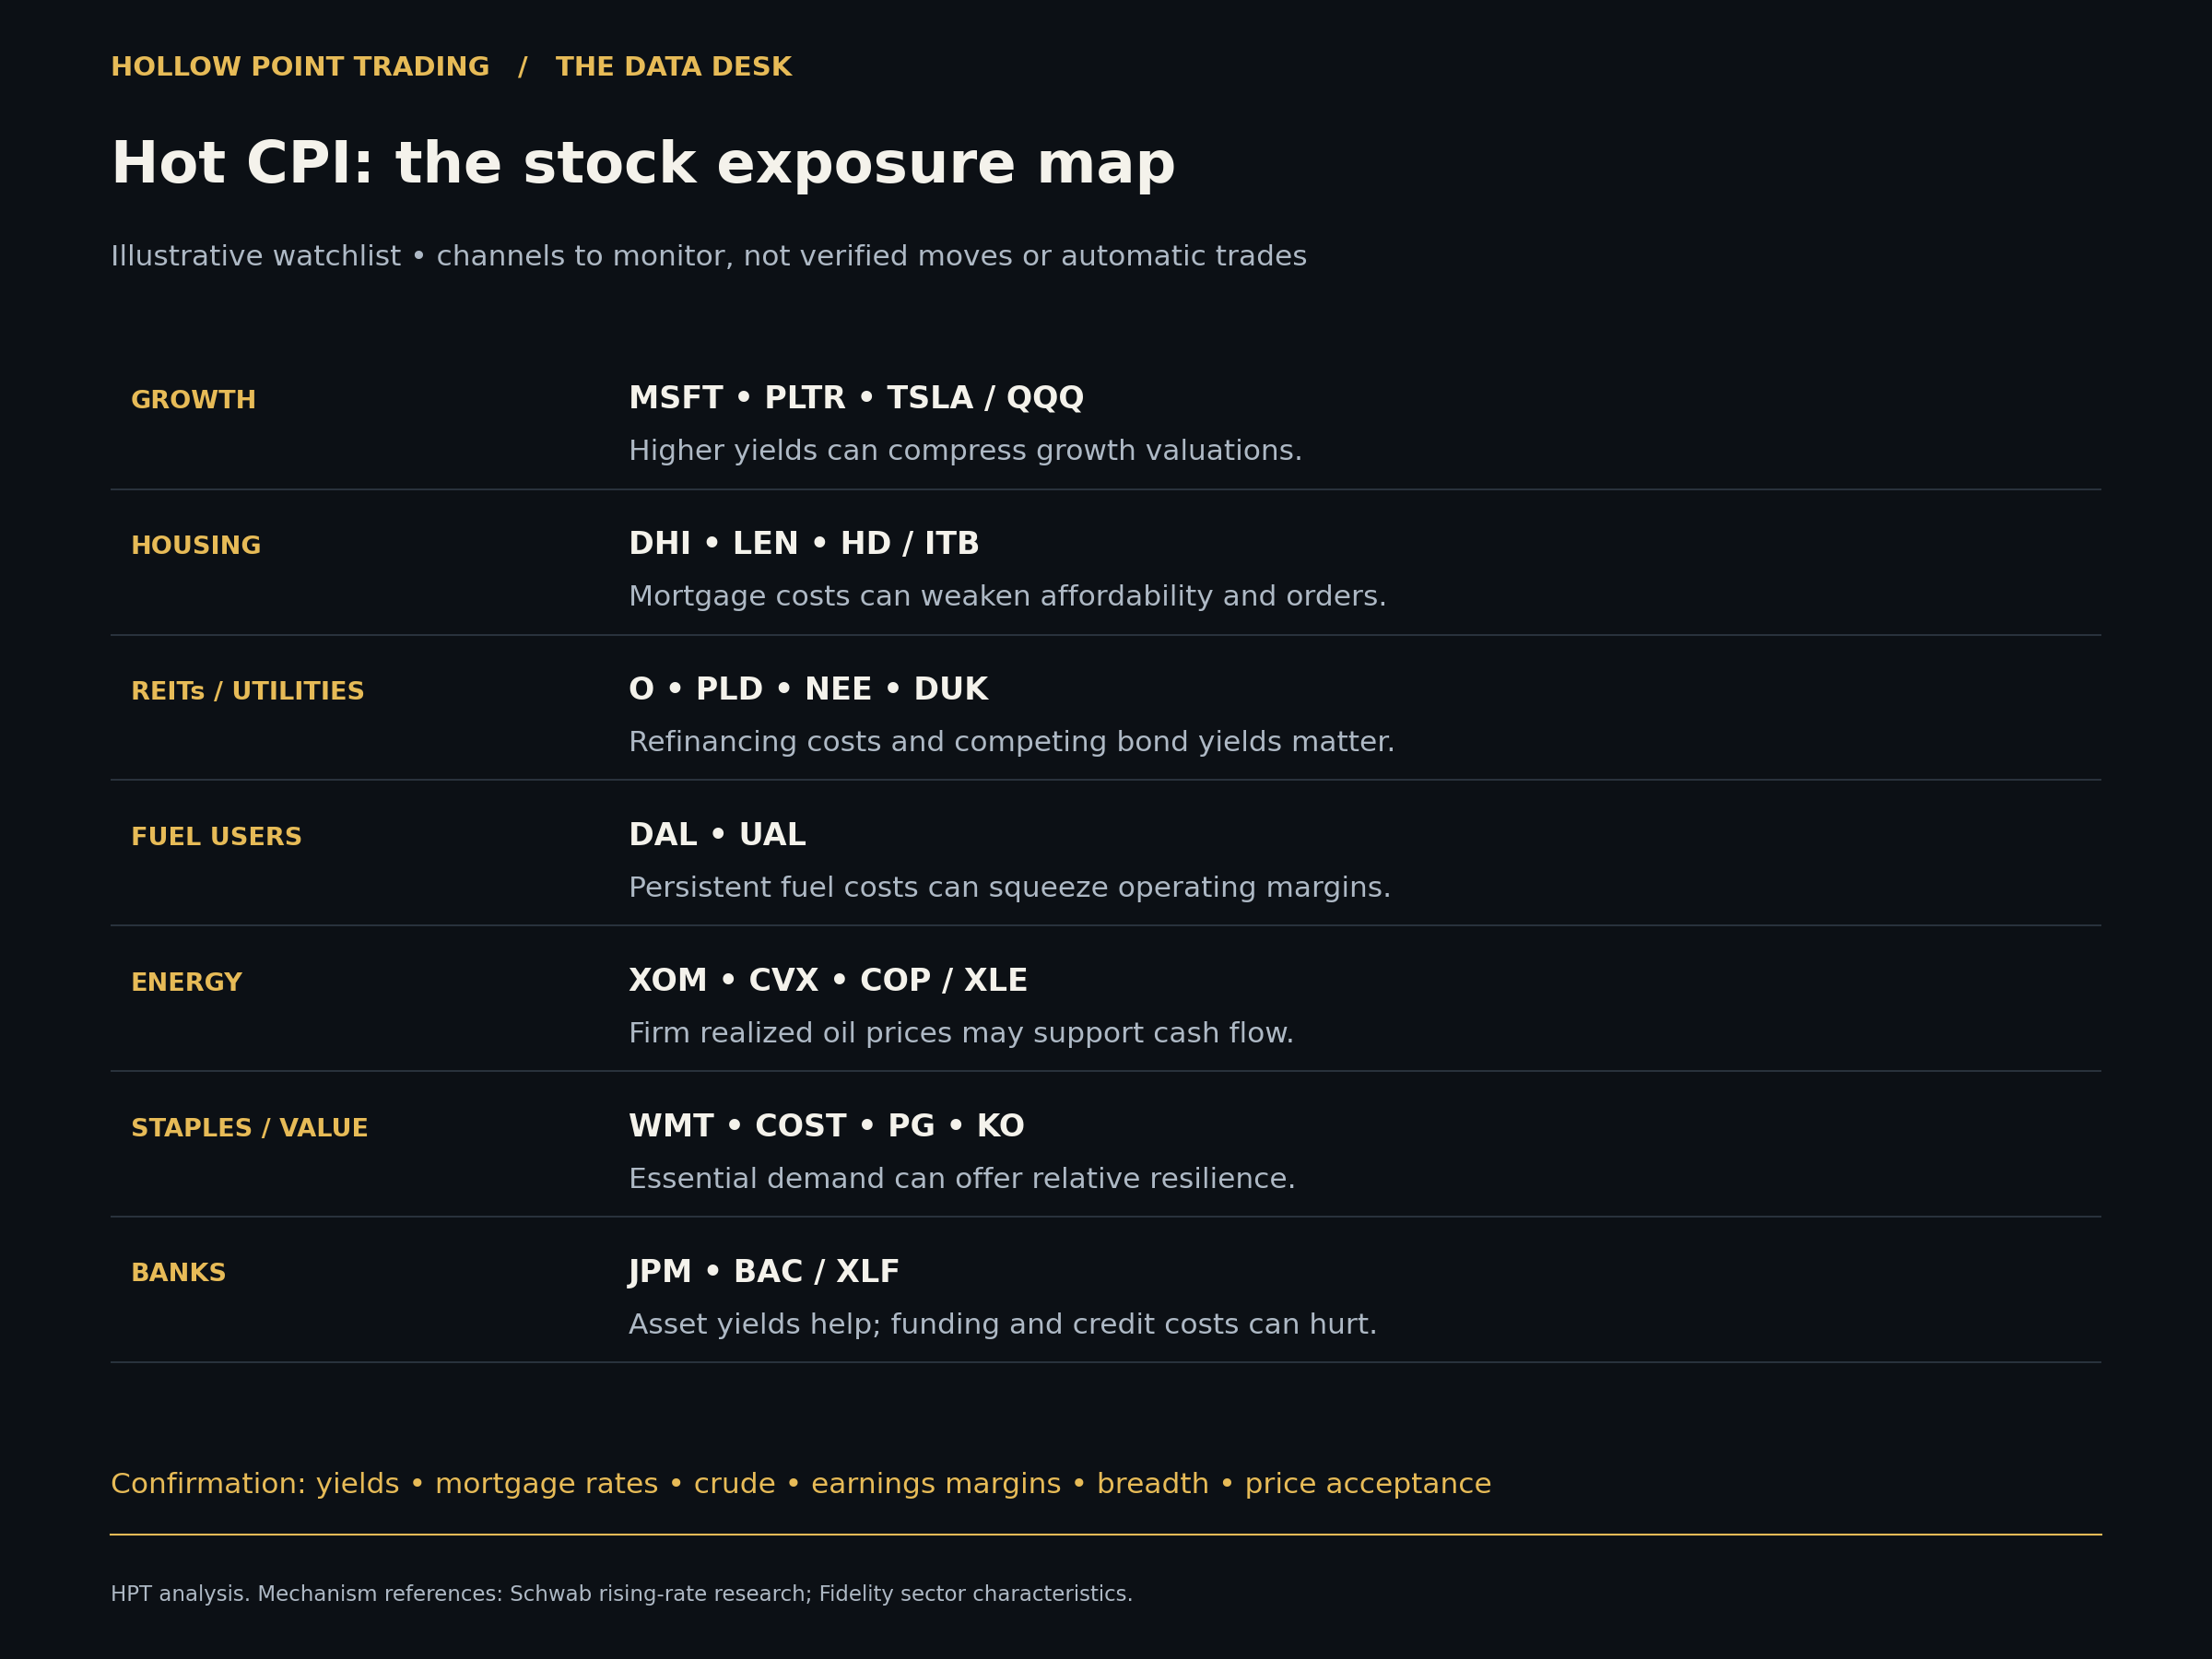
Illustrative watchlist, not a list of verified winners or losers today. These are business exposures and valuation channels; earnings, balance sheets and existing positioning can override the macro effect.
Growth and valuation sensitivity: MSFT, PLTR, TSLA; QQQ as a broader vehicle. Higher bond yields raise the discount rate applied to future profits. That can compress the multiple investors pay for growth. Strong current cash generation, earnings revisions and company-specific catalysts can offset this pressure. These names do not have identical businesses or risk.
Housing and financed purchases: DHI, LEN, HD; ITB for homebuilders. If hot CPI pushes mortgage rates up, affordability weakens and builders may need larger incentives. Slower transactions can also weigh on renovation demand. The confirming evidence is mortgage rates, orders, cancellations and margins, rather than CPI alone.
REITs and utilities: O, PLD, NEE, DUK; XLRE and XLU. Higher refinancing costs can weigh on capital-intensive businesses. Higher bond yields also give income investors an alternative to equity dividends. Rent growth, regulated returns and electricity-demand growth can soften that pressure. “Defensive” does not mean immune to rates.
Fuel users: DAL, UAL and other transport operators. If the gasoline shock reflects persistent petroleum strength, jet fuel and other operating costs can become a margin problem. Pricing power, fuel hedges, capacity and demand determine how much reaches earnings. Higher CPI does not automatically mean every airline loses money.
Potential relative beneficiaries: XOM, CVX, COP; XLE. Sustained higher realized oil prices can improve upstream revenue and cash flow, all else equal. But an energy-led CPI print is backward-looking: falling crude prices or weakening demand can reverse this thesis. Refining economics and natural-gas exposure also differ between companies.
Household-budget defensives: WMT, COST, PG and KO. Essential purchases can be steadier than discretionary spending, and value retailers may benefit from trade-down behavior. That is potential relative resilience, not guaranteed positive returns. Input costs, pricing elasticity and expensive valuations still matter.
Banks are a two-sided trade: JPM and BAC; XLF. Higher rates can help asset yields, but deposit competition, funding costs, unrealized bond losses and borrower stress can offset that benefit. Watch the yield curve, net interest income and credit quality. “Hot CPI equals buy banks” is too simplistic.
Mechanism references: Schwab on rates, growth valuations and capital-intensive sectors; Fidelity sector characteristics. The ticker examples and confirmation conditions are HPT analysis.
8. How could you position for it?
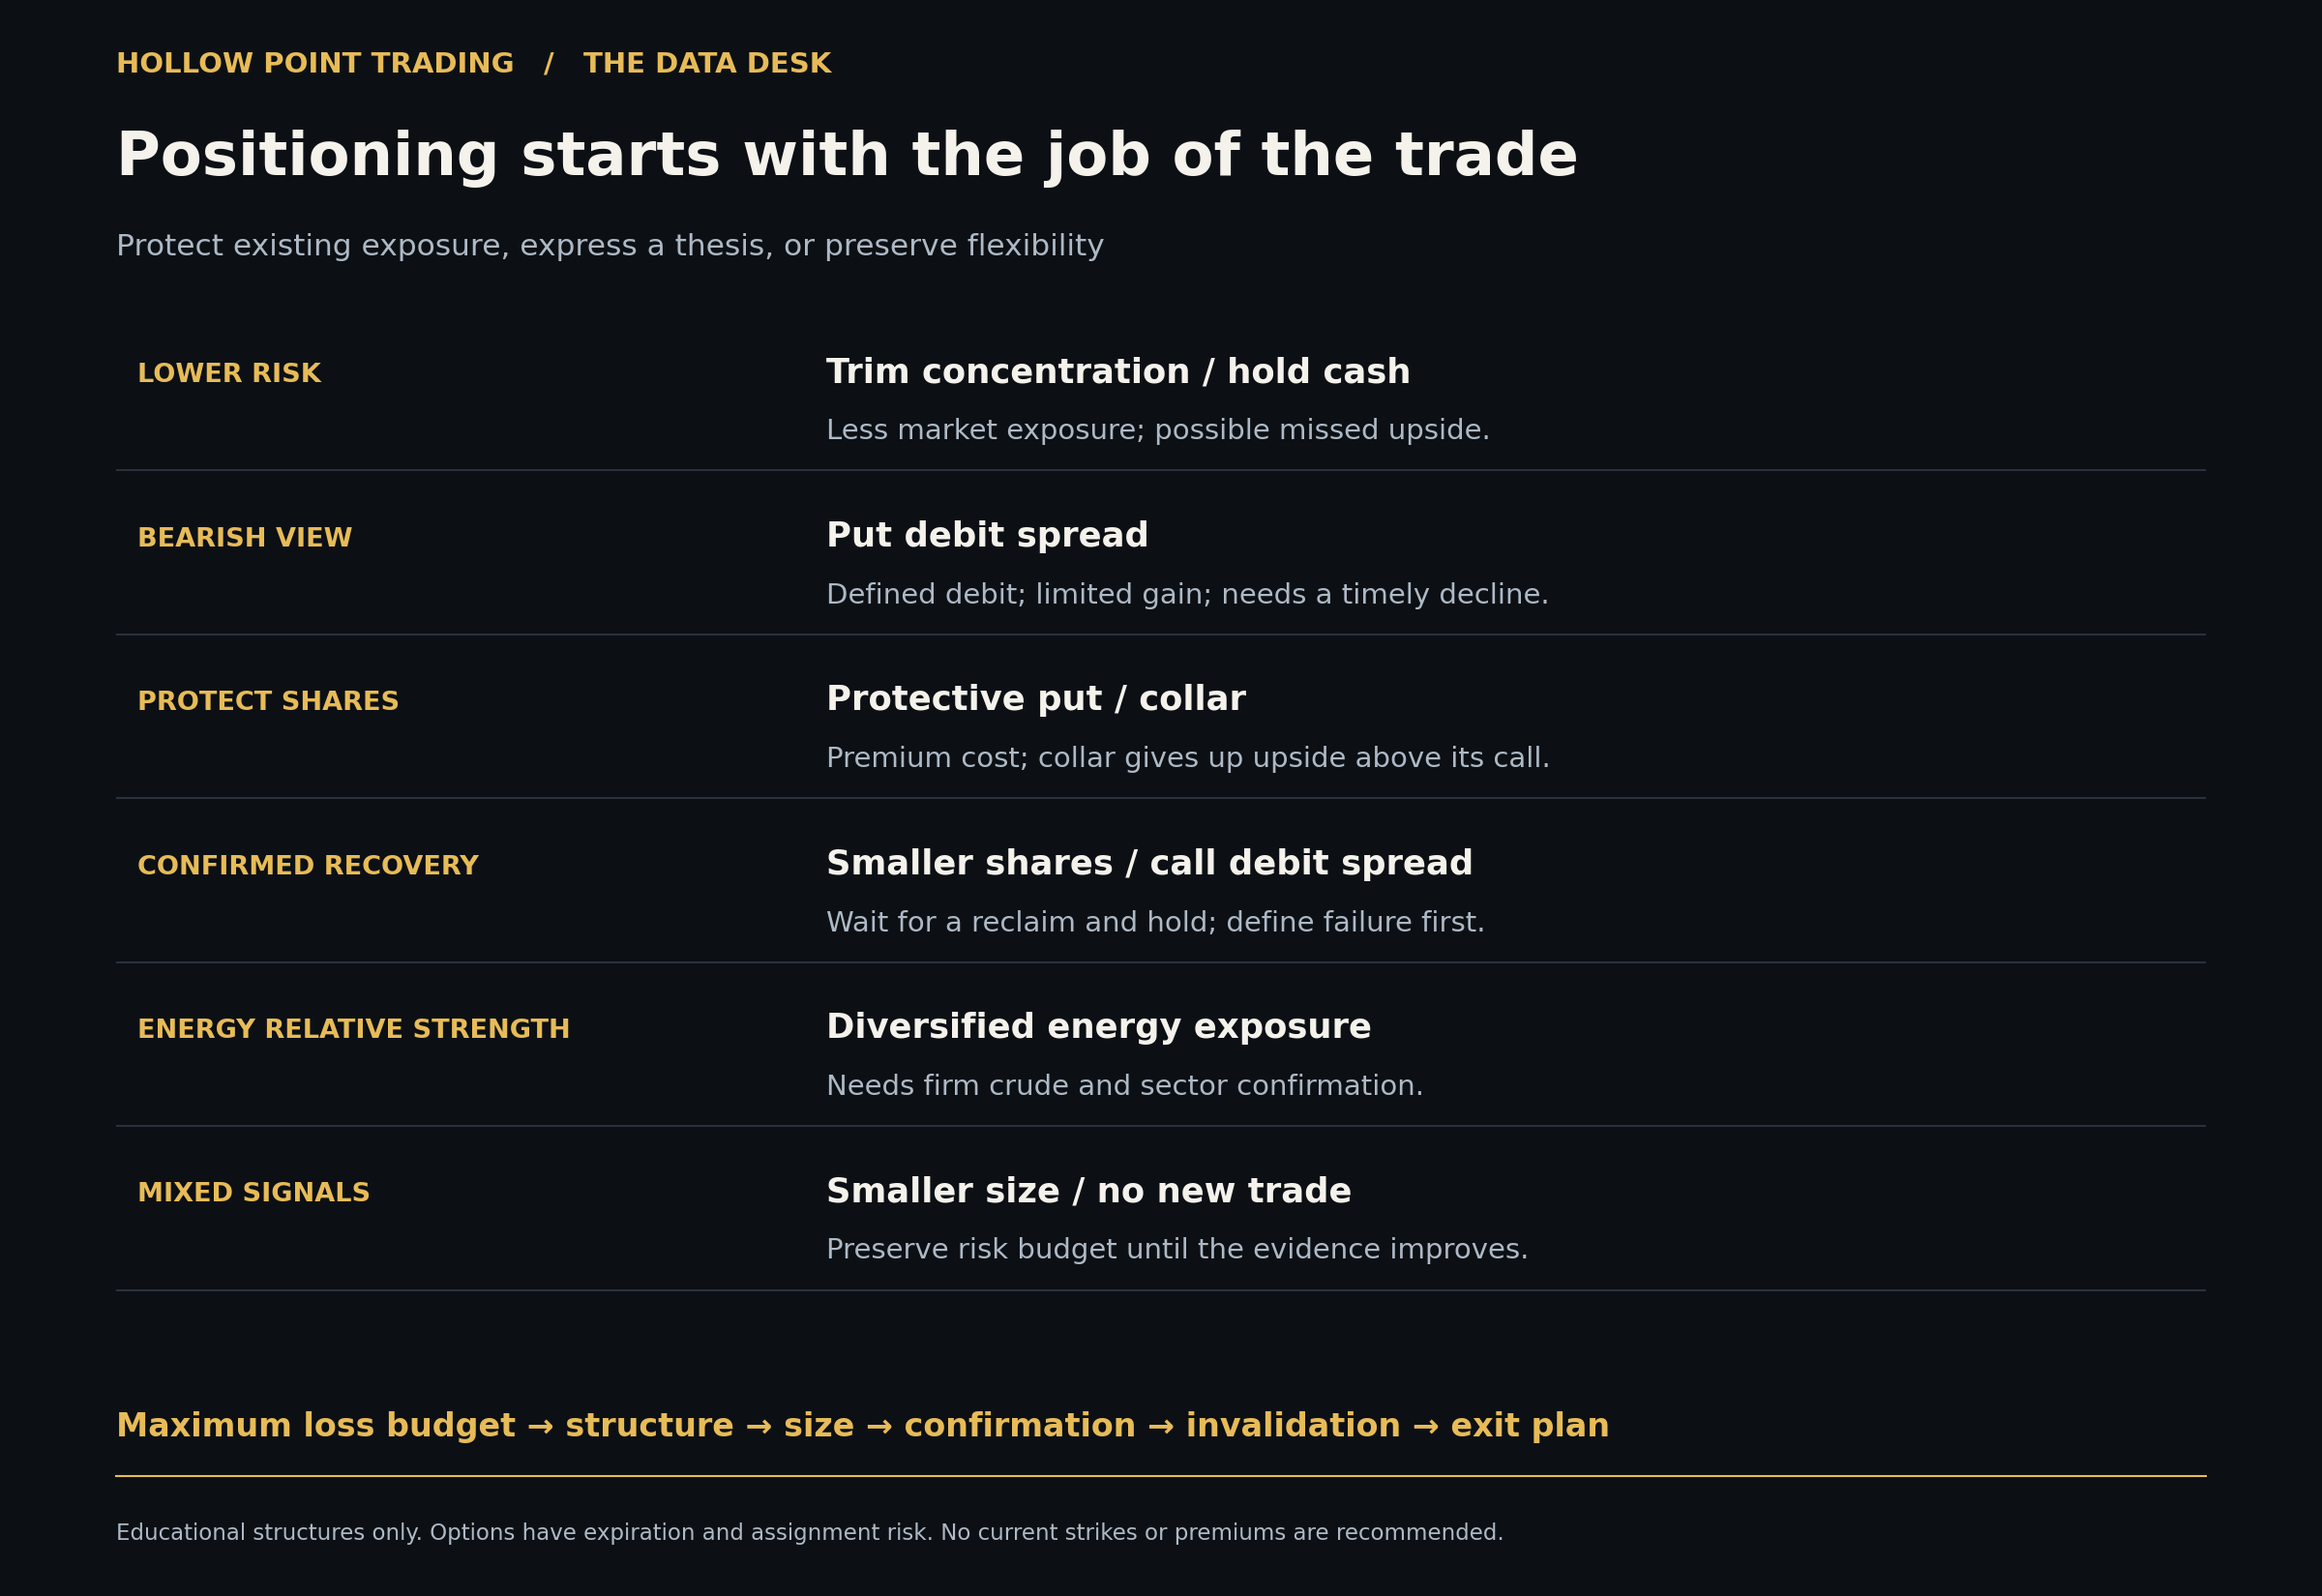
First decide whether you are protecting an existing portfolio or expressing a new directional view. The same put can be a hedge for one investor and a speculative bearish position for another. Your time horizon, existing exposure and acceptable loss determine which structure makes sense.
If the hot-inflation response persists: reducing oversized rate-sensitive exposure or holding more cash is the simplest way to lower risk. For experienced options traders, a QQQ or SPY put debit spread can express a bearish view with a defined initial debit. Buy the higher-strike put and sell the lower-strike put with the same expiration. Both potential gain and loss are capped under the standard spread payoff, but short-option assignment and expiration require management. The bearish thesis weakens if yields reverse lower and price reclaims and holds the breakdown area.
If you want to stay invested but reduce downside: a protective put on shares you own can establish a floor through expiration, less the premium and costs. An index put used against a different portfolio is only an approximate hedge: its holdings and sensitivity may not match yours. Protection costs money and expires; a collar can reduce premium outlay by selling a call, but gives up upside above that strike.
If the market absorbs the report: wait for yields to ease and price to reclaim and hold the release or opening range. A smaller share position or call debit spread can express recovery without assuming the first green candle has resolved the risk. A renewed failure of that reclaimed level invalidates the setup. A call spread limits both loss to the debit and upside to the strike width less that debit, subject to execution and assignment management.
If energy remains the driver: consider relative strength in a diversified energy vehicle such as XLE before choosing a single producer. The evidence should be firm crude prices and sustained sector participation. Buying energy solely because last month’s gasoline CPI rose mistakes a lagging statistic for a fresh entry signal.
If the signals disagree: stay smaller or wait. Cash removes equity price exposure for that portion of the account, although inflation still erodes its purchasing power. Short Treasury bills have less rate sensitivity than long-duration bonds, but neither a bond fund nor a TIPS fund is automatically protected from a near-term rise in real yields.
A position-sizing example, not a current trade quote: suppose a hypothetical 5-point-wide put debit spread costs $2.00 per share. With a standard 100-share multiplier, the debit is $200 per spread and the maximum expiration gain is $300 before fees. If the maximum acceptable loss for this idea is $400, two spreads use that entire budget before fees; fees would require reducing size or increasing the stated budget. Choose the budget first. Do not start with a contract count and discover the risk afterward.
A correct bearish view can still lose money in a long put if the move is too small, too late, or implied volatility falls. Debit spreads reduce some premium exposure but do not eliminate timing or volatility risk. Same-day options leave very little room for the thesis to develop. Leveraged inverse ETFs reset exposure regularly, often daily, so their multi-day results can diverge materially from a simple inverse of the index.
Strategy references: Options Industry Council: bear put spreads; OIC: protective puts; SEC: leveraged and inverse ETF risks; Investor.gov: bonds and TIPS.
Position around a confirmed response, a time horizon and a maximum loss. Hot CPI creates a risk to evaluate; it does not provide a guaranteed direction.
What comes next
September PPI is scheduled for Thursday, October 15 at 7:30 a.m. Central. It will add evidence about producer-side price pressure. PPI and CPI cover different baskets and stages of pricing; one does not translate one-for-one into the other. Import and export prices follow on October 16, also at 7:30 a.m. Central.
The next questions are whether energy pressure persists, whether underlying services and goods keep firming, and whether income and spending can absorb the squeeze.
The takeaway from this release: the headline shock was largely anticipated, but core inflation did not deliver the cooling economists expected. The household squeeze is measurable. The next market decision comes from how rates, breadth and price respond to that information.
Calendar source: BLS 2026 release schedule.
Educational market commentary, not personalized investment advice. All data refer to September 2026 unless otherwise stated. Monthly CPI figures cited here are seasonally adjusted; annual CPI changes are unadjusted. Forecast comparisons use the cited Reuters survey. Market scenarios are HPT analysis, not reported live price action.