
A coffeehouse can keep serving customers while its sales leave a parent company’s consolidated revenue line. The economic relationship has changed: owning and operating the shop is different from licensing a brand and holding a share of a joint venture. Starbucks provides a concrete example of why a smaller revenue total and a higher percentage margin can arrive together without either number settling the health of the stores.
Hollow Point Trading’s October 3, 2026, 3:30 p.m. Central edition is being prepared after its scheduled slot. It is Saturday; U.S. equity markets are closed. The chart was captured anew from the completed October 2 daily bar. The company evidence is the July fiscal-third-quarter disclosure, covering the period ended June 28. This is a weekend review of historical reporting, not a fresh October earnings announcement.
Macro — The customer’s purchase and the investor’s revenue line have different boundaries
Consumer spending reaches a restaurant business through visits, the amount spent per visit and the cost of serving those visits. Ownership determines how that activity appears in the investor’s accounts. A company-operated store brings its sales and associated expenses into the parent’s statements. A licensed relationship can produce a narrower revenue stream even though the customer still buys a drink at the same branded counter.
This distinction matters when comparing businesses across borders. An expanding store network does not automatically imply that every sale is recorded as parent-company revenue. Local ownership, contractual arrangements and equity interests affect the route from customer spending to reported earnings. Before assigning a macro interpretation to a revenue decline, ask whether the reporting perimeter remained comparable.
A broad claim about consumer weakness would require demand evidence. A broad claim about efficiency would require operating evidence. A change in the perimeter can affect both revenue and the margin denominator without supplying either conclusion. The useful macro habit is to trace the route of the money, then ask what changed along that route.
Fundamental — China moved into a licensed joint venture
Starbucks’ June-quarter Form 10-Q says Boyu-managed funds acquired 60% of its China retail operation, with Starbucks retaining 40% and licensing its brand and intellectual property. The transaction closed March 30. Starbucks deconsolidated the operation and began recognizing its share of joint-venture income under the equity method. The filing expects the licensed model to produce lower revenue and higher operating margin than the former company-operated model.
The filing’s company-operated revenue bridge attributes a $776 million reduction to the China conversion. That is a disclosed contribution to the historical comparison, not a measure of lost customer spending. It identifies where the scope change affected Starbucks’ own revenue line. It does not establish that the same amount vanished from the stores’ sales.
A percentage can improve while profit dollars decline
The July 29 earnings release reports International segment revenue of $1,322.6 million versus $2,010.7 million, down 34%. Operating income was $252.8 million versus $272.7 million, down 7%. Operating margin rose to 19.1% from 13.6%. Starbucks principally attributes the revenue decline and margin expansion to the China model conversion, with higher restructuring costs partly offsetting the margin effect.
Put the dollar result beside the ratio. The segment earned fewer operating-profit dollars in that comparison while reporting a higher margin. The two observations are compatible because revenue fell faster than operating income. Calling the higher ratio an across-the-board improvement would overlook the numerator; calling the revenue decline an equally large demand collapse would overlook the scope change.
For an original teaching exercise, imagine a fictional operator with 100 units of revenue, 85 units of operating costs and 15 units of profit. After a model change, suppose it records 60 units of revenue, 48 units of costs and 12 units of profit. Margin rises from 15% to 20%, while profit falls from 15 to 12. These invented units are not Starbucks estimates. They show how a ratio and a dollar amount can move in opposite directions.
The exercise does not prove a licensing model is better or worse. It shows why the evaluation needs additional questions: what capital remains committed, what obligations remain, how dependable are the new income streams, and how much profit reaches the shareholder? A smaller accounting perimeter changes the comparison. It does not eliminate the need to assess the business inside the new perimeter.
Build the next comparison around the new model
At the next official disclosure, compare like periods and read any explanation of the continuing conversion effect. Seek evidence about the joint venture, royalties and related sales without adding a store’s gross customer sales to parent revenue as if they were interchangeable. A constructive business scenario would pair durable customer activity with profitable income streams under the new relationship. An adverse scenario could show weak activity or disappointing economics despite an optically higher margin.
These are analytical conditions, not reported fourth-quarter results. The cited material establishes the historical transaction and comparison; this edition does not provide an unverified future earnings date or estimate the venture’s next contribution. Any forward-looking statement about the model remains an expectation until subsequent results support it.
Technical — The daily decline remains beneath the $100 area
The fresh TradingView image shows the NASDAQ-listed stock on the Cboe One feed, internally BATS:SBUX. October 2 opened at $95.08, reached $95.29, traded down to $94.27 and closed at $94.71, down 0.18%. The established 55-day EMA reads $100.50. RSI(14), the only lower panel, is 35.00. These are historical, feed-specific observations with the market closed.
The focused September–October frame shows a declining average and a pronounced retreat from above $105. Recent small candles are gathering near the lower end of the visible move. That can be described as an attempt to stabilize, but it has not repaired the distance to the average. The chart’s $100 line is a round-number reference close to the EMA, rather than a promise of resistance or a valuation estimate.
Bull scenario: accepting above Friday’s $95.29 high and holding a subsequent test would improve the immediate range. A larger recovery would then need evidence around $100 and the updated 55-day EMA, currently $100.50. Failure back below a reclaimed boundary would invalidate that specific recovery premise. A one-bar advance alone would not reverse the whole visible decline.
Base scenario: continued trade between $94.27 and $95.29 would leave Friday’s small range unresolved. A pause can slow a decline without establishing a new uptrend. The next daily bars would need to show whether the pause builds a held base or simply interrupts selling.
Bear scenario: losing $94.27 and failing to regain it would invalidate stabilization anchored to Friday’s low. The captured frame does not justify inventing a precise lower support or guaranteed target. A sustained reclaim of the broken boundary would weaken that breakdown interpretation. RSI below 50 describes momentum; it supplies no timer for a bottom.
Risk — A cleaner comparison does not create an executable trade
The reopening session can gap across a planned trigger or invalidation. A daily candle compresses intraday paths and cannot measure an options spread, implied volatility or time decay. Licensing economics and daily share-price behavior have different evidence clocks. This chart cannot establish that the China conversion caused Friday’s decline, and a sound accounting explanation does not guarantee a favorable trading result.
This is educational research. No HPT holding, executed order, prescribed position size or realized return is asserted. A change in accounting scope needs a comparable business question, while a price recovery needs new evidence from the next session.
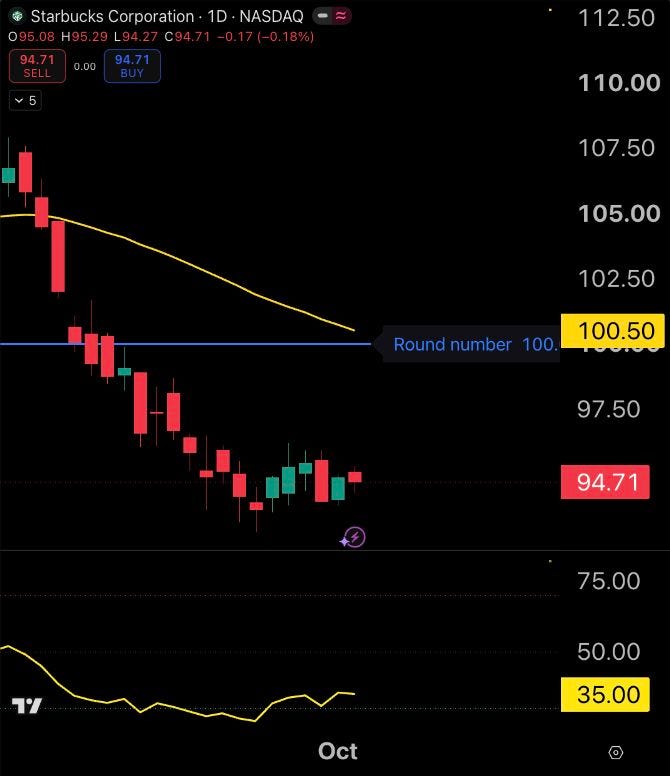
Source: genuine TradingView publisher-owned HPT Daily Articles Sep30 chart; requested NASDAQ:SBUX, observed BATS:SBUX / NASDAQ by Cboe One, daily (1D). Captured October 3, 2026 at approximately 3:37 p.m. America/Chicago. Saturday equities closed; completed October 2 candle. Established 55-day EMA $100.50; RSI(14) 35.00 is the sole lower panel. Focused September–October historical frame, dividend-adjusted feed; the $100 line is a round-number reference. Static image cannot establish live weekend pricing, causation or execution; indicators change with later bars.
Sources and evidence limits
Starbucks fiscal Q3 Form 10-Q — quarter ended June 28, 2026, China divestiture and revenue bridge
Starbucks fiscal Q3 results — July 29, 2026, International segment table
The reported figures and transaction date are historical facts. Expected model effects are management expectations. The invented operator is a teaching illustration; future business and price cases are inference. Sources were checked anew October 3.
Discussion: What evidence would make Starbucks’ new China relationship economically convincing beyond the margin percentage, and which daily price failure would make you reject an SBUX stabilization scenario?