Point Blank: The Rebound Lost Some Lift Before the Open
November 18, 2026 • 05:13 CST TradingView continuous-futures sample • before the Wednesday U.S. cash open. The comparison to the 04:59 check is a sequence of observations, not a cash-market breadth measure.
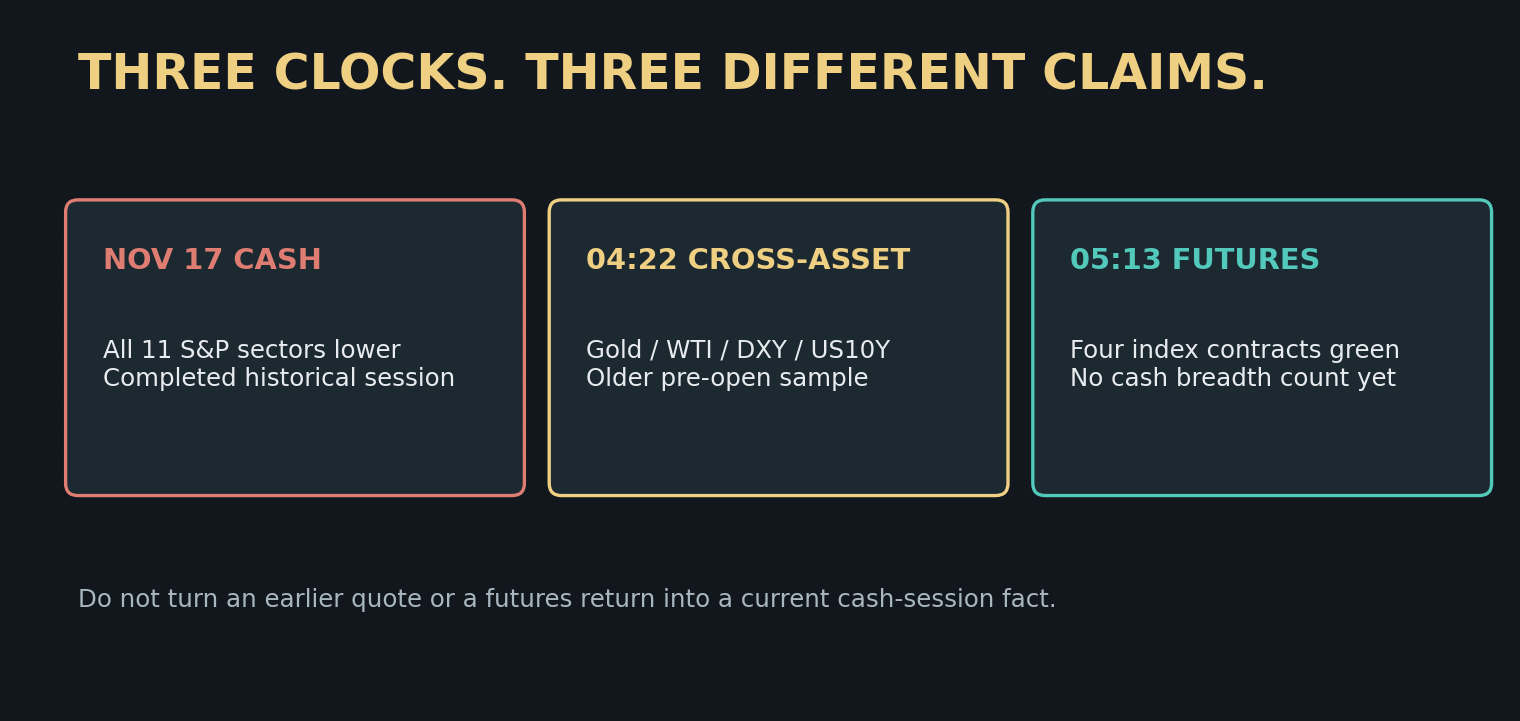
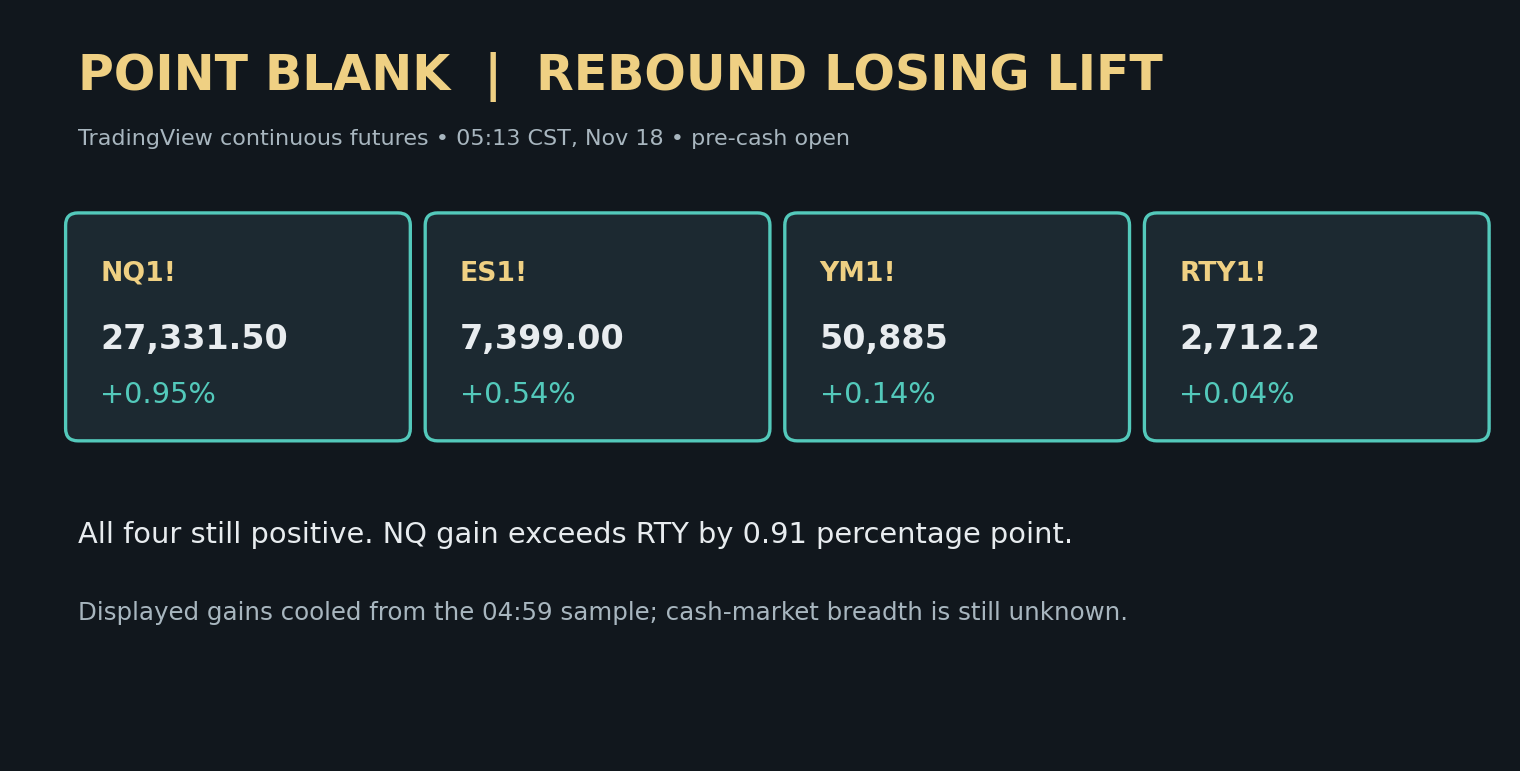
The four major U.S. index futures remained positive, but their displayed gains had cooled. At 05:13 CST, TradingView showed NQ1! near 27,331.50 (+0.95%), ES1! near 7,399.00 (+0.54%), YM1! near 50,885 (+0.14%) and RTY1! near 2,712.2 (+0.04%). At 04:59, the same pages showed roughly +1.20%, +0.65%, +0.26% and +0.17%, respectively. The subsequent change was negative in all four displayed percentage readings. That is a loss of pre-open momentum, even though it is not yet a negative session or evidence of cash-market selling.
Macro: why a positive print is not an open verdict
Tuesday’s completed U.S. cash session supplies the historical backdrop: the S&P 500 finished at 7,340.53 (−1.03%), Russell 2000 at 2,701.87 (−1.50%), VIX at 25.46 (+11.13%) and all eleven S&P sectors closed lower. Wednesday’s futures are a separate market and session. Their percentage changes cannot be translated into today’s advancing-stock count, equal-weight performance or sector participation. Nasdaq’s 05:13 displayed gain exceeded the Russell’s by 0.91 percentage point and the Dow’s by 0.81. That leadership gap leaves the broadening test unresolved.
The independently checked 04:22 CST cross-asset board was older than this futures sample: gold GC1! was near $3,771.4 per troy ounce (−2.40%), WTI crude CL1! near $83.22 per barrel (−3.24%), derived DXY 103.759 (+0.15%) and derived US10Y yield 5.087% (−0.022 percentage point). Those values are historical pre-open observations, not simultaneous 05:13 prices or proof of causality. Refresh them before making a live cross-asset comparison.
Fundamental: catalysts need their own timestamps
Nvidia’s November 17 investor release reported fiscal third-quarter revenue of $115.8 billion and Data Center revenue of $107.6 billion. Those company results support an AI-infrastructure demand discussion, but one issuer’s revenue does not establish today’s broad-market participation. TJX scheduled fiscal third-quarter results for November 18 before 9:30 a.m. Eastern; the company investor overview had not shown those results at the earlier 04:59 CST check. Treat any later release as a new fact to verify, not as something implied by the pre-open board.
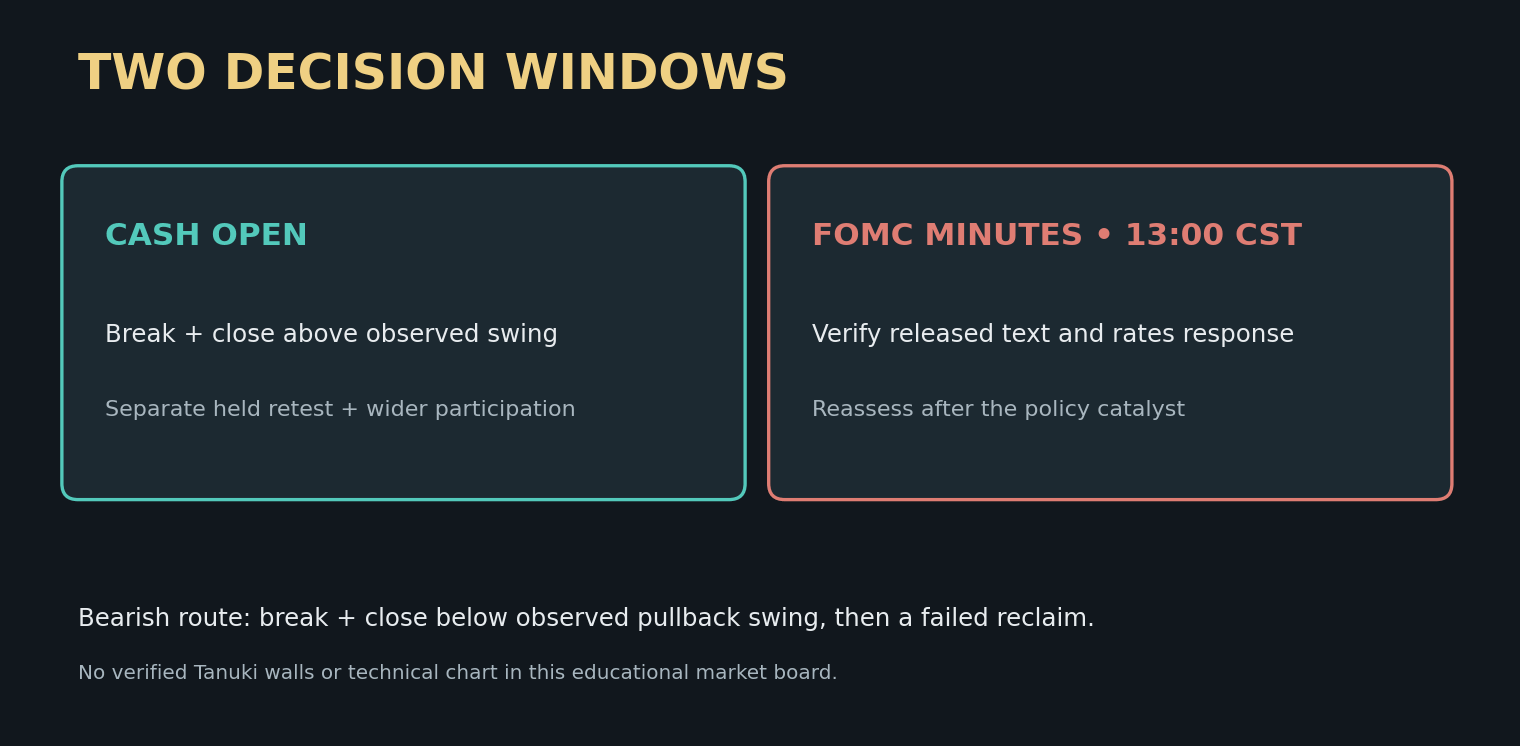
The Federal Reserve schedules its October 27–28 FOMC minutes for today at 2 p.m. Eastern / 1 p.m. Central. The minutes were unreleased at this cutoff. The first decision window is the cash open and its breadth; the minutes create a separate afternoon policy window. Their content and the market reaction remain unknown.
Technical route: demand proof of participation
My lean is neutral pending the open, with a modest constructive bias only while the four index futures remain positive. The cooling from 04:59 to 05:13 and Russell’s near-flat reading argue against upgrading the overnight rally from the futures board alone. A stronger bullish case would need a cash-session break and close above an observed opening swing on the selected instrument, then a separate held retest, while equal-weight and small-cap participation improves. If the first held retest fails, the local bullish case ends. A wider invalidation would be sustained movement back through the prior completed cash range rather than a single intrabar probe.
The bearish case needs a break and close below a verified opening pullback swing and a separate failed reclaim from underneath. A weak Russell while Nasdaq stays green would be a warning, but still not a completed bearish trigger. The two upside and two downside checkpoints, verified Tanuki put and call walls, exact expiry scope and a compliant native TradingView chart were not established for this original. These explanatory panels are not price charts; no six-level options map or named chart pattern is claimed.
Would a positive Nasdaq print still persuade you if the Russell and equal-weight market fail to participate after the cash open?
Sources and cutoffs: TradingView ES1!, NQ1!, YM1! and RTY1! continuous-futures overview pages at 05:13 CST November 18; the same source’s 04:59 CST comparison; older GC1!, CL1!, DXY and US10Y observation at 04:22 CST; completed November 17 HPT cash-sector/VIX record; Nvidia November 17 investor release; TJX investor overview at 04:59 CST; Federal Reserve November 18 calendar. No position or fill asserted.