Point Blank: Oil Rebounds Within a Down Day as Equity Futures Lose Some Cushion
November 18, 2026 • 05:37 CST TradingView continuous-futures sample • before the Wednesday U.S. cash open. Older comparison windows are identified separately. Refresh before acting on a live price.
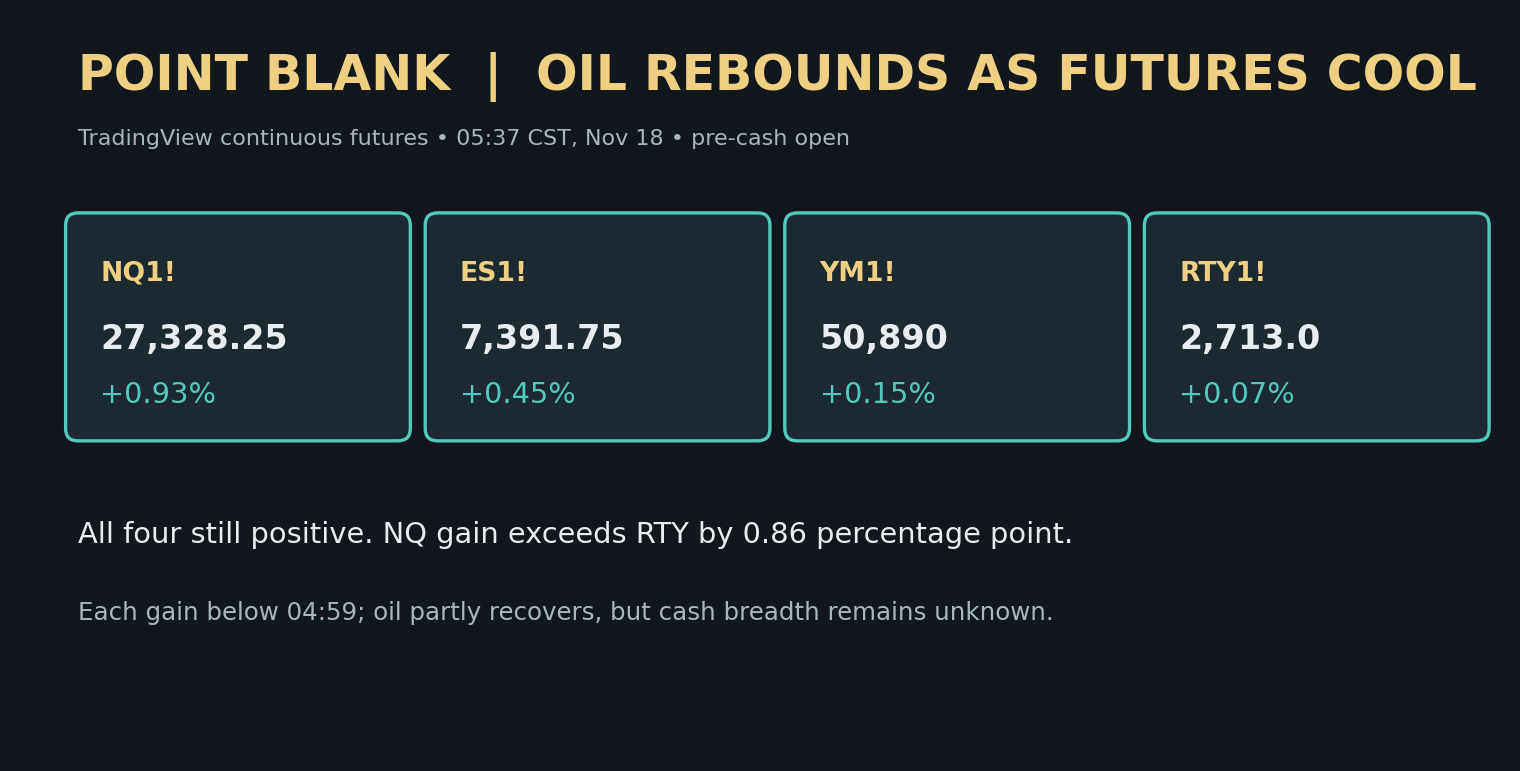
The early rebound has not vanished, but the pieces no longer line up as neatly as they did before five o’clock. At 05:37 CST, NQ1! was near 27,328.25 (+0.93% on TradingView’s displayed daily comparison), ES1! near 7,391.75 (+0.45%), YM1! near 50,890 (+0.15%) and RTY1! near 2,713.0 (+0.07%). All four still showed positive returns. The Nasdaq gain was 0.86 percentage point above the Russell gain; a green futures board is therefore a leadership observation, not proof of broad participation in today’s cash stocks. Compared with the earlier 04:59 readings of +1.20%, +0.65%, +0.26% and +0.17%, respectively, each gain was smaller at this later sample. There have been interim fluctuations, so those two endpoints describe a net change, not a claim of uninterrupted selling.
Macro: crude’s partial rebound changes the cross-asset question
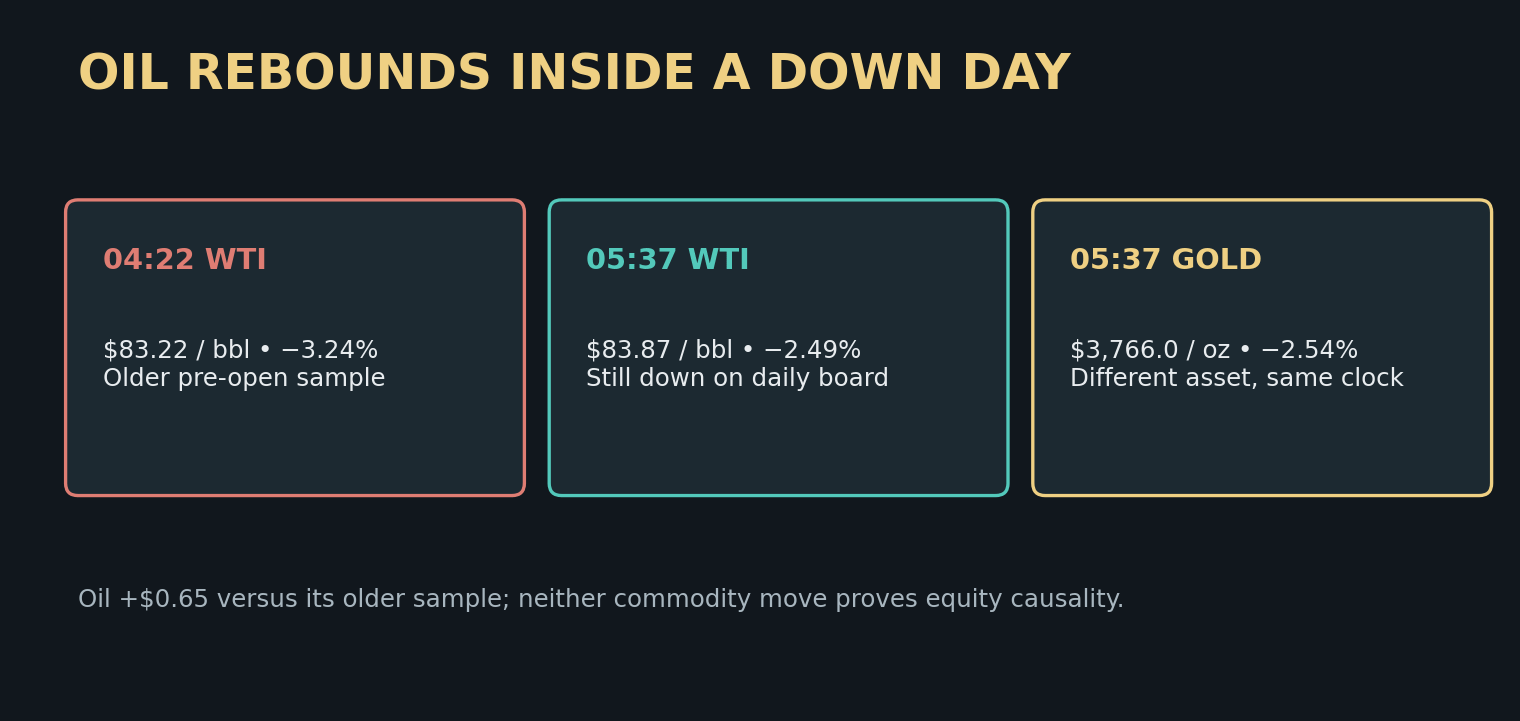
The completed Tuesday cash session remains the historical baseline: the S&P 500 closed at 7,340.53 (−1.03%), Russell 2000 at 2,701.87 (−1.50%), VIX at 25.46 (+11.13%) and all eleven S&P sectors declined. Wednesday’s premarket futures are a separate session. The earlier 04:22 CST cross-asset check showed WTI CL1! near $83.22 a barrel (−3.24%) and gold GC1! near $3,771.4 per troy ounce (−2.40%). At 05:37 CST, a new TradingView sample showed CL1! near $83.87 (−2.49%) and GC1! near $3,766.0 (−2.54%). Oil had recovered $0.65 from that older quote while remaining down on its displayed daily comparison; gold was $5.4 lower. Neither direction identifies the cause of the equity move. It does mean that an earlier sentence saying oil was simply extending its decline would now misdescribe the sequence.
The dollar and Treasury yield require their own clock. The latest independently checked values for this package remain the 04:22 derived DXY reading of 103.759 (+0.15%) and derived ten-year U.S. yield of 5.087% (−0.022 percentage point). They are not simultaneous with the 05:37 futures and commodity samples. I will not infer a current rates or dollar impulse from those older values. The more useful open test is whether cash breadth and small-cap participation confirm the positive futures board.
Fundamental: a company catalyst is not an index vote
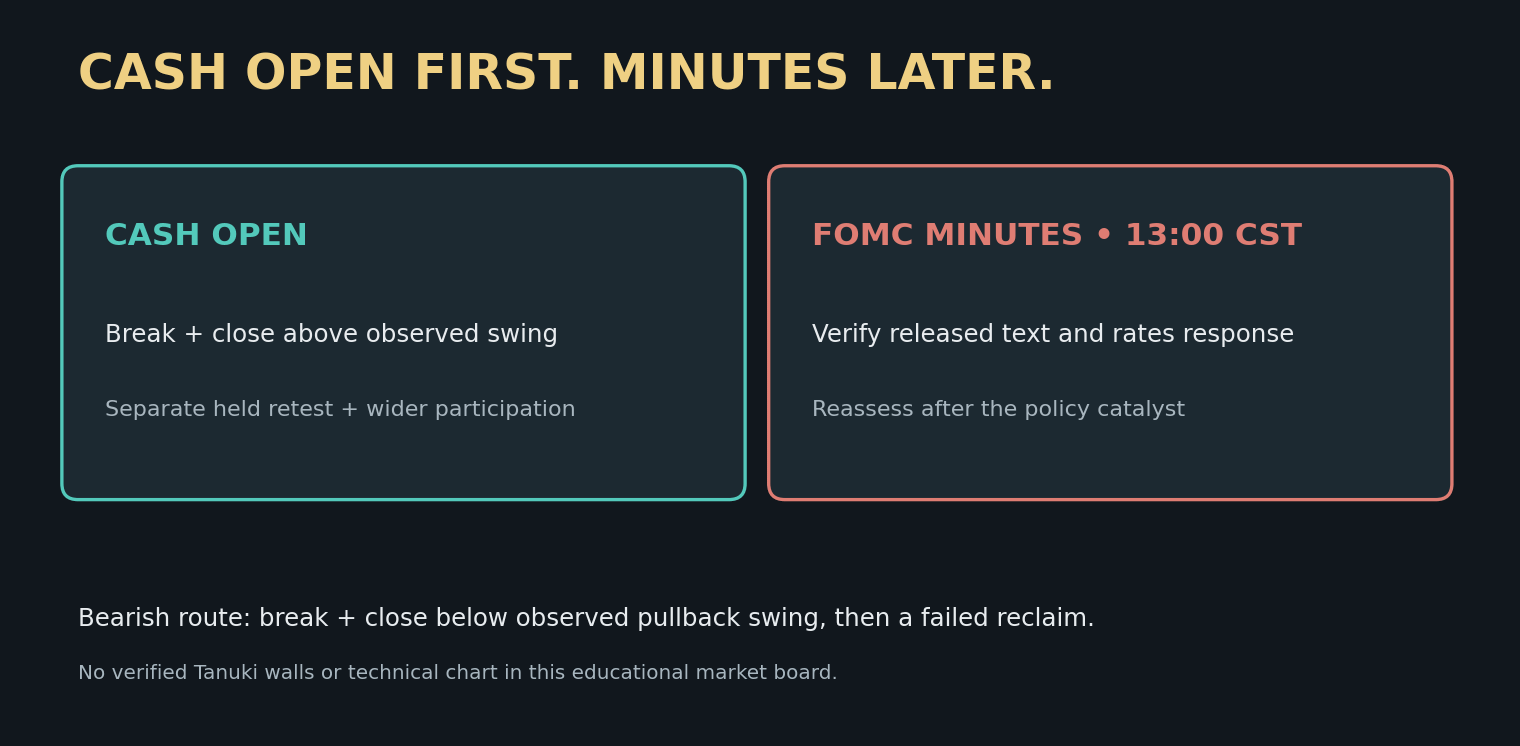
Nvidia’s November 17 investor release reported fiscal third-quarter revenue of $115.8 billion and Data Center revenue of $107.6 billion. Those are company-level results that support an AI infrastructure demand discussion, but they do not establish that the average U.S. stock has recovered. TJX separately scheduled its fiscal third-quarter release for November 18 before 9:30 a.m. Eastern. The latest company page checked during the prior pre-open research still showed its older fiscal Q2 information; any newly released Q3 result needs a fresh check before it is cited. The Federal Reserve schedules the October 27–28 FOMC minutes for 2 p.m. Eastern / 1 p.m. Central today. At this early cutoff, their contents and the market response are unknown. The cash open and afternoon policy release are separate event windows.
Technical route: defend the rebound with a cash-session retest
My lean is neutral pending cash-market confirmation, with a mild constructive bias while all four index futures remain positive. The shrinking percentage cushion and narrow Nasdaq lead keep me from calling the recovery broadly repaired. For the bullish case on a selected liquid index instrument, first observe a cash-session break and close above an independently established opening swing; then demand a separate held retest with improving equal-weight and Russell participation. Failure of that held retest is the local invalidation. A sustained return through the prior completed cash range would challenge the wider recovery thesis.
For the bearish case, require a break and close below an observed pullback swing, then a failed reclaim from underneath. Russell weakness alone is a warning, not a complete signal. The two upside and two downside price checkpoints and verified Tanuki put and call walls with expiry scope were not established for this original. The accompanying panels summarize observed market and event clocks; they are not native price charts or a six-level gamma map. I am not claiming a chart pattern, Fibonacci anchors, or a current gamma regime without the required TradingView and Tanuki evidence.
What would convince you that the premarket rebound has become a real cash-market repair: breadth, a held index retest, or a stronger small-cap response?
*Sources and cutoffs: TradingView continuous futures NQ1!, ES1!, YM1!, RTY1!, GC1! and CL1! at 05:37 CST November 18, with older comparisons at 04:59 and 04:22 CST; completed November 17 HPT cash-sector/VIX record; Nvidia November 17 investor release; TJX investor overview from the prior pre-open check; Federal Reserve November 18 release calendar. Research and education only; no position, fill, or guaranteed outcome asserted.*