
November 18, 2026 • 04:35 CST TradingView continuous-futures sample • before the Wednesday U.S. cash open. Older observations are labeled separately.
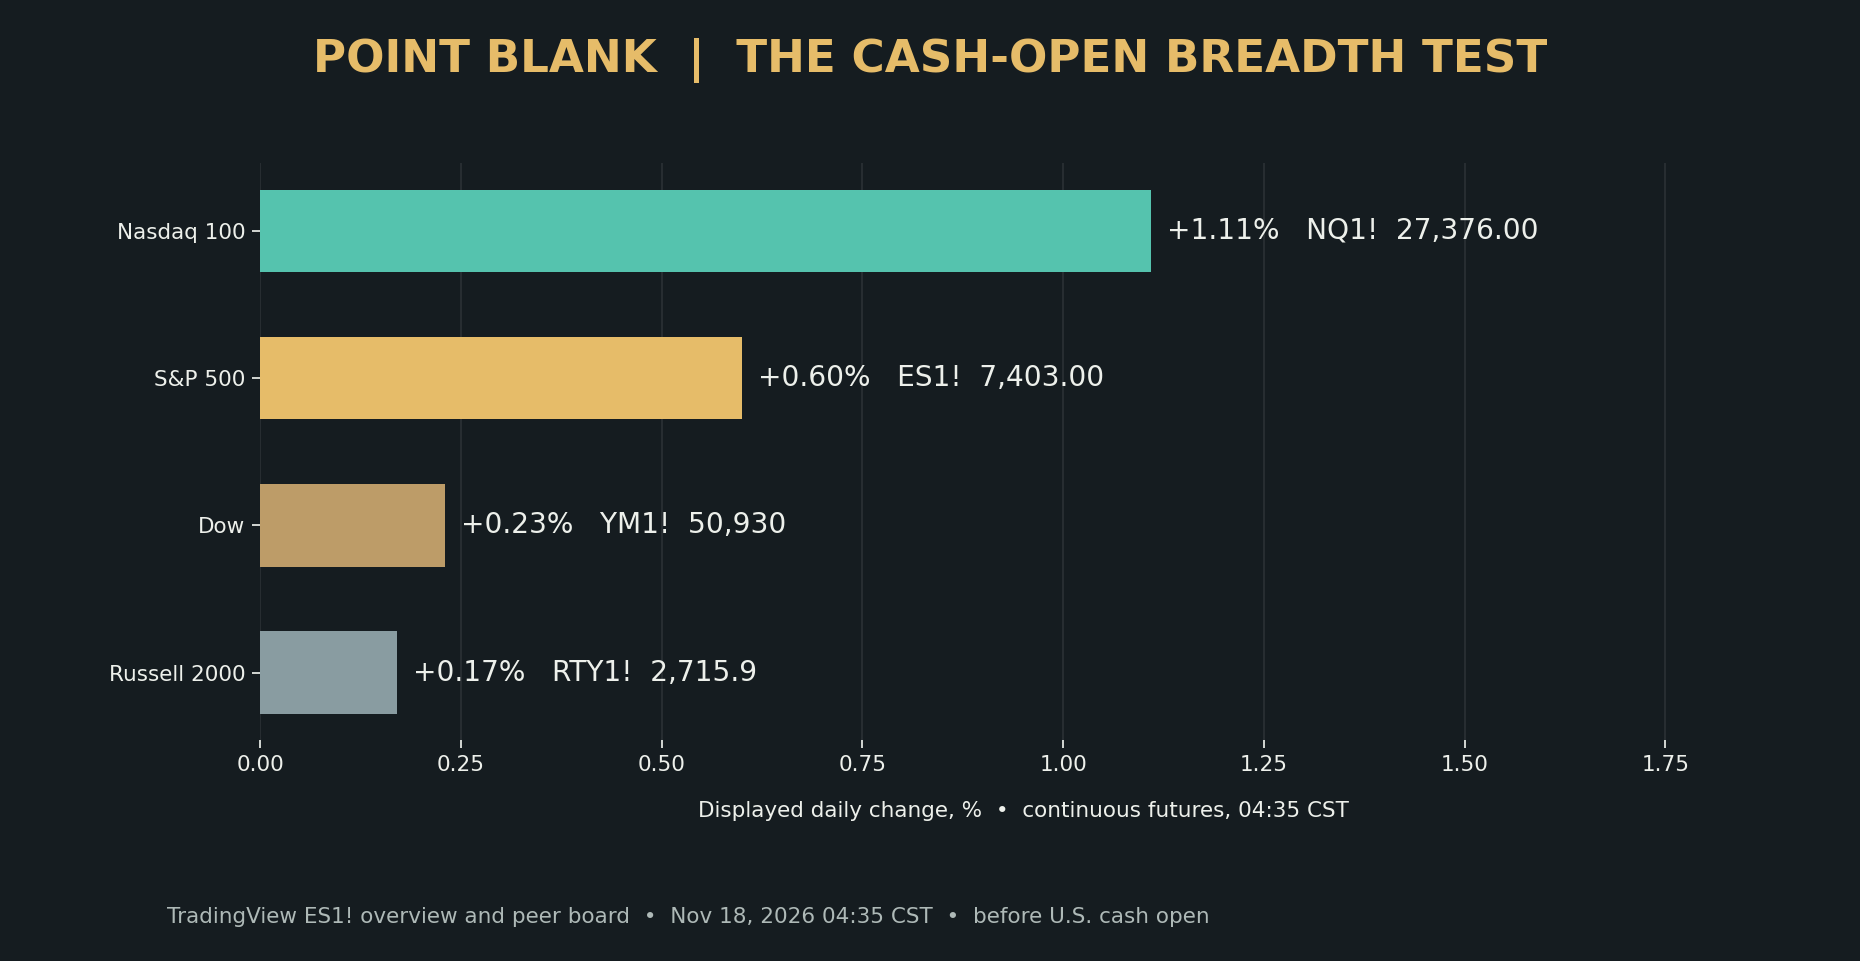
The overnight rebound is still intact, but the cash market has not voted on it. TradingView’s 04:35 CST board showed NQ1! at 27,376.00 (+1.11% on its displayed daily comparison), ES1! at 7,403.00 (+0.60%), YM1! at 50,930 (+0.23%), and RTY1! at 2,715.9 (+0.17%). All four were positive. Yet Nasdaq’s displayed gain exceeded the Russell’s by 0.94 percentage point and the Dow’s by 0.88 point. That concentration is the decision today: does the cash open broaden the bid, or does it reveal that a futures bounce was carried by a narrower group?
The 04:35 futures breadth test
Macro: keep the observation clocks separate
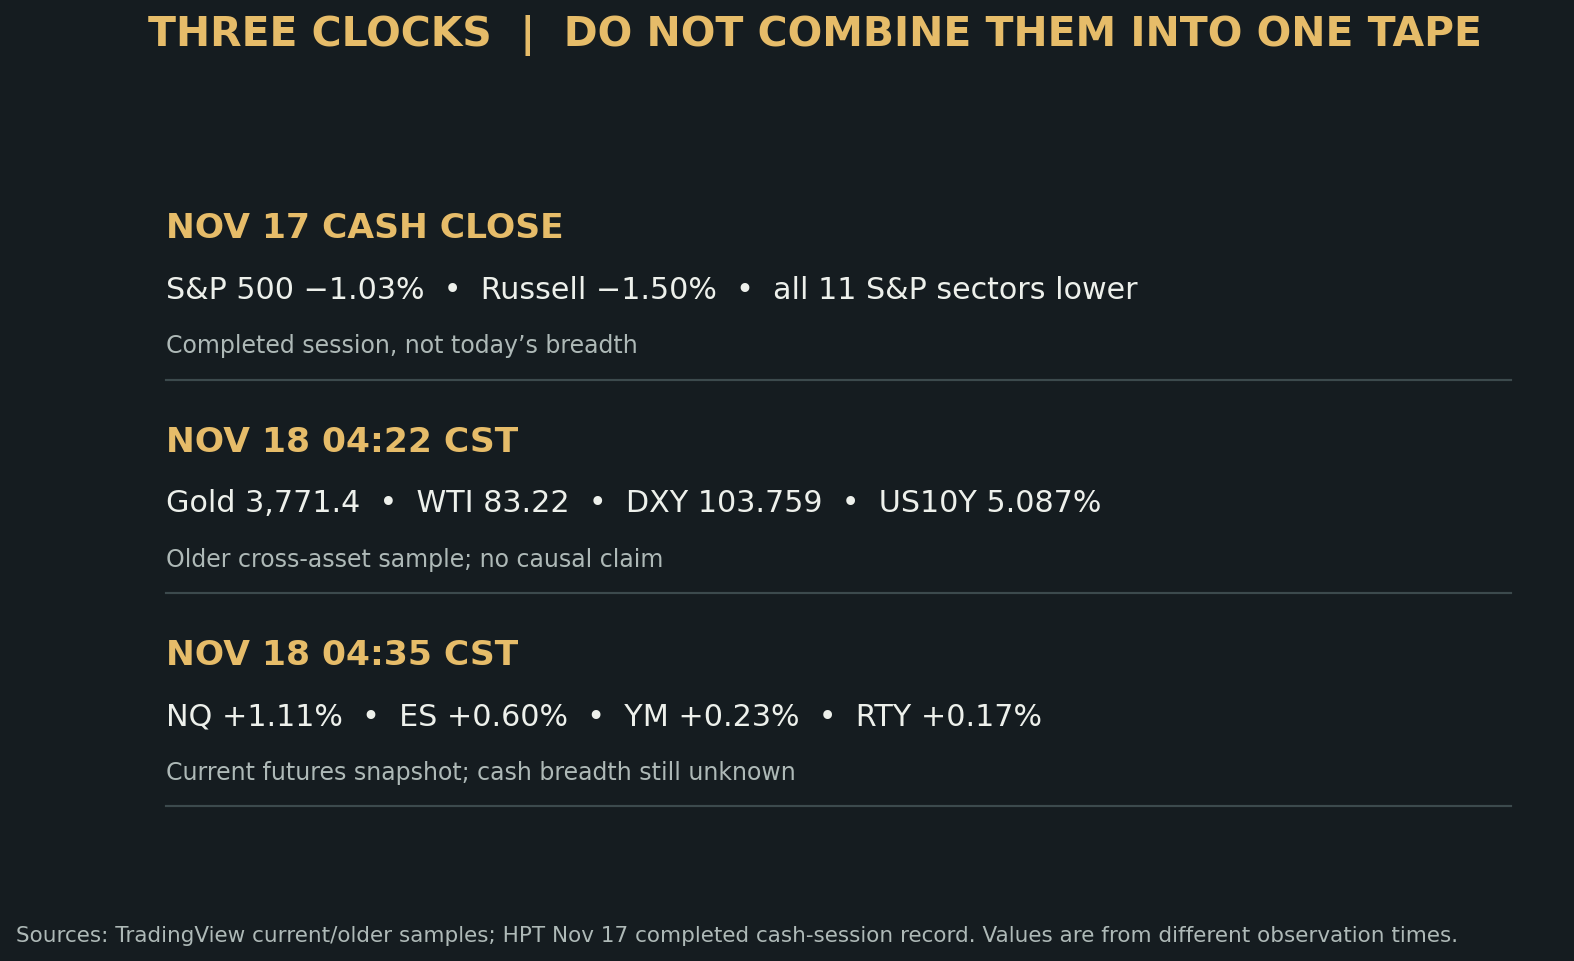
Tuesday’s completed cash session is the historical baseline. On November 17, the S&P 500 closed at 7,340.53 (−1.03%), the Russell 2000 at 2,701.87 (−1.50%), VIX at 25.46 (+11.13%), and all eleven S&P sectors finished lower. Those are prior-session facts, not Wednesday breadth. Today’s overnight futures quotes are a new session and cannot establish advancing-stock counts or sector participation at the cash open.
The most recent independently sampled cross-asset values are from 04:22 CST, thirteen minutes older than the equity-futures board. TradingView showed gold GC1! near $3,771.4 per troy ounce (−2.40% on that page) and WTI crude CL1! near $83.22 per barrel (−3.24%). Its derived DXY value was 103.759 (+0.15%) and derived US10Y yield 5.087% (−0.022 percentage point). These simultaneous directions do not prove what caused equities to rise. Refresh the different clocks before using them for an intraday decision.
Separate historical, cross-asset and futures clocks
Fundamental: leadership has a real catalyst, breadth still needs proof
Nvidia’s November 17 investor release reported fiscal third-quarter revenue of $115.8 billion, up 103% year over year, and Data Center revenue of $107.6 billion, up 110%. Its $130.0 billion fiscal fourth-quarter revenue outlook includes an extra week and assumes no Data Center compute revenue from China. That release is direct evidence of company-level AI infrastructure demand. It helps explain why technology leadership deserves attention, but does not prove that every index constituent, retailer or small company has improved. Today’s company-specific retail test also includes TJX’s scheduled fiscal Q3 results before 9:30 a.m. Eastern; those results had not appeared on its investor overview as of the prepublication check.
The Federal Reserve calendar schedules the October 27–28 FOMC minutes for November 18 at 2 p.m. Eastern / 1 p.m. Central. At this cutoff the minutes are unreleased. First comes the cash market’s breadth test, then a separate rate-policy event. The content of the minutes and the resulting market reaction remain unknown.
Technical route and risk
My lean remains cautiously constructive for the overnight rebound because all four sampled index futures are positive. It is conditional on broader participation after the open; Dow and Russell lag make a technology-only push less convincing. On a selected instrument and timeframe, the upside case needs a break and close above a verified rebound swing, followed by a separate held retest. The downside reversal needs a break and close below a verified pullback swing and a failed reclaim from underneath. Losing the immediate held retest ends the local bullish attempt. Sustained movement back through the wider prior cash range would challenge the broader rebound idea. No exact chart level or confirmed pattern is asserted here.
Conditional route through the cash open and minutes
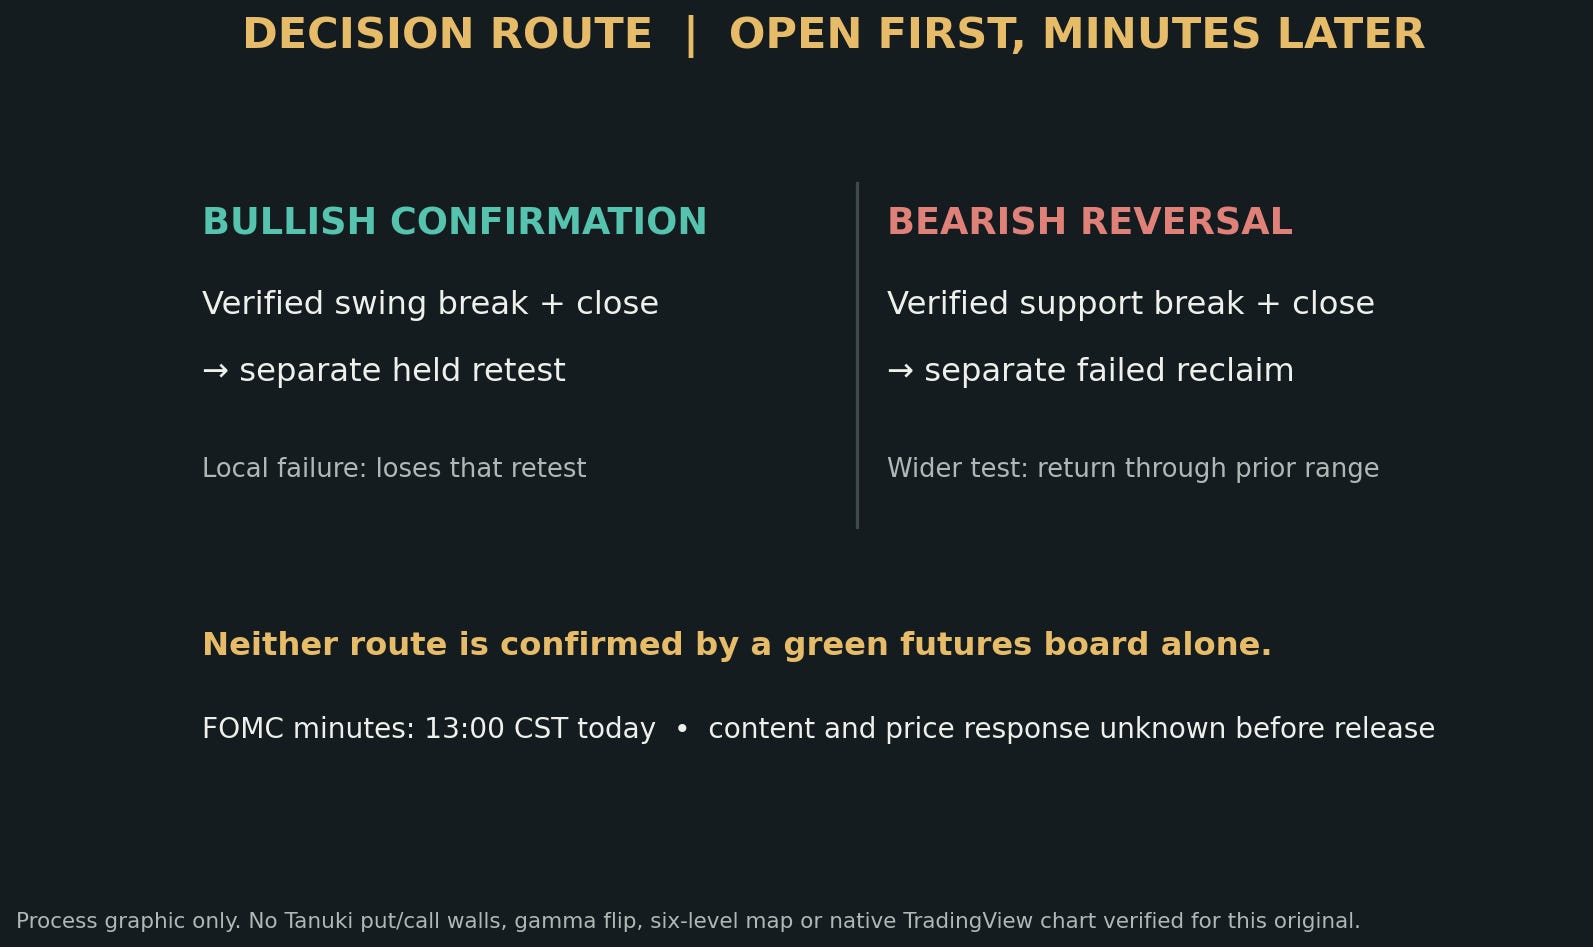
The required six-level technical map is unverified: authenticated Tanuki put and call walls with expiry scope, two upside and two downside checkpoints, and a compliant native TradingView chart were not established for this original. These three graphics explain the market decision; they are not native price charts or substitutes for options walls.
Would you upgrade the rebound only after wider cash breadth appears, or would the Nasdaq lead be enough for your framework?
*Sources and cutoffs:** TradingView ES1! overview and peer continuous-futures board at 04:35 CST November 18; separate GC1!, CL1!, DXY and US10Y sample at 04:22 CST; completed November 17 cash-sector/VIX HPT record; Nvidia November 17 investor release; TJX investor overview at 04:35 CST; Federal Reserve November 18 schedule. Research and education; no position, fill or guaranteed result claimed.