
Hollow Point Trading — October 3, 2026, 7:30 a.m. CT edition. This is Saturday weekend planning in the premarket-designated slot. U.S. equity markets are closed; the prices below belong to the completed October 2 daily bar, not a live Saturday session.
Before turning a streaming headline into a stock thesis, put three questions on the desk: how much time did customers spend watching, how much of that time could carry an advertisement, and how much did buyers actually pay for the available inventory? Those questions describe related businesses, but they do not produce interchangeable numbers. Netflix offers a useful case study because engagement, subscription economics and advertising can move at different speeds.
Macro: attention is a budget, advertising is a transaction
A household has a finite number of evening hours. A brand has a finite campaign budget. The two constraints meet on a streaming platform, but neither guarantees the other. A customer can watch more without an advertiser increasing its spending. An advertiser can pay more for a particular audience even when total viewing time barely changes. That is why a broad growth narrative needs a mechanism connecting customer behavior to commercial results.
For an advertising-supported business, the useful sequence runs from eligible viewing to available placements, then to filled placements and realized pricing. Each stage can change independently. Subscription revenue follows another path: customer count, plan mix, pricing and retention. Combining both paths into one vague “engagement is up” argument hides the assumptions an investor needs to test.
Economic conditions matter through those paths. Pressure on household budgets can influence subscription choices, while pressure on marketing budgets can affect demand for advertising. Neither relationship tells us Netflix’s actual current retention, advertising fill or pricing without company evidence. The macro lens is a checklist for what to investigate, not permission to invent an operating trend.
Fundamental: what the company reported, and what remains a forecast
Netflix’s July 16 Q2 shareholder letter reported revenue of $12.560 billion, up 13.4% year over year. It reported more than 97 billion viewing hours in the first half of 2026, up 2%. These are company-reported results for their stated periods; first-half engagement is not a Q3 advertising result.
The same letter projected about $3 billion in 2026 advertising revenue. It also expected live programming to represent just over 5% of content spending and roughly 1% of viewing hours in 2026. Those full-year expectations are guidance, not completed-year outcomes. They illustrate why a content category’s share of hours alone cannot establish its commercial value.
Netflix’s September 14 announcement scheduled Q3 results and outlook for October 20 at approximately 1:01 p.m. Pacific, or 3:01 p.m. CT. As of this edition, that release is an upcoming catalyst. We have not treated its unreported results as facts.
The teaching point: build the bridge before estimating revenue
Consider a deliberately fictional streaming service. It records 100 hours of viewing. Half occur on plans that permit advertising. Suppose those eligible hours offer two advertising opportunities per hour and three quarters of those opportunities are filled. That produces 75 filled opportunities: 100 × 50% × 2 × 75%. Multiplying all viewing hours by two would instead produce 200 and silently assume every hour is eligible and every placement sells.
This example is not a Netflix operating estimate, and a filled opportunity is not automatically a billable or independently verified impression. It simply exposes the missing variables. Actual measurement definitions, delivery verification, geography, contracts and pricing would still be necessary before estimating revenue. A calculation can be mathematically correct while its business inputs are unsupported.
For the October 20 release, the research task is therefore specific: look for disclosed advertising revenue progress, the distinction between achieved results and forward expectations, and evidence about subscription economics. If the company does not disclose a variable, leave it unknown. Do not reverse-engineer precise advertising impressions from an aggregate viewing-hours headline.
Technical: the daily chart shows damage below the old floor
The fresh publisher-owned TradingView capture uses daily candles and shows the July-to-October price structure. The completed October 2 bar reads open 67.60, high 67.87, low 66.75 and close 67.06. The established 55 EMA reads 75.46, and RSI, the only lower panel, reads 31.06. The chart is explicitly marked market closed.
The visible decline from the early-September peak has broken beneath the marked 70.11 swing-low reference. Price also sits below the 74.28 retracement level and the 75.46 EMA / 75.57 midpoint area. Those observations support a damaged daily structure. They do not establish the cause of the decline, and they do not prove that investors rejected any particular advertising metric.
RSI near 31 describes weak momentum in this captured window. It is not a timer for a rebound. Likewise, a fundamental growth projection cannot override a failed price reclaim. Keep the operating thesis and the trading trigger on separate lines of the worksheet.
Three scenarios for the next equity session
Recovery: a move back through 67.87 would clear the captured bar’s high, but the more meaningful repair is a sustained reclaim of 70.11. A brief touch followed by rejection leaves the old floor acting as overhead resistance. Only after that repair would 74.28 and the 75.46–75.57 area become relevant higher checkpoints. These are conditional references, not promised targets.
Stabilization: repeated trade between 66.75 and 67.87 could build a short-term balance. That would show the last bar’s range containing price, not automatically reverse the broader daily decline. The next question would be whether that balance resolves upward and holds, or simply pauses selling.
Continuation: a break below 66.75 followed by failure to regain it would invalidate this narrow stabilization scenario. The captured chart does not justify inventing a lower support number. An updated chart would be required to assess the next structure. A sustained reclaim of 70.11 would weaken the immediate bearish breakdown interpretation.
Risk: the catalyst and the chart operate on different clocks
The October 20 earnings event can change expectations and produce a gap that crosses several chart levels without orderly trading between them. Weekend closure adds another gap boundary before the next regular session. Option pricing, time decay and implied volatility create risks beyond the stock’s direction; a correct business argument does not guarantee a profitable option position.
These scenarios are educational planning references, not personalized advice or an instruction to enter a position. Define the condition that disproves a thesis before considering exposure. The useful habit is to demand both an evidence-based operating bridge and a current, observable price trigger
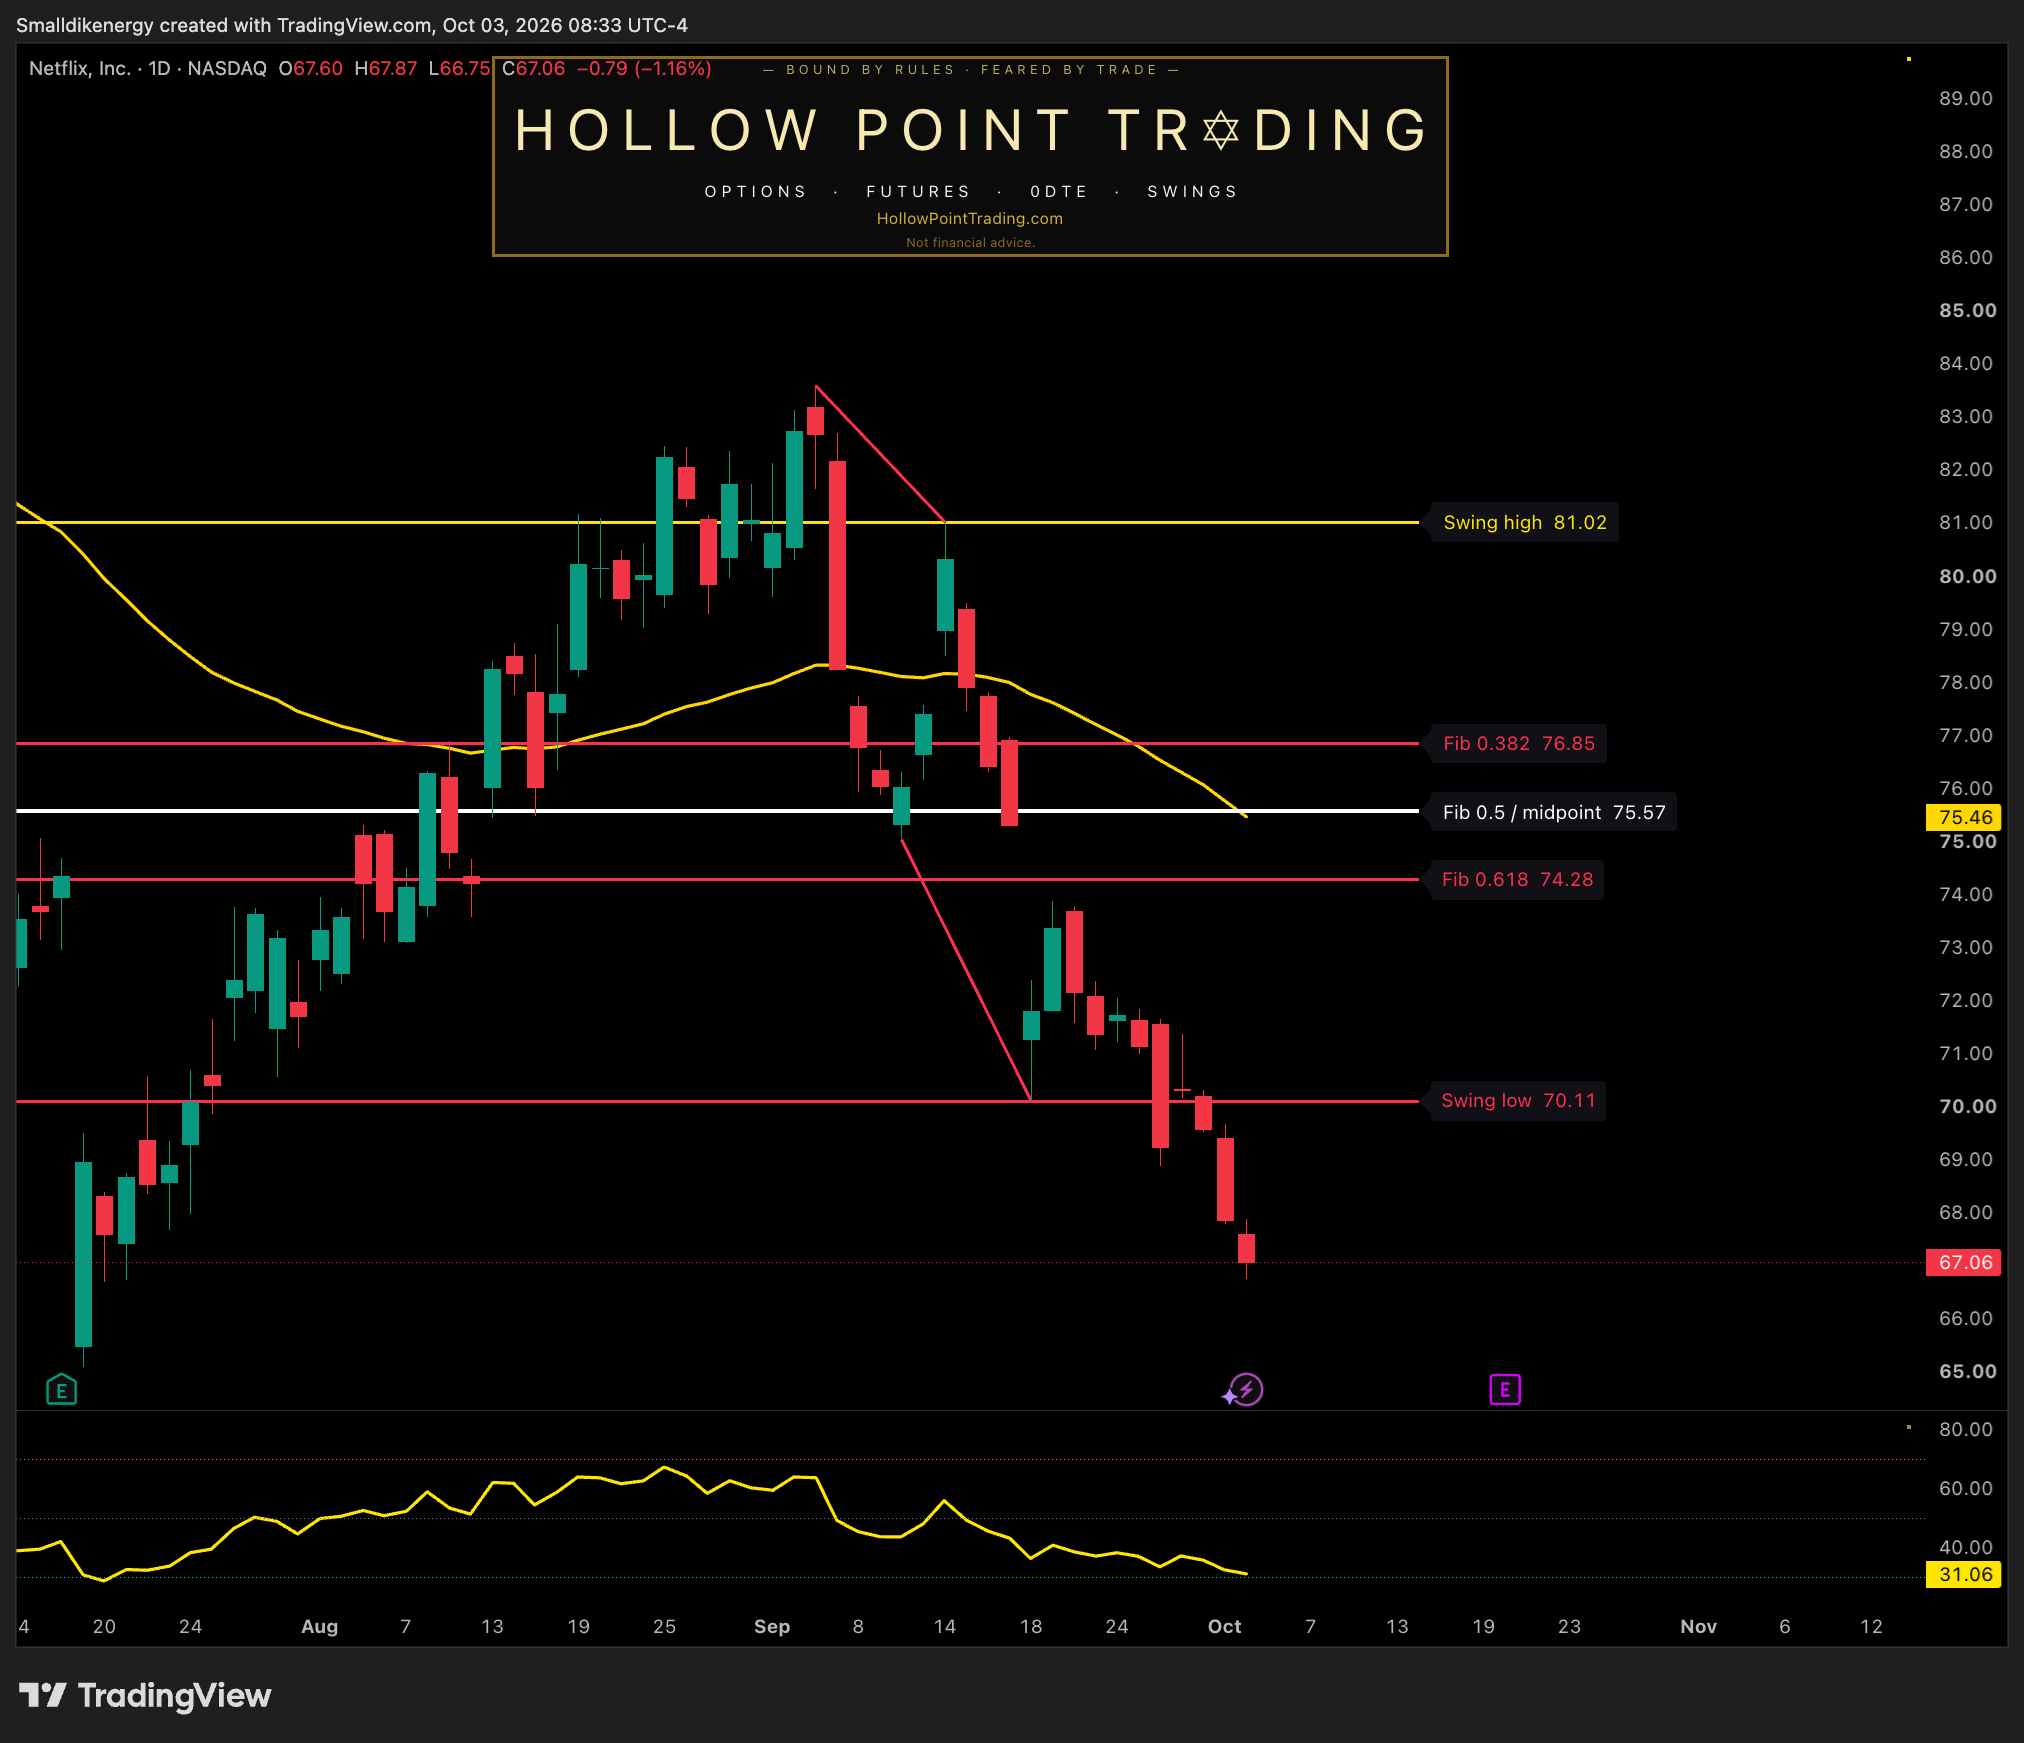
Source: TradingView, publisher-owned HPT Daily Articles Sep30 chart, captured October 3, 2026 at 7:33:45 a.m. CT (8:33 a.m. EDT). Requested NASDAQ:NFLX; observed BATS:NFLX / NASDAQ by Cboe One, 1D. Completed October 2 bar; market closed on Saturday. Gold 55 EMA; RSI is the sole lower panel. Feed, adjustment and drawing choices can differ from other displays; chart levels are conditional references and this is not live Saturday pricing.
Sources and evidence limits
Netflix Q2 2026 shareholder letter, July 16, 2026 — reported results and explicitly labeled full-year expectations.
Netflix Q3 results announcement, September 14, 2026 — upcoming October 20 release schedule.
Sources checked anew October 3, 2026. The hypothetical advertising worksheet is original teaching material, not company data. Technical observations come from the fresh chart; scenarios are inference, not forecasts of actual results.
Discussion: What disclosed evidence would you require to connect viewing growth to advertising revenue, and would a reclaim of 70.11 change your reading of the daily breakdown?