
A smaller capital-expenditure headline can look like relief for an expensive cloud buildout. Before treating it as an economic saving, ask whether the company is buying less capacity or counting an obligation differently. Microsoft’s announced change in building useful lives and future lease classification makes that distinction the center of this Sunday worksheet.
This October 4 edition studies the transition into fiscal 2027 using official disclosures checked this morning. U.S. equity markets are closed. The fresh daily TradingView capture ends with October 2’s completed candle. It is a framework for the next session, without a live Sunday price or a claim that the accounting announcement caused the stock’s subsequent advance.
Macro: Cloud capacity creates several clocks
Technology infrastructure starts with physical resources: buildings, power, cooling and computing equipment. A cloud service can earn revenue from customer usage while those resources have different construction schedules and economic lives. The sector’s investment question therefore extends beyond demand. It also asks when capacity becomes usable, how long it remains useful and when the related obligations consume cash.
The distinction matters when comparing businesses or periods. One company can own a site, another can lease it, and both can provide a service from it. A single spending measure may not represent those arrangements in the same way. Similar operational capacity does not guarantee similar reported capital expenditure, depreciation expense or payment timing.
For a weekend review, place three columns beside the investment thesis: physical capacity, reported expense and actual cash payments. A change in one column should be traced into the others before drawing a valuation conclusion. This is a research discipline, not a prediction about current interest rates, equipment prices or how much any customer will spend.
Fundamental: Microsoft identifies a change in classification
On its July 29 fiscal-fourth-quarter call, Microsoft said estimated useful lives for datacenters and office buildings would move from 15 to 25 years at the start of FY27. Management expected a minimal FY27 operating-income benefit and said more future datacenter leases would consequently shift from finance to operating classification. Its capex measure includes finance leases and excludes operating leases. The resulting calendar-2026 capex expectation was approximately $175 billion; management said investment expectations otherwise remained unchanged. These were announced estimates and guidance, not completed FY27 results.
The July 29 earnings release separately reports $90.0 billion of quarterly revenue and $40.6 billion of operating income for the period ended June 30. Those historical operating totals do not measure cash committed to future sites. Keep their period and scope separate from the calendar-year capex expectation.
My inference is narrow: a lower amount under that capex definition cannot, by itself, prove a smaller physical investment program. Whether financing costs, cash obligations or returns improve remains an additional question. The classification explanation deserves to sit beside the headline whenever the next report is compared with an older period.
The worksheet: Change the label, then check the economics
Consider an invented infrastructure program with 100 units of owned equipment and a new lease arrangement measured at 40 units. Suppose a simplified spending statistic includes both categories. Its total is 140. If the same arrangement falls outside the statistic after a classification change, the displayed total becomes 100. The 40-unit difference has not demonstrated that forty units of obligations disappeared. This illustration explains a definition boundary; it is not Microsoft’s accounting reconciliation or a forecast of its spending.
Depreciation creates a different timing exercise. Imagine an owned building with a depreciable amount of 300 units, no residual value and straight-line allocation. Fifteen years would allocate 20 units a year; twenty-five years would allocate 12. The annual expense changes by eight units in this simplified example, while the original purchase amount remains 300. An expense estimate and a cash purchase are different observations. Actual accounting depends on the asset, effective date and applicable rules.
Neither miniature example establishes misconduct, a financial benefit or a fair-value adjustment for MSFT. They explain why the analyst needs the reconciliation rather than a shortcut. A valid comparison should preserve what the measure includes, which assets changed and whether the contractual payments changed. If the published bridge is incomplete, leave the missing economic effect unknown.
For the next financial update, I would read the spending definitions, cash-flow statement, lease disclosures and capacity discussion together. No specific upcoming earnings date was verified for this edition, so none is asserted. July guidance remains guidance until later actual disclosures test it. The catalyst to watch is the first reported comparison under the updated treatment, with its definitions retained.
Technical: A summer dislocation now has a retest question
The fresh chart requests NASDAQ:MSFT and shows Microsoft through NASDAQ by Cboe One, observed as BATS:MSFT, on daily candles. October 2 opened at $519.39, reached $522.50, traded down to $513.66 and closed at $517.53. The established 55-day EMA reads $480.19. RSI(14), the only lower panel, reads 62.62. These are historical feed observations, not weekend execution prices.
The April-to-October frame shows the earlier lower range, a sharp late-July dislocation and subsequent consolidation above the rising average. The latest close is above the displayed $509.95 swing-high reference. That is a constructive local relationship, but the distance above the average also means an ordinary pullback can be sizable. The chart cannot tell us whether lease economics improved.
The bullish scenario needs future acceptance above Friday’s $522.50 high, then a pullback that holds the reclaimed area or the earlier $509.95 reference. Treat roughly $510 as a retest zone, not a penny-precise guarantee. A brief excursion over the high followed by rejection supplies less evidence than retained daily acceptance.
The base scenario is rotation around $510–$522.50 while the earlier breakout remains intact. A deeper test could reach the displayed selected-swing midpoint of $500.59, near the $500 round number. The control-candle midpoint at $517.51 has a different anchor and should not be confused with that swing midpoint. Their different values describe different questions.
The bearish scenario is a daily loss of $509.95 followed by failure to reclaim it, with the $500 area and displayed $491.22 swing low becoming subsequent reassessment references. Loss of $491.22 with a failed recovery would weaken the wider consolidation. The EMA at $480.19 is farther context and moves with new candles; it is not a promised destination.
Risk: Make a claim answer to the right evidence
A proposed continuation loses its local basis if the $510 retest fails and price accepts back beneath $500. That price condition does not establish the size of contractual spending. Separately, a conclusion about improved investment economics needs cash and operating evidence, even if reported capex falls. Revise each interpretation when its own evidence changes.
Use actual quotes, spreads and liquidity once the session reopens. News can gap through a planned exit; options add volatility and time-decay exposure. This is educational analysis, with no HPT position, execution, realized return or guaranteed outcome claimed. The useful result is a comparison that can be checked, and a price condition that can fail
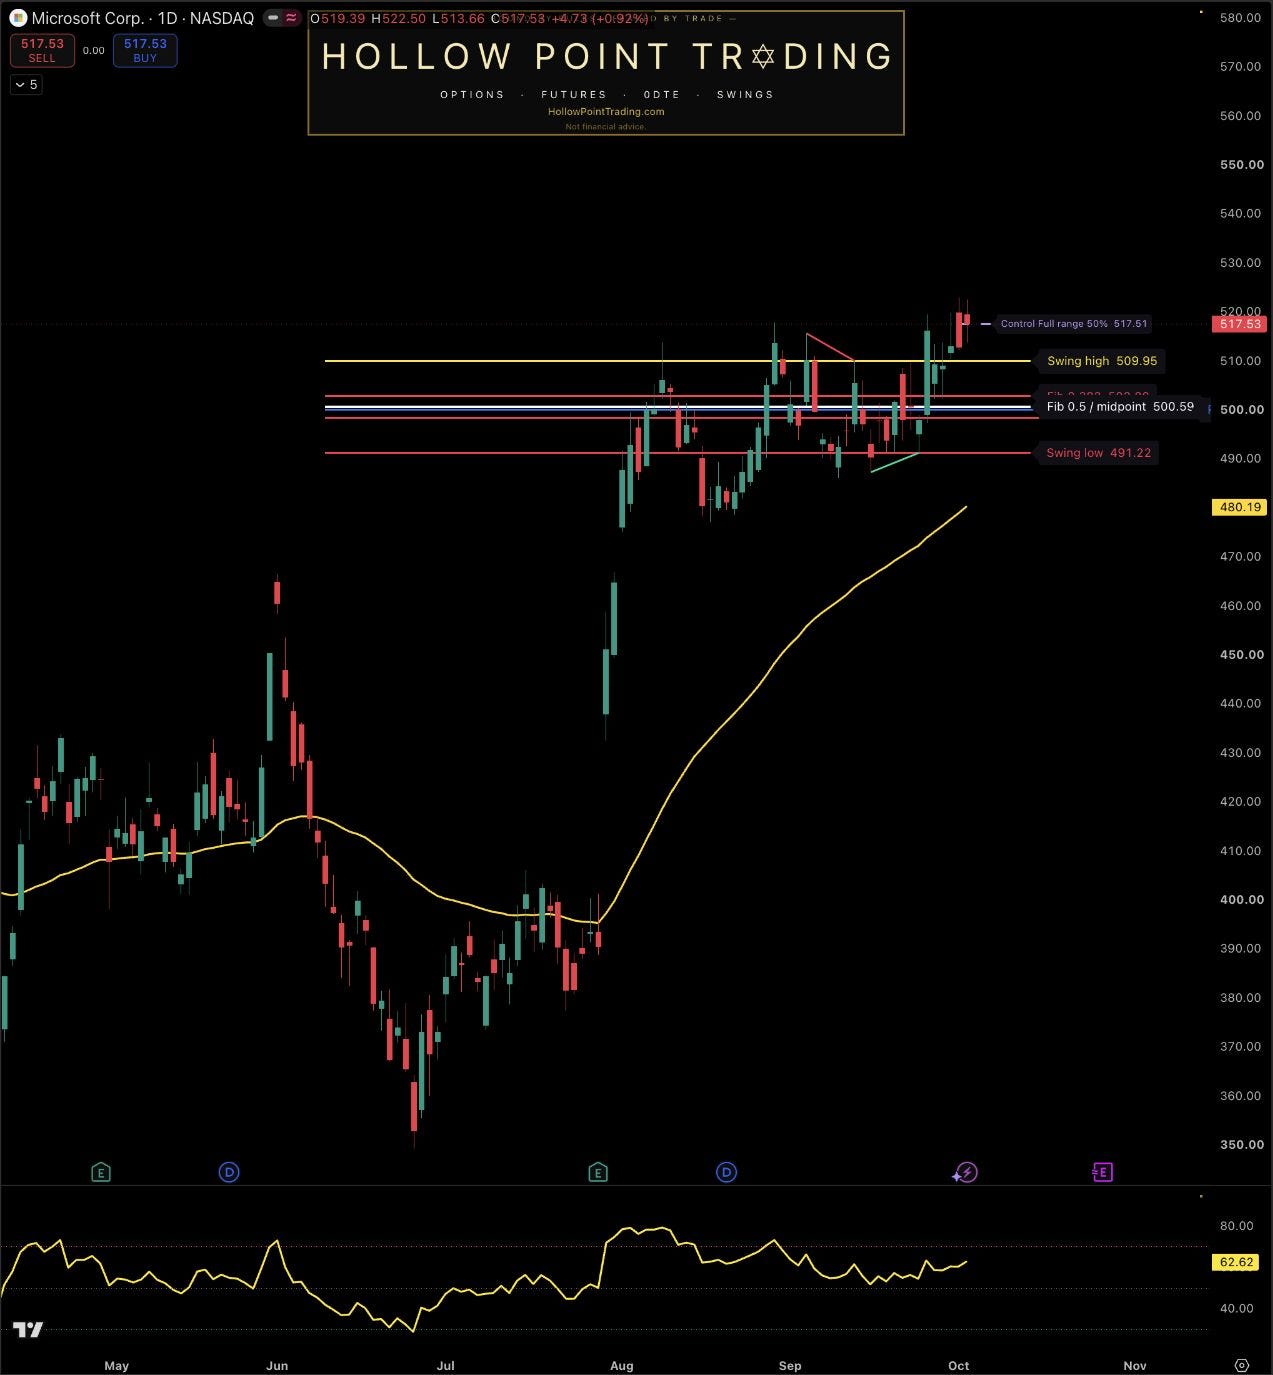
Source: TradingView, requested NASDAQ:MSFT, observed BATS:MSFT / NASDAQ by Cboe One, daily (1D). Captured October 4, 2026 at approximately 9:38 a.m. CT. Sunday U.S. equity market closed; latest completed candle October 2. April–October frame highlighting the late-July dislocation and subsequent consolidation. Established EMA(55) $480.19; RSI(14) 62.62 is the sole lower panel. Static feed-specific observations do not prove announcement causation, lease economics or live weekend execution terms.
Sources and discussion
Microsoft — July 29 FY26 Q4 call: useful lives, lease classification and capex guidance
Microsoft — July 29 earnings release: historical June-quarter operating results
TradingView — freshly captured publisher-owned MSFT daily chart
Discussion: Which cash or lease disclosure would you require before calling the capex change an economic improvement, and what daily price behavior would make the $510 retest convincing?