
A maintenance visit and the sale of another machine can appear in the same reported revenue category. That is the detail to keep beside Lam Research’s next earnings date. The customer-support label describes a collection of activities; it does not, by itself, establish a subscription business with uniform revenue durability.
This is Hollow Point Trading’s October 3, 2026, noon Central edition, prepared after its scheduled slot. U.S. equity markets are closed on Saturday. The chart describes the completed October 2 daily session, and the company figures are historical disclosures researched anew today.
Macro: a fab has a purchase cycle and an operating cycle
A chip manufacturer deciding whether to install additional capacity faces a different immediate question from one deciding how to keep existing equipment productive. Expansion requires a view of future demand and the resources to commission capacity. Operating an installed tool requires attention to reliability, usable throughput and the economics of the process already in place.
These two questions can create different spending patterns. A customer can postpone a new project while continuing to maintain equipment, or reduce utilization in a way that changes its need for parts and support. An upgrade can also represent an investment decision rather than routine maintenance. Those are possible economic mechanisms, not evidence that any particular Lam customer took those actions in the latest quarter.
For market research, the practical implication is to examine what a revenue category actually contains before assigning it a defensive valuation. An installed base may provide opportunities after the original equipment sale. That does not make every subsequent dollar independent of the semiconductor cycle. Interest rates, customer budgets and demand expectations can affect the valuation of both kinds of activity.
This article does not identify a particular macro headline as the cause of Friday’s LRCX candle. The price record and the business classification answer different questions. A rising stock can reflect expectations beyond a reported quarter; an accounting label cannot establish why traders bought it.
Fundamental: support-related revenue is a mixed basket
Lam’s July 29 release reports June-quarter systems revenue of $4.250 billion and customer support-related revenue and other of $2.472 billion, within total revenue of $6.722 billion. The support-related category was $2.111 billion in March and $1.734 billion a year earlier. These are reported results for those periods, not October sales estimates.
The same release defines systems revenue as new leading-edge equipment. Its support-related definition includes customer service, spares, upgrades and non-leading-edge equipment from the Reliant product line. Thus, the reported support category includes equipment as well as service-related activity. The release does not supply a separate revenue breakdown for each of those ingredients.
A classification test before a durability claim
The teaching point is to distinguish a reporting category from a revenue contract. A category can group activities by how management organizes the business. A subscription claim would require evidence about the actual arrangements, renewal behavior and revenue recognition. The name of the category cannot supply those details.
Consider a fictional equipment supplier, unrelated to Lam’s actual mix. It reports 100 units of support-related revenue: 40 from maintenance, 20 from spare parts, 15 from upgrades and 25 from older-generation machines. Calling all 100 units a recurring maintenance annuity would conceal three different activities. Even the maintenance portion would require further information before an analyst could judge its duration and renewal risk.
The invented example illustrates a classification error; its proportions are not estimates for LRCX. With Lam’s disclosed aggregate, the defensible observation is that the category grew across the displayed comparisons and contains a stated mix of activities. It does not establish which ingredient produced the increase or how much is contractually recurring.
A useful next-quarter research note therefore has two columns. One records the reported categories and their exact periods. The other records management’s explanation of demand, utilization and mix, leaving unavailable details blank. Keep the interpretation beside the evidence rather than filling missing component data with a plausible industry narrative.
October 21 is the next announced reporting checkpoint
Lam’s September 30 announcement schedules its quarterly financial conference call and webcast for Wednesday, October 21 at 2 p.m. Pacific Daylight Time, which is 4 p.m. Central and 5 p.m. Eastern. That is the verified upcoming catalyst. It is not a September-quarter result or a guarantee about what the company will report.
When the new disclosure arrives, compare the support-related category with the systems category and read the accompanying definitions again. Seek evidence about the sources of demand and the mix of activity. A larger aggregate is useful information, but its sustainability depends on what produced it. This review makes no invented forecast for the separate service, spares, upgrade or Reliant components.
Technical: the daily advance has cleared an older swing reference
The fresh publisher-owned daily chart shows the October 2 candle opening at $350.00, reaching $352.56, falling to $344.77 and closing at $347.49. The established 55 EMA is $310.97. RSI(14), the sole lower panel, reads 67.63. Those are historical values on the captured Cboe One feed, not live Saturday quotes.
The chart frames the late-summer decline toward the marked $265.37 swing low and the subsequent September rebound. Price is above the selected $322.21 swing-high reference and above its turning-up average. The same selected range supplies $300.50, $293.79 and $287.08 retracement references farther below. The markings depend on selected anchors; they are not estimates of fair value.
The latest candle closed below its own $350 opening despite gaining against the prior close. That is a useful distinction between candle color and close-to-close change. The rebound is observable, while a successful hold above Friday’s high remains a future test. RSI below 70 does not grant a risk-free entry, and a strong reading cannot predict the reporting outcome.
Next-session scenarios: test the nearest boundary first
Continuation: sustained acceptance above $352.56, followed by a held retest, would strengthen the immediate advance. A quick excursion that returns below that high would weaken the breakout interpretation. The $360 area is a round-number observation reference, not a proven target or resistance derived from this frame.
Pause: trading between $344.77 and $352.56 would leave the completed candle’s boundaries unresolved. Consolidation there could coexist with the larger rebound. It would still require new bars to establish whether buyers retain the advance; the support-revenue story supplies no automatic answer.
Failure: a loss of $344.77 with an unsuccessful reclaim would invalidate the immediate hold condition. A sustained return beneath $322.21 would challenge the more substantial swing reclaim. The updated 55 EMA would then deserve attention; $310.97 is this capture’s observation and changes with later bars. The deeper retracement lines provide context, not guaranteed exits.
Risk: a mixed business can still trade as one stock
Different revenue activities do not cancel market risk. Customer spending can change, and an earnings disclosure can alter expectations before the stock offers a tidy retest. Reopening gaps can cross a planned threshold. Options add spread, volatility and time-decay exposures that a daily chart does not measure.
The business question is which activities sustain the support-related aggregate. The price question is whether the latest advance retains its nearest boundaries. Keep both conditional and revisit them with new evidence. This is educational research; no HPT holding, executed trade or realized performance is asserted.
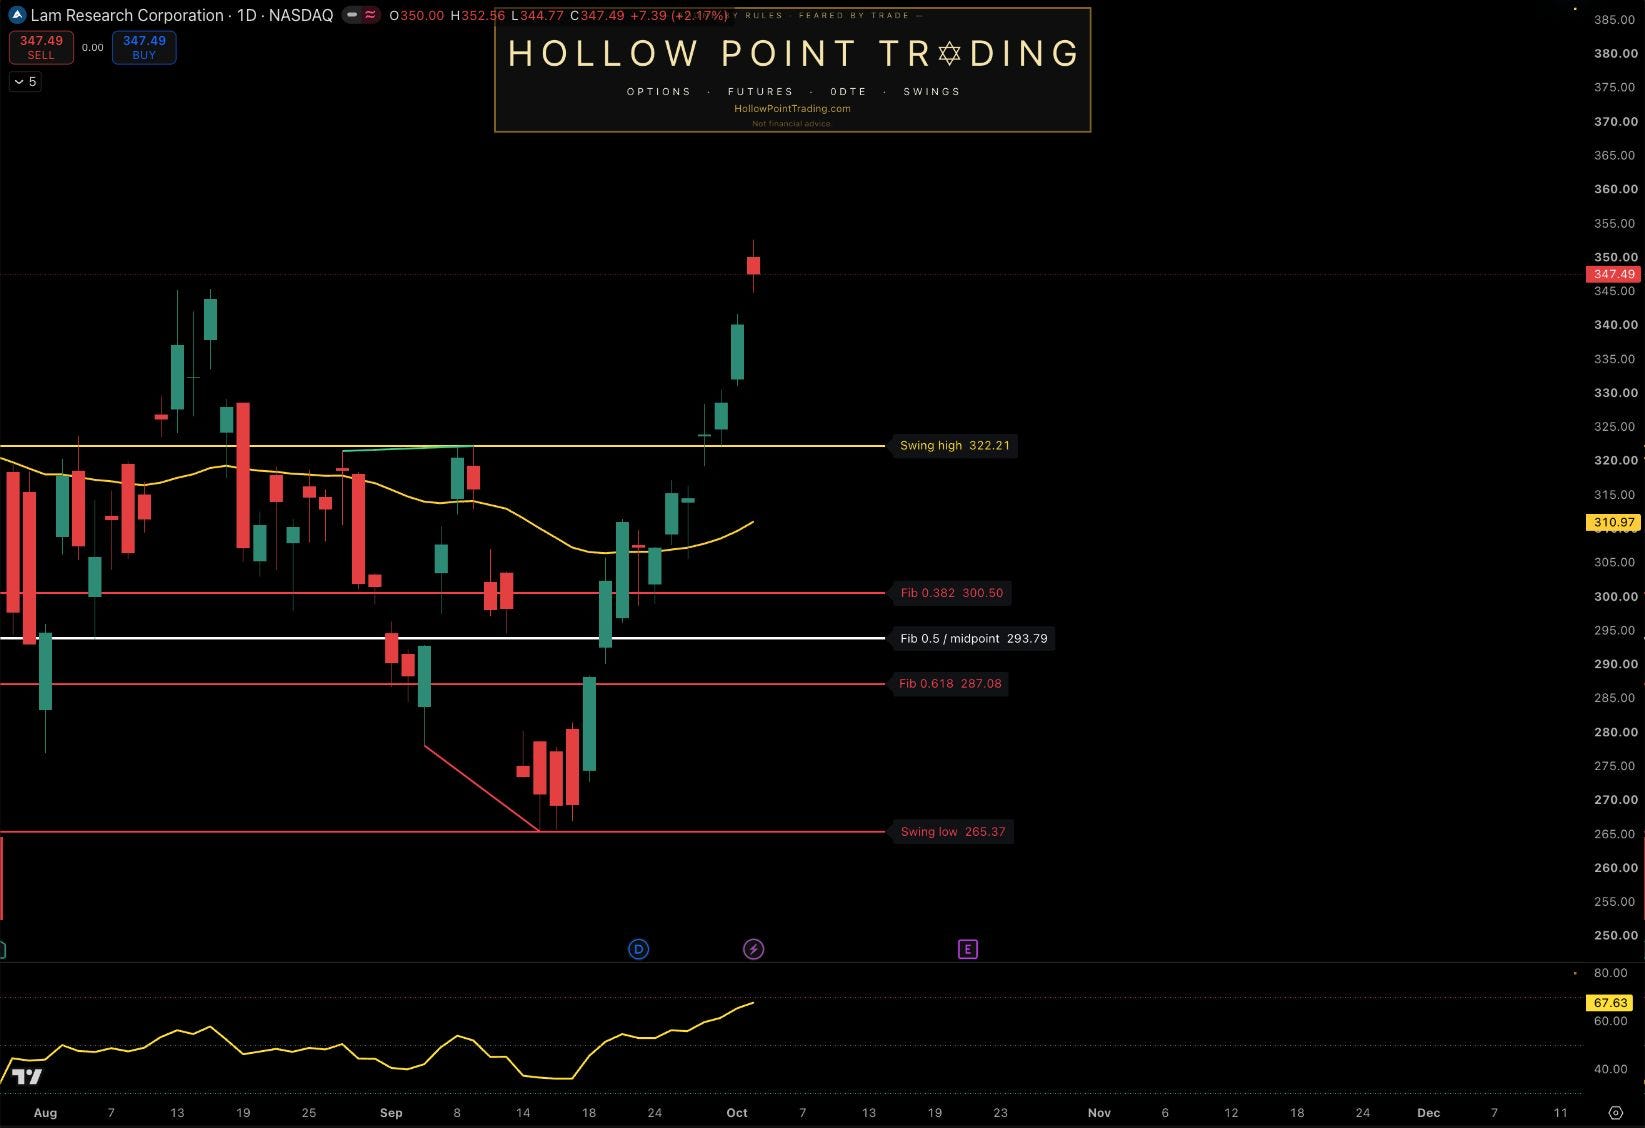
Source: genuine TradingView publisher-owned chart, requested NASDAQ:LRCX and observed BATS:LRCX / NASDAQ by Cboe One, 1D. Captured October 3, 2026 at approximately 12:12 p.m. America/Chicago. Saturday equity market closed; latest completed candle October 2. Established 55 EMA $310.97; RSI(14) 67.63 is the sole lower panel. Direct chart screenshot used because native image export distorted price-scale alignment. Static historical, feed-specific image; selected swing anchors and later bars affect references and indicators. No live weekend quote, forecast or guaranteed execution.
Sources and evidence limits
Lam June-quarter 2026 financial results — July 29
Lam September-quarter conference-call announcement — September 30
Company numbers are historical reported results. The October 21 webcast is an announced future event. The fictional revenue basket is a teaching illustration; the technical scenarios are conditional inference. No September-quarter outcome is assumed.
Discussion: What component evidence would you need before calling Lam’s support-related revenue durable, and which next-session price failure would overturn your current LRCX setup?