
Hollow Point Trading • October 3, 2026 • 6:00 p.m. CT edition. U.S. equity markets are closed this Saturday. This research uses historical company disclosures and Friday’s completed daily candle; it does not present a live weekend equity quote.
A defense contractor can report a large earnings rebound while its stock remains below its daily trend average. That combination does not require choosing which observation is “right.” It requires asking what each observation measures. For Lockheed Martin, a recent aircraft-delivery milestone supplies the business context, the prior-year program losses complicate the earnings comparison, and the chart puts the next price test close to a conspicuous round number.
Macro — Defense demand still travels through a production system
On October 1, Lockheed Martin reported the arrival of Finland’s first two permanently based F-35A aircraft in the country. Its announcement said Finland had received ten of its planned 64 aircraft, with eight temporarily stationed in Arkansas for training. Those are delivery and training milestones. They do not tell us the revenue or profit recognized on an individual aircraft in this quarter.
The economic channel is worth separating into steps. Governments define a capability requirement, authorize funding, place contracts, and then work with manufacturers through production, acceptance and support. An announcement can strengthen the evidence that a program is advancing without answering the investor’s next question: how much profitable work does that advancement produce, and on what timetable?
A defense-demand thesis therefore needs more than a geopolitical headline. Labor, supplier capacity and execution determine how a manufacturer converts work into an operating result. Long commitments can provide visibility, but the duration also gives estimates time to change. The relevance for a trader is straightforward: a durable customer relationship and a favorable next-session price move are different propositions.
The company’s investor calendar lists its third-quarter earnings call for October 22, 2026 at 8:30 a.m. Eastern, or 7:30 a.m. Central. That scheduled discussion is the next reporting checkpoint used here, not a prediction that the stock must rise into it. The questions are whether execution remains consistent and whether the explanation of earnings distinguishes new improvement from an easier comparison.
Fundamental — Read the old denominator before celebrating the growth rate
Lockheed’s July 23 second-quarter release reported sales of approximately $20.1 billion against $18.2 billion a year earlier. Net earnings were $1.836 billion versus $342 million, and diluted EPS was $7.94 versus $1.46. The release also identified $1.6 billion of program losses and $169 million of other charges in the prior-year quarter. Its explanation of the operating-profit increase said the prior-year reach-forward losses were a major driver of the comparison.
The sales increase and the earnings increase are therefore not interchangeable descriptions of the business. Sales can increase because more work is performed. Earnings can increase because work is more profitable, because expenses change, because the previous period contained a large charge, or because several effects occur together. The reported figures establish that earnings rose; the comparison alone does not establish how much of that increase will recur.
A simple teaching example illustrates the trap. Imagine a company that earns 100 units from ordinary operations but records a 70-unit charge in the first year. Reported earnings become 30. If ordinary earnings remain 100 the next year and the charge does not repeat, reported earnings rise from 30 to 100. That is a substantial reported increase with no growth in the invented ordinary-earnings component. This example is deliberately hypothetical and is not a reconstruction of Lockheed’s accounts.
Nor can we safely manufacture “normalized LMT EPS” by dividing a pretax charge by a share count and adding it to the old EPS. Taxes, the classification of other charges, pension adjustments and other items can matter. An adjustment needs a documented reconciliation. The useful discipline here is to flag the comparison problem and read management’s bridge, rather than turn a rough shortcut into an official figure.
Fundamental — Program economics need a second look after a milestone
The Finnish arrival offers tangible evidence of progress, but an aircraft photograph cannot settle the margin question. A manufacturer may meet a delivery milestone while the total expected cost of a longer program changes. Equally, a difficult prior-year comparison can clear without proving that every source of execution risk has disappeared. These statements are analytical possibilities, not claims of a new charge or undisclosed problem at Lockheed.
For the October 22 discussion, three connected questions give the research a practical purpose. First, what explains the change in sales? Second, what explains the change in profit after the prior-year effects are identified? Third, do cash generation and the company’s outlook support the same operating explanation? A consistent answer across those measures is more useful than choosing the largest percentage in a release.
The bullish business interpretation would gain support from credible production progress paired with stable program economics. The cautious interpretation would gain support if a better headline comparison concealed weaker current execution or a less favorable outlook. Neither outcome has been reported for the coming quarter. This is a checklist for evaluating future evidence, not a statement about a result that has already occurred.
Technical — Friday closed above $500 after trading below it
The publisher-owned TradingView chart was captured anew on October 3 at approximately 6:07 p.m. CT. The requested symbol was NYSE:LMT; the chart reports BATS:LMT with NYSE by Cboe One data on the daily, or 1D, timeframe. Friday’s candle opened at $505.79, reached $507.97, traded down to $498.55 and closed at $505.41. The established 55-day EMA reads $540.10; RSI(14), the only lower panel, reads 30.82.
The broad June–October framing shows the retreat from the August high area toward the $500 line. That blue line is a round-number reference, not a guarantee of support. The candle makes the distinction concrete: the close finished above $500, but the intraday low was below it. A close-based condition and an intraday stop would have encountered different paths on the same day.
The chart also carries a confirmed-swing reference at $515.60 above the latest close. The stock remains beneath the displayed EMA. Those observations preserve a cautious daily trend reading even though a rebound can occur after a decline. RSI near 30 describes the indicator’s weak recent momentum reading; it does not identify a guaranteed bottom or a maximum possible loss.
Bull scenario: a sustained reclaim of Friday’s $507.97 high would improve the immediate rebound case. Acceptance above the displayed $515.60 swing reference would be a later test. Failure back beneath the reclaimed level would weaken that particular breakout premise; a fresh loss of $498.55 would challenge the broader Friday-reaction setup.
Base scenario: two-way trade within $498.55–$507.97 leaves Friday’s range unresolved. Repeated travel across $500 would demonstrate why a round number alone is an incomplete entry plan. Range compression can precede a move in either direction, and the daily average will update as new candles arrive.
Bear scenario: losing $498.55 and failing to recover it would extend the immediate breakdown interpretation. A sustained reclaim of that lost low would weaken the breakdown case. This image does not establish a precise lower target or guarantee that an order can execute at the scenario boundary.
Risk — A comparison-base lesson cannot protect an execution
The next equity session can gap beyond a chosen trigger or invalidation. Earnings, program updates and broader repricing can change the evidence before a daily candle closes. This chart does not show an options chain, implied volatility, a bid–ask spread or intraday liquidity. A correct explanation of the earnings comparison still leaves those trading risks unresolved.
Keep the business thesis and the price condition independently testable. The former asks whether profitable execution improves; the latter asks whether an observed boundary holds or fails in a fresh session. This is educational research, with no asserted HPT position, executed trade, prescribed sizing or realized return.
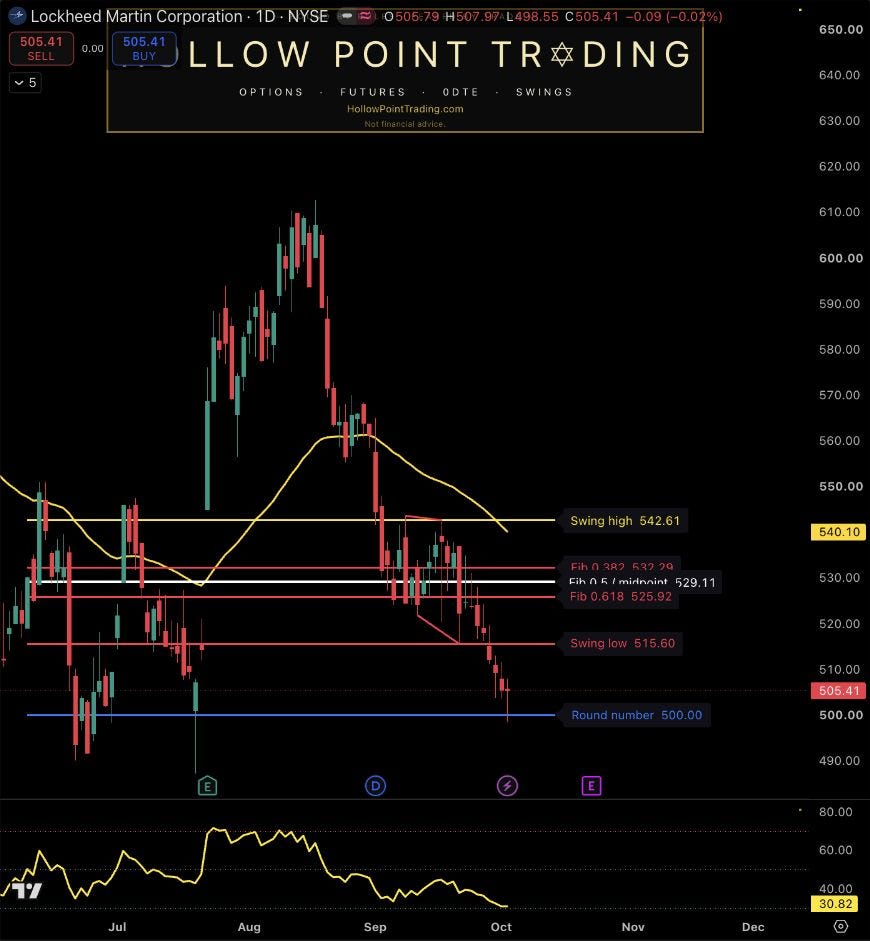
Source: genuine TradingView publisher-owned chart; requested NYSE:LMT, observed BATS:LMT / NYSE by Cboe One, daily (1D). Captured October 3, 2026 at approximately 6:07 p.m. America/Chicago. Saturday equity market closed; latest completed candle October 2. Established 55-day EMA $540.10; RSI(14) 30.82 is the only lower panel. June–October historical frame. The $500 line is a round-number reference; $515.60 is a displayed confirmed-swing reference. Indicators update with later bars. No live weekend quote, causal proof, forecast or guaranteed execution.
Sources and evidence limits
Lockheed Martin — Finnish F-35 arrival announcement, October 1, 2026
Lockheed Martin — second-quarter results and comparison explanation, July 23, 2026
Lockheed Martin investor calendar — October 22 earnings call, checked October 3, 2026
The company figures and delivery milestones are historical disclosures. The call date is a scheduled event and can change. The 100-unit example is invented for teaching. Business interpretations and future price scenarios are analysis, not reported future results. Company announcements reflect the company’s account of its own programs.
Discussion: Which evidence in the next earnings bridge would convince you that LMT’s improvement extends beyond the prior-year charge comparison, and what price failure would invalidate your rebound scenario?