
Macro: A global average leaves the local consumer unresolved
Eight percent more volume can coexist with a weaker price/mix reading. That is the tension worth carrying into Coca-Cola’s next report: a beverage company can reach more consumption occasions without improving the revenue composition of each region. A worldwide growth statistic may be accurate while leaving a local commercial problem unresolved.
This Sunday, October 4 study is the 10:30 a.m. Central edition. U.S. cash equities are closed. The fresh daily chart uses completed candles through Friday, October 2. The operating evidence below comes from the second quarter, and the next dated checkpoint is October 27. None of those observations supplies a live weekend stock price or the coming quarter’s result.
Consumer staples face a practical affordability question. A household can continue buying a familiar drink while choosing a smaller pack, a cheaper channel or a different product. Those choices can preserve physical activity while changing the dollars generated by the sales mix. Geographic expansion adds another layer: markets have different price points, channels and consumer purchasing power.
For that reason, I would resist treating the company’s global average as a direct reading of every region. The useful macro discipline is to ask where growth occurred and what kind of purchase grew. This article does not claim a new inflation shock, a change in policy rates or a measured shift in household income. It examines how an operating mix can complicate a broad consumer story.
Fundamental: Asia Pacific changes the question behind growth
Coca-Cola’s July 28 second-quarter release reports global unit case volume growth of 5% and consolidated price/mix growth of 2%. Asia Pacific’s unit case volume rose 8%, while price/mix declined 9%, primarily reflecting unfavorable mix and affordability initiatives. The region’s comparable currency-neutral operating income, a non-GAAP measure, was unchanged. Regional value-share gains in Japan and China were more than offset by a loss in India.
Those historical facts establish a regional crosscurrent, not a verdict on the entire business. My interpretation is that strong physical growth needs a separate commercial-quality test. A unit increase, a price/mix change and a value-share comparison measure different relationships. It would be an error to convert the negative price/mix figure into a claim that every shelf price fell by nine percent.
It would also be an error to subtract nine from eight and call the answer Asia Pacific’s revenue growth. The measures have different definitions, and this article is not reconstructing the company’s revenue bridge. Keep the actual disclosed revenue measure alongside its reported components when making that calculation. A shortcut built from mismatched quantities can produce a precise-looking number with the wrong meaning.
Fundamental: Give the mix explanation a measurable follow-up
Consider an invented two-market beverage business. Market A sells 100 units at a revenue value of two units each; Market B sells 100 at one each. Combined activity is 200 physical units and 300 revenue units. If B expands to 120 units while A stays unchanged, physical activity rises to 220 and revenue to 320. Average revenue per physical unit falls from 1.50 to about 1.45, even though neither market changed its individual selling value.
This miniature example is ordinary arithmetic, not Coca-Cola’s regional result or an estimate of its margin. It demonstrates a composition effect: the faster-growing component can carry a lower value per unit. To understand profitability, we would additionally need product costs, marketing spending and other operating expenses. More units alone do not settle the return earned on that expansion.
A useful follow-up asks whether the added activity is durable, whether the mix stabilizes and whether commercial share improves in the markets that previously lagged. The constructive interpretation would gain support from healthier mix without surrendering consumption growth. A mixed report could retain strong unit activity while profit quality remains uneven. A weaker reading could combine slowing activity with continued unfavorable composition. These are analytical scenarios, not management forecasts.
The September 29 event announcement schedules third-quarter results for October 27 before the NYSE opens, followed by an 8:30 a.m. Eastern call, or 7:30 a.m. Central. That announcement establishes timing only. Read the new regional figures against their matched prior periods when they arrive; do not treat a future result as known or assume a global beat resolves every local question.
Technical: The former range floor now needs a reclaim
The new TradingView capture requests NYSE:KO and displays the NYSE-listed company through Cboe One, observed as BATS:KO, on daily candles. October 2 opened at $86.30, reached $86.45, traded down to $85.17 and closed at $85.65. The established 55-day EMA reads $86.78. RSI(14), the only lower panel, reads 37.45. These are historical feed observations, not executable Sunday quotes.
The August-to-October frame shows the late-summer advance giving way to a range and then a break below its displayed $87.12 swing-low reference. The latest close is also beneath the EMA. That is weaker local structure, even if the operating story contains positive volume evidence. The chart describes price and momentum; it cannot identify why investors sold or attribute the decline to a specific regional disclosure.
A bullish repair would first need daily acceptance above the $86.78 EMA area, followed by a reclaim and retained retest of $87.12. The average moves with each new candle, so update it rather than treating this captured value as permanent. Above that repair, $87.98, $88.24 and $88.50 are displayed selected-swing retracement references, with $89.36 the swing-high reference. They are checkpoints, not promised targets.
The base case is attempted stabilization around Friday’s $85.17–$86.45 range while the former floor remains overhead. A bearish continuation would require a daily loss of $85.17 followed by failure to recover it. The $85 round number is nearby context, but this frame does not establish a precise support level below it. A fresh assessment would be needed if price moves beyond the visible structure.
The chart’s $86.79 control midpoint uses a broader-range anchor; it is different from the $88.24 selected-swing midpoint. Their proximity to other references should not be treated as independent proof of support. A proposed recovery is invalidated locally if the reclaimed $87.12 fails and price accepts again beneath the setup’s chosen support. A sustained reclaim weakens the immediate breakdown interpretation.
Risk: Let each conclusion answer to its own evidence
Regional operating improvement and a stock-price reclaim are separate tests. Either can occur before the other. Use the earnings report to assess commercial composition and the next sessions to assess acceptance at the mapped levels. News can gap through exits, liquidity can change and options introduce volatility and time-decay exposure. This is educational analysis, with no position, fill or outcome implied.
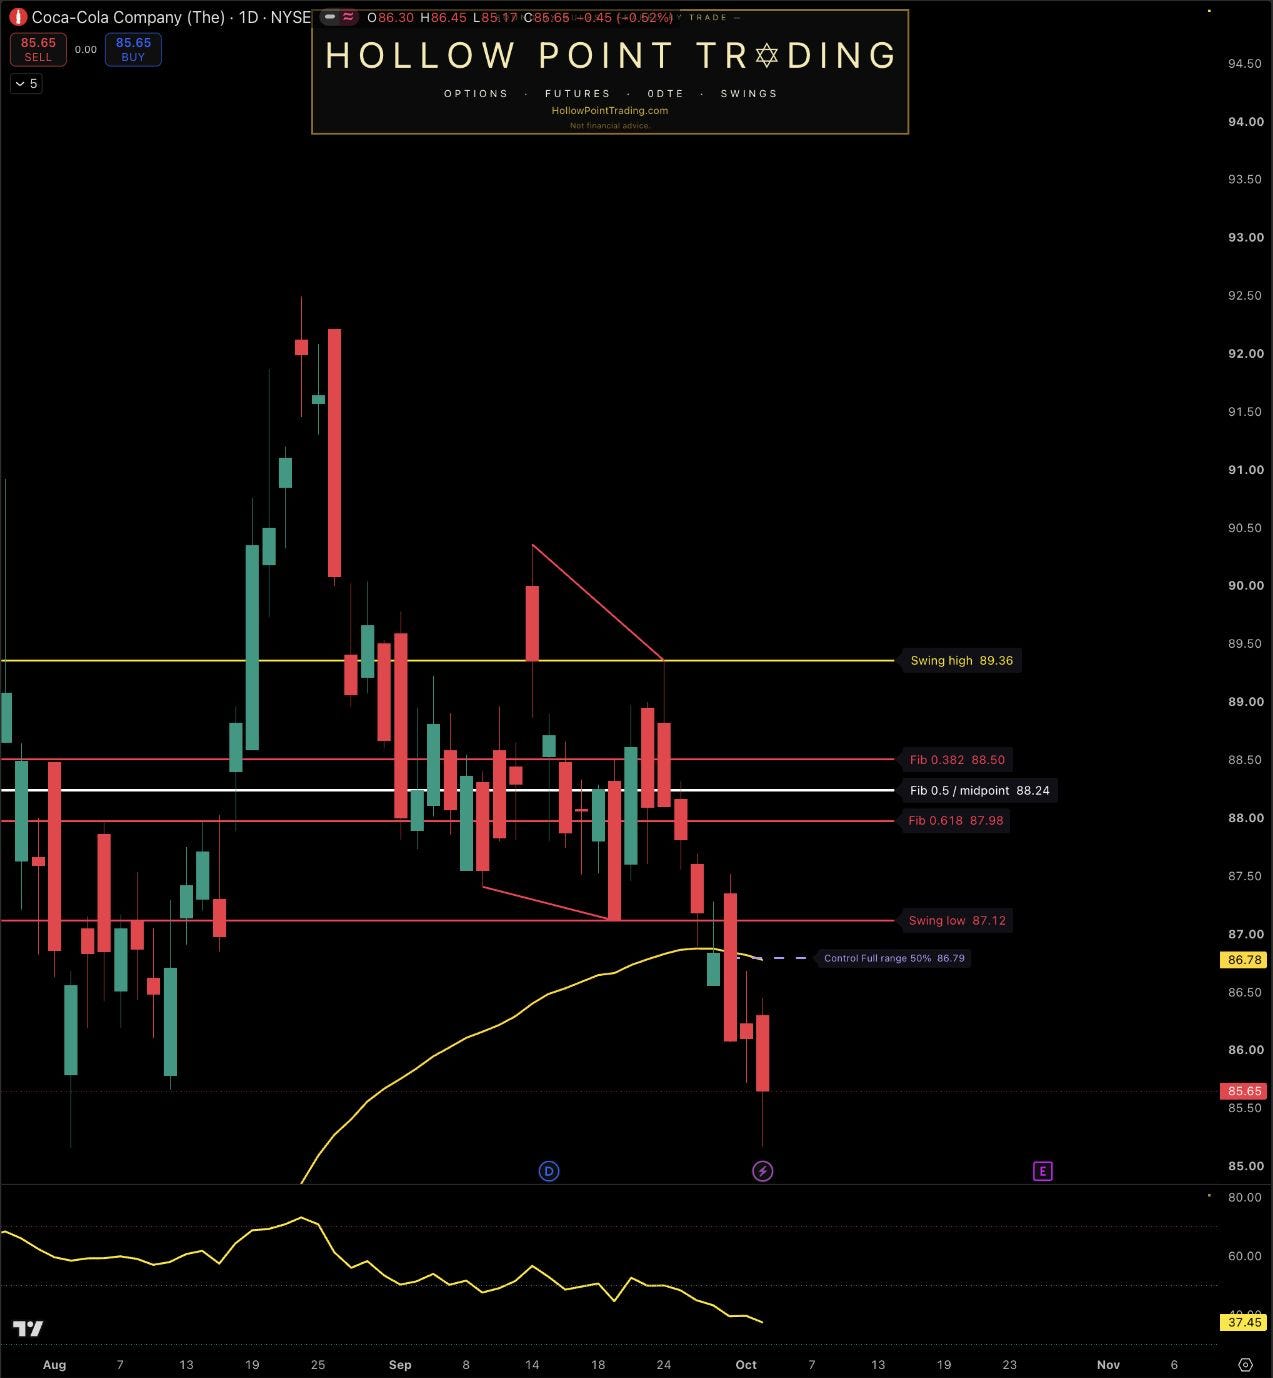
Source: TradingView, requested NYSE:KO, observed BATS:KO / NYSE by Cboe One, daily (1D). Captured October 4, 2026 at 10:41 a.m. Central. Sunday equity market closed; latest completed candle October 2. August–October range-to-breakdown frame; established EMA(55) $86.78; RSI(14) 37.45 is the sole lower panel. Selected-swing and broader-range control midpoints have different anchors. Static feed observations do not establish disclosure causation, regional profitability or live weekend execution terms.
Sources and discussion
Coca-Cola — July 28 second-quarter results and regional operating review
Coca-Cola — September 29 announcement of October 27 results and call
TradingView — fresh publisher-owned KO daily chart
Sources checked October 4, 2026. The arithmetic illustration, interpretations and scenarios are HPT analysis, not company guidance.
Discussion: Which regional disclosure would convince you that Coca-Cola’s extra volume has improved commercial quality, and what daily behavior would make a $87.12 reclaim credible?