
Macro — Banks have two clocks, for assets and funding
JPMorgan’s next earnings report gives bank investors a useful test: can a larger earning-asset base keep supporting interest income when the net yield on that base is lower? Volume and yield can move in opposite directions. A growing dollar total does not, by itself, establish that each dollar of assets has become more profitable. That distinction matters before treating a revenue headline as evidence of improving banking economics.
This is a Sunday, October 4, 2026 review for Hollow Point Trading’s 10:00 a.m. Central edition. U.S. cash equities are closed. The prices below describe the completed Friday, October 2 daily bar, not a live Sunday quotation. The event ahead is JPMorgan’s October 13 results release; this article does not anticipate that report as though it has already happened.
The financial sector’s rate sensitivity reaches a diversified bank through several channels. Loans and securities earn income, while deposits and other funding can carry costs. Those rates do not necessarily reset on the same date. Contract terms, deposit competition, customer behavior and the mix of assets can all change the relationship. A simple claim that higher or lower policy rates must help JPM misses the timing and composition of the balance sheet.
The relevant macro question is therefore operational: how much business is the bank carrying, what net interest return does that business produce, and what risks accompany expansion? Loan demand can support volume, but more assets also require funding and capital. Growth that preserves interest income may still produce a different earnings outcome once operating expenses and credit losses are considered. These are mechanisms to examine, not claims about a new Federal Reserve decision or an observed deposit shock.
Fundamental — The second-quarter crosscurrent is measurable
JPMorgan’s second-quarter 2026 supplement reports net interest income excluding Markets of $23.677 billion, versus $23.280 billion in the first quarter and $22.753 billion a year earlier. Average interest-earning assets excluding Markets were $2.602 trillion, versus $2.537 trillion and $2.458 trillion, respectively. The associated net yield was 3.65%, down from 3.72% sequentially and 3.71% a year earlier. Those are historical results. The excluding-Markets measures are non-GAAP; they separate the specified Markets activities from this comparison.
The analytical inference is narrower than a broad bullish conclusion: the dollar interest-income total rose while the reported net yield fell. The larger asset base helps explain why those two statements can coexist. It does not prove that volume alone explains every change, nor does it establish a forecast for the next quarter. A reader should keep the company’s measurement boundary consistent rather than compare an excluding-Markets ratio with an unrelated firmwide balance.
Consider an intentionally simplified annualized example, not a reconstruction of JPMorgan’s quarter. An earning-asset base of 100 units at a 4.00% net yield produces four units of net interest income. Increase the base to 108 while reducing the yield to 3.75%, and the product becomes 4.05. Income rises slightly even though the yield declines. This illustration ignores quarter length, averaging conventions and other reporting adjustments. It also excludes expenses and credit costs; the product is not net profit.
That example shows why a bigger income number needs a second question: what had to grow to obtain it? The attractive version combines sustainable customer demand, manageable funding costs and acceptable credit performance. A less attractive version requires expanding exposure merely to offset a weaker return per dollar. The headline alone cannot distinguish them. The next report should be read alongside the balance-sheet averages, yield measures and management’s explanation of funding and mix.
Fundamental — October 13 is a checkpoint, not a known outcome
In its September 17 announcement, JPMorgan scheduled third-quarter results for approximately 7:00 a.m. Eastern on Tuesday, October 13, followed by an 8:30 a.m. Eastern call. Those times are 6:00 and 7:30 a.m. Central. The announcement establishes the event schedule; it does not supply the quarter’s outcome. Any guidance discussed on that date will need to be separated from completed results.
An upside interpretation would require evidence that volume support remains durable without an unacceptable deterioration in funding economics or credit quality. A mixed outcome could preserve the interest-income total while leaving the yield under pressure. A downside interpretation would emerge if weaker yield and insufficient volume support coincide, especially if other costs compound the pressure. These are conditional reading frameworks, not earnings estimates, company guidance or claims about what institutional investors are doing.
Technical — Friday’s bounce area sits below the repair zone
The fresh daily TradingView capture shows JPM at $332.38 on the completed October 2 bar, with an open of $334.00, high of $334.85 and low of $330.00. The established 55 EMA is $344.98, while RSI 14 reads 34.48. The August-to-October frame shows price below the average after a decline from earlier highs. RSI describes weak momentum; it neither guarantees a reversal nor supplies a reason to ignore price confirmation.
The chart’s selected swing references are $360.05 and $343.07. With price already below $343.07, that lower reference now functions as a potential reclaim area rather than untouched support. The displayed retracement references at $349.56, $351.56 and $353.56 belong to that selected swing. The separately displayed broader-range control midpoint at $329.73 comes from a different anchor; it should not be confused with the $351.56 swing midpoint.
A bullish repair scenario starts with daily acceptance above $343.07, then evidence that price can retain the $344.98 EMA and hold a retest. Only after that improvement would $349.56 and the higher selected-swing references become useful next checkpoints. Reclaiming Friday’s $334.85 high could improve the immediate bounce, but would leave the larger repair unfinished. A momentary intraday crossing is weaker evidence than a close followed by a successful hold.
The base scenario is rotation around Friday’s $330.00–$334.85 range while price remains below the reclaim zone and the EMA. The bearish scenario is a daily loss of $330.00 followed by a failed recovery, with $329.73 a nearby mapped reference to assess rather than a promised stopping point. This capture does not justify inventing a precise lower target. If price moves beyond the visible structure, a new chart assessment is necessary.
The bullish thesis weakens if a reclaimed $343.07 fails again and is invalidated by renewed acceptance below the setup’s chosen support. Conversely, a sustained recovery through the reclaim zone would weaken the immediate breakdown thesis. Define the actual entry, invalidation and position risk before taking exposure; the article’s reference levels do not create a trade on their own. Earnings gaps can skip stops, spreads can widen, and options add volatility and time-decay risk. This is educational analysis, with no position, fill or outcome implied
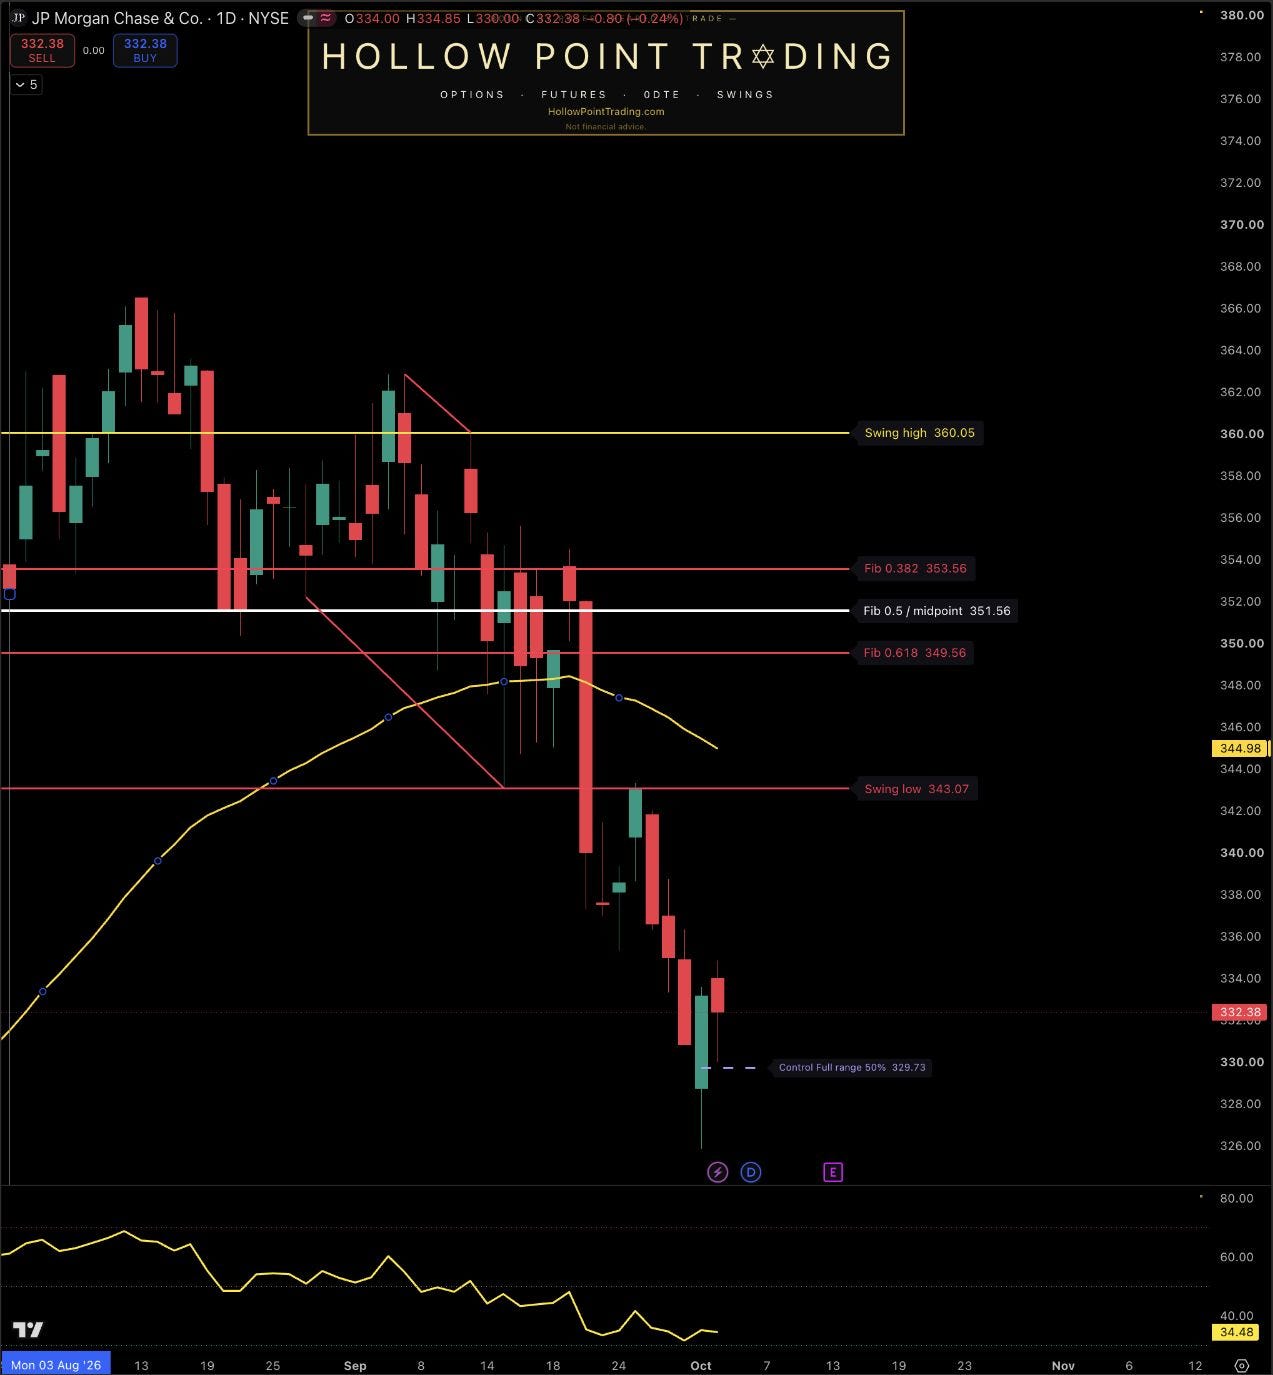
Source: TradingView, NYSE:JPM displayed through the BATS/Cboe One feed; daily candles, established 55 EMA and RSI 14 only. Captured October 4, 2026 at 10:11 a.m. Central. Last completed cash-equity session: October 2; Sunday market closed. Selected swing and broader-range control references have different anchors. This historical chart shows structure and momentum, not live Sunday prices, order flow or a guaranteed earnings response.
Sources and discussion
JPMorgan 2Q26 financial supplement, page 28 — historical excluding-Markets measures; September 17 announcement — October 13 earnings schedule; TradingView JPM instrument page. Sources checked October 4, 2026. Interpretations and scenarios are HPT analysis, not company guidance.
Which combination of asset growth, net yield and funding evidence would make October 13’s interest-income result convincing to you, and what daily price reclaim would you require before treating JPM’s bounce as a repair?