
A machinery cycle can approach its low point while a manufacturer is still shipping fewer large agricultural machines. The timing claim and the operating result answer different questions. Deere offers a useful weekend study of that distinction: a forecast about the cycle should be tested against the next disclosure, while the latest completed quarter already shows how volume, pricing and costs pull profit in different directions.
This is Hollow Point Trading’s October 3, 2026, 3:00 p.m. Central edition, prepared after the scheduled slot. U.S. equities are closed on Saturday. The fresh daily chart is a historical snapshot through October 2, and the business evidence comes from Deere’s August 20 third-quarter release and presentation. It is not an October earnings announcement.
Macro — A replacement decision has its own clock
Agricultural machinery demand depends on a customer’s willingness and ability to replace equipment. A machine can remain useful beyond the moment an investor expects a cycle to recover. Financing costs, expected income, maintenance needs and the available used-equipment alternatives can all enter that decision. This is a general decision framework, not a newly measured October survey of Deere customers.
That replacement clock explains why an anticipated bottom and rising shipments need not arrive together. An investor may believe the worst comparisons are approaching before a customer places an order. A customer may order before a factory ships. A shipment may reach a dealer before the final buyer takes delivery. Treat each step as a separate observation rather than collapsing the chain into a single word such as “recovery.”
For the industrial sector, this creates a practical distinction between selling more units and earning more on the units sold. Pricing and mix can change the financial outcome even when volume is weak. Costs can then absorb part of the benefit. The most useful question is not whether one headline sounds optimistic; it is which link in the chain has actually improved.
Fundamental — Read the bridge from the old profit to the new profit
Deere’s August presentation shows Production & Precision Ag sales of $3.998 billion versus $4.273 billion a year earlier, down 6%. Its operating-profit bridge moves from $580 million to $527 million. Volume/mix contributes negative $124 million, price positive $108 million, currency positive $49 million, production costs negative $95 million, selling/administrative/general and research/development positive $5 million, special items negative $24 million and other positive $28 million; warranty is zero.
The bridge reconciles: the changes sum to negative $53 million. Pricing is a favorable contribution, but it does not fully neutralize the combination of lower volume/mix and higher production costs. The presentation’s separate bars make that easier to see than a headline that reports only the final profit number.
A favorable price bar is not a shipment recovery
Build a two-step reading habit. First, ask which component changed. Second, ask what that component can establish. A positive price contribution supports the claim that pricing helped profit relative to the comparison period. It does not by itself show that shipment demand recovered. A negative volume/mix bar also combines two effects, so do not convert it into an exact unit decline without further disclosure.
For a fictional teaching example, suppose a workshop earns 60 units of profit in one period. In the next, fewer jobs remove 12 units, higher charges add 10 and added operating costs remove 9. Other factors add 6. Profit becomes 55. The higher charge helped, but the workshop did not regain its earlier profit. These invented units illustrate a bridge; they are not a model of Deere’s next quarter.
A profit bridge is also comparative. Its bars describe the movement from one period to another, not the absolute size of each cost or revenue category. A negative production-cost contribution is a headwind to the change in profit. It is not the company’s entire production-cost bill. Reading the bars with that distinction avoids turning an explanatory chart into a false income statement.
The cycle claim belongs in the forecast column
The August release says management continues to expect 2026 to mark the bottom of the current agricultural equipment cycle. It forecasts fiscal-year net income of $4.75 billion to $5.00 billion. Both are forward-looking statements. Its reported third-quarter net income of $1.379 billion is an actual historical result. The forecast does not become an achieved outcome merely because it appears beside that result.
The next business test is whether subsequent disclosures show better volume/mix together with enough retained pricing and cost discipline to improve the operating result. A less negative bar could indicate improvement while still remaining negative. A stronger test would combine improvement in the demand evidence with a healthier profit outcome. These are analytical conditions, not asserted fourth-quarter results.
Deere’s investor-relations calendar lists its fourth-quarter earnings call for November 25, 2026. Check the issuer calendar again as the event approaches because schedules can change. The date supplies a future evidence checkpoint; it does not supply the answer to the cycle question today.
Technical — Friday repaired part of the range below $700
The fresh TradingView daily image shows Deere’s NYSE listing on the Cboe One feed, internally BATS:DE. October 2 opened at $671.45, reached $689.69, traded down to $668.61 and closed at $687.00, up 2.96%. The established 55-day EMA reads $651.87. RSI(14), the sole lower panel, reads 55.95. These feed-specific numbers describe the completed candle, not a live Saturday quote.
The focused September–October frame shows a retreat from the visible high area followed by Friday’s rebound. The close sits above the daily average but beneath the visible $700 round-number line. That line is a reference, not a proven resistance level. The difference between a rebound and acceptance above a boundary matters: one candle improves the immediate range without resolving every prior overhead price.
Bull scenario: retaining Friday’s $668.61 low and then accepting above $689.69 would improve the immediate continuation premise. A later move through $700 would need its own evidence of acceptance. Failure back below a reclaimed boundary would invalidate that specific breakout interpretation.
Base scenario: two-way trade between $668.61 and $689.69 would leave Friday’s range unresolved. Consolidation can preserve part of the rebound without confirming extension. The average updates with new bars; $651.87 is a capture-time observation.
Bear scenario: losing $668.61 and failing to recover it would challenge the rebound. The updated EMA would then be a farther observation zone. A sustained reclaim of the lost daily low would weaken that breakdown case. Neither the average nor the round number guarantees a fill or a reversal.
Risk — A better financial bridge does not select an entry
The next session can gap across a trigger or invalidation. This daily image cannot measure intraday liquidity, an options spread, implied volatility or time decay. The company’s business cycle and the stock’s daily price cycle can move at different speeds. The chart cannot prove that a particular operating-profit bar caused Friday’s advance.
Use the bridge to sharpen the business question and a fresh price observation to test the trading scenario. This is educational research, with no asserted HPT holding, executed trade, prescribed position size or realized return.
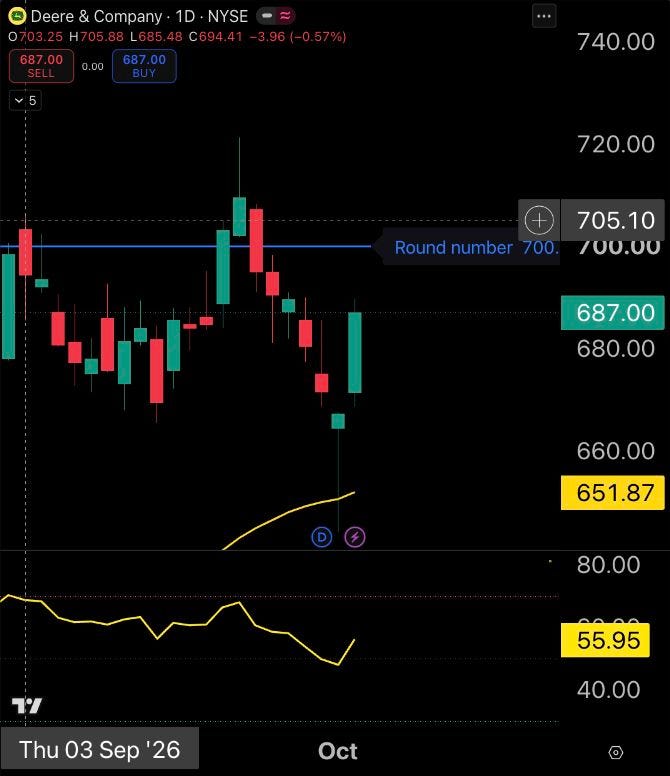
Source: genuine TradingView publisher-owned chart; requested NYSE:DE, observed BATS:DE / NYSE by Cboe One, daily (1D). Captured October 3, 2026 at approximately 3:02 p.m. America/Chicago. Saturday equity market closed; latest completed candle October 2. Established 55-day EMA $651.87; RSI(14) 55.95 is the only lower panel. Focused September–October historical image; indicators update with later bars. The $700 line is a round-number reference. No live weekend quote, causal proof, forecast or guaranteed execution.
Sources and evidence limits
Deere third-quarter presentation — August 20, 2026, Production & Precision Ag profit bridge
Deere third-quarter release — August 20, 2026, results and management forecast
Deere investor-relations calendar — checked October 3, 2026
The quarterly figures are historical results. The cycle bottom and full-year income range are management forecasts. The workshop example is invented for teaching. Demand-chain explanations and future price/business scenarios are analysis, not reported future outcomes.
Discussion: Which change in Deere’s next volume–price–cost bridge would persuade you that the farm cycle is turning, and which daily price failure would invalidate your rebound scenario?