
Macro — the cash market has not voted again
The important distinction after midnight is between a traded index contract and the underlying stock population. A positive futures indication can describe the direction of an active overnight market. It cannot by itself establish that yesterday’s declining issues recovered. The relevant cash session is closed, and the next full stock-market session has not yet supplied its own participation evidence.
This edition separates completed October 13 observations from delayed overnight indications. It does not combine them into a simultaneous live scoreboard. The four major US cash indexes ended lower: the S&P 500 at 7,805.45, the Dow at 51,670.10, the Nasdaq Composite at 27,204.38 and the Russell 2000 at 2,783.37. The S&P decline was only about 0.02%. That small headline change provides little information about how many individual securities participated.
The native Finviz dashboard inspected after midnight displayed 2,221 advancing and 3,141 declining issues. These are the dashboard’s broad stock population, not an asserted count of S&P 500 constituents or an exchange-specific advance/decline series. Decliners exceeded advancers by 920. The new-high/new-low displays also leaned weak: 112 new highs and 527 new lows. These separate counts do not prove a particular economic cause, identify institutional flows or supply a forecast of the next cash session.
By contrast, the native futures board observed around 12:15 AM America/Chicago showed positive generic indications: S&P futures +0.19%, Nasdaq 100 +0.15%, Dow +0.20% and Russell +0.26%. Finviz labels futures delayed by 15 minutes. Contract months were not established on that generic board, so these are explicitly directional displayed references rather than execution-ready contract quotes. No numerical futures level is translated into a cash-index entry or target.
The research question is whether the next cash session confirms that improvement across securities. A broadening advance would add a different kind of evidence. A higher headline index supported by only a few heavy constituents would leave the participation question open. Neither outcome can be read from the overnight contract alone.
Fundamental — sector leadership and the policy channel
The same native source’s sector-group table provides a second population check. It is the Finviz broad group universe, not the eleven official S&P sector indexes and not a portfolio of sector ETFs. Its displayed changes were Energy +1.62%, Communication Services +0.81%, Utilities +0.47%, Consumer Cyclical +0.05%, Technology -0.06%, Financial -0.18%, Real Estate -0.22%, Consumer Defensive -0.28%, Basic Materials -0.43%, Industrials -0.79% and Healthcare -1.44%. Four groups were positive and seven negative. The difference between the strongest and weakest displayed groups was 3.06 percentage points.
That ordering gives the flat benchmark more context. It suggests uneven group performance within this source’s population. It does not permit an analyst to substitute a sector-group average for the experience of every company in the group. Weighting, constituents and aggregation conventions matter. A claim that the entire economy is healthy or impaired would require operating evidence beyond a single day’s group-price changes.
Rates and commodities also need their own cutoffs. Reuters’ October 13 closing report put the benchmark ten-year Treasury yield at 5.22%, Brent at $105.69 a barrel after a 0.9% decline, and the dollar index down 0.34%. Those are report-specific closing or late-session observations, not fresh midnight yields. A subsequent Reuters gold report identified spot gold at $4,159.45 an ounce at 02:51 UTC on October 14. The named spot reference avoids relabeling the generic futures figure as spot or assuming an unspecified futures month.
These markets can affect equity valuations through different channels. A higher required discount rate can reduce the present value assigned to distant earnings. Energy prices can affect input costs and consumer purchasing power. Currency changes can alter translation for international revenues. Those mechanisms are analytical possibilities, not proof that one observed variable caused all of Tuesday’s price changes.
The next dated macro checkpoint is the US consumer-price report discussed in the October 14 Reuters gold report, due at 12:30 UTC, or 7:30 AM America/Chicago. The release can change policy expectations and the relationship between futures and cash trading. Its result is not known at this article’s research cutoff. A scenario should therefore define the evidence it needs rather than pretending the number or the market response has already occurred.
Technical — a large-cap reference does not stand in for breadth
The technical section uses the S&P 100 daily index reference in a newly captured genuine TradingView chart on the dedicated publication layout. Its completed-session close was 3,892.48, with a daily high of 3,900.78 and low of 3,888.03. The established 55-day EMA was 3,805.94 and RSI(14) was 60.26. The native delayed index feed was closed at capture. The legend and price axis agreed after clearing a historical hover, and the only lower panel was RSI.
A constructive price scenario requires sustained acceptance above 3,900.78, followed by retention rather than a brief crossing. That would strengthen the price test at this large-cap reference. It would still need independent breadth confirmation from the next cash population. A pullback holding above the observed daily low could preserve the latest narrow range, but holding a range is a different statement from widespread stock-market participation.
A break below 3,888.03 followed by a failed reclaim would weaken that narrow-range scenario. The 55 EMA is a separate moving trend reference, substantially below the latest close; it should not be described as an executable stop or as a guarantee of support. RSI above 50 describes the current calculation’s momentum orientation, not a prediction that the next candle must be positive.
The useful pairing is price confirmation plus participation confirmation. If the index improves but the stock population remains weak, acknowledge the disagreement. If both improve, preserve the source universes and session cutoffs so the change can be evaluated honestly. An apparent contradiction often disappears once the analyst stops asking two different measurements to answer the same question.
This is market research and education, not a position recommendation, promised return or assertion of unseen order flow. What cash-session participation evidence would you require before calling an overnight futures improvement a broader recovery?
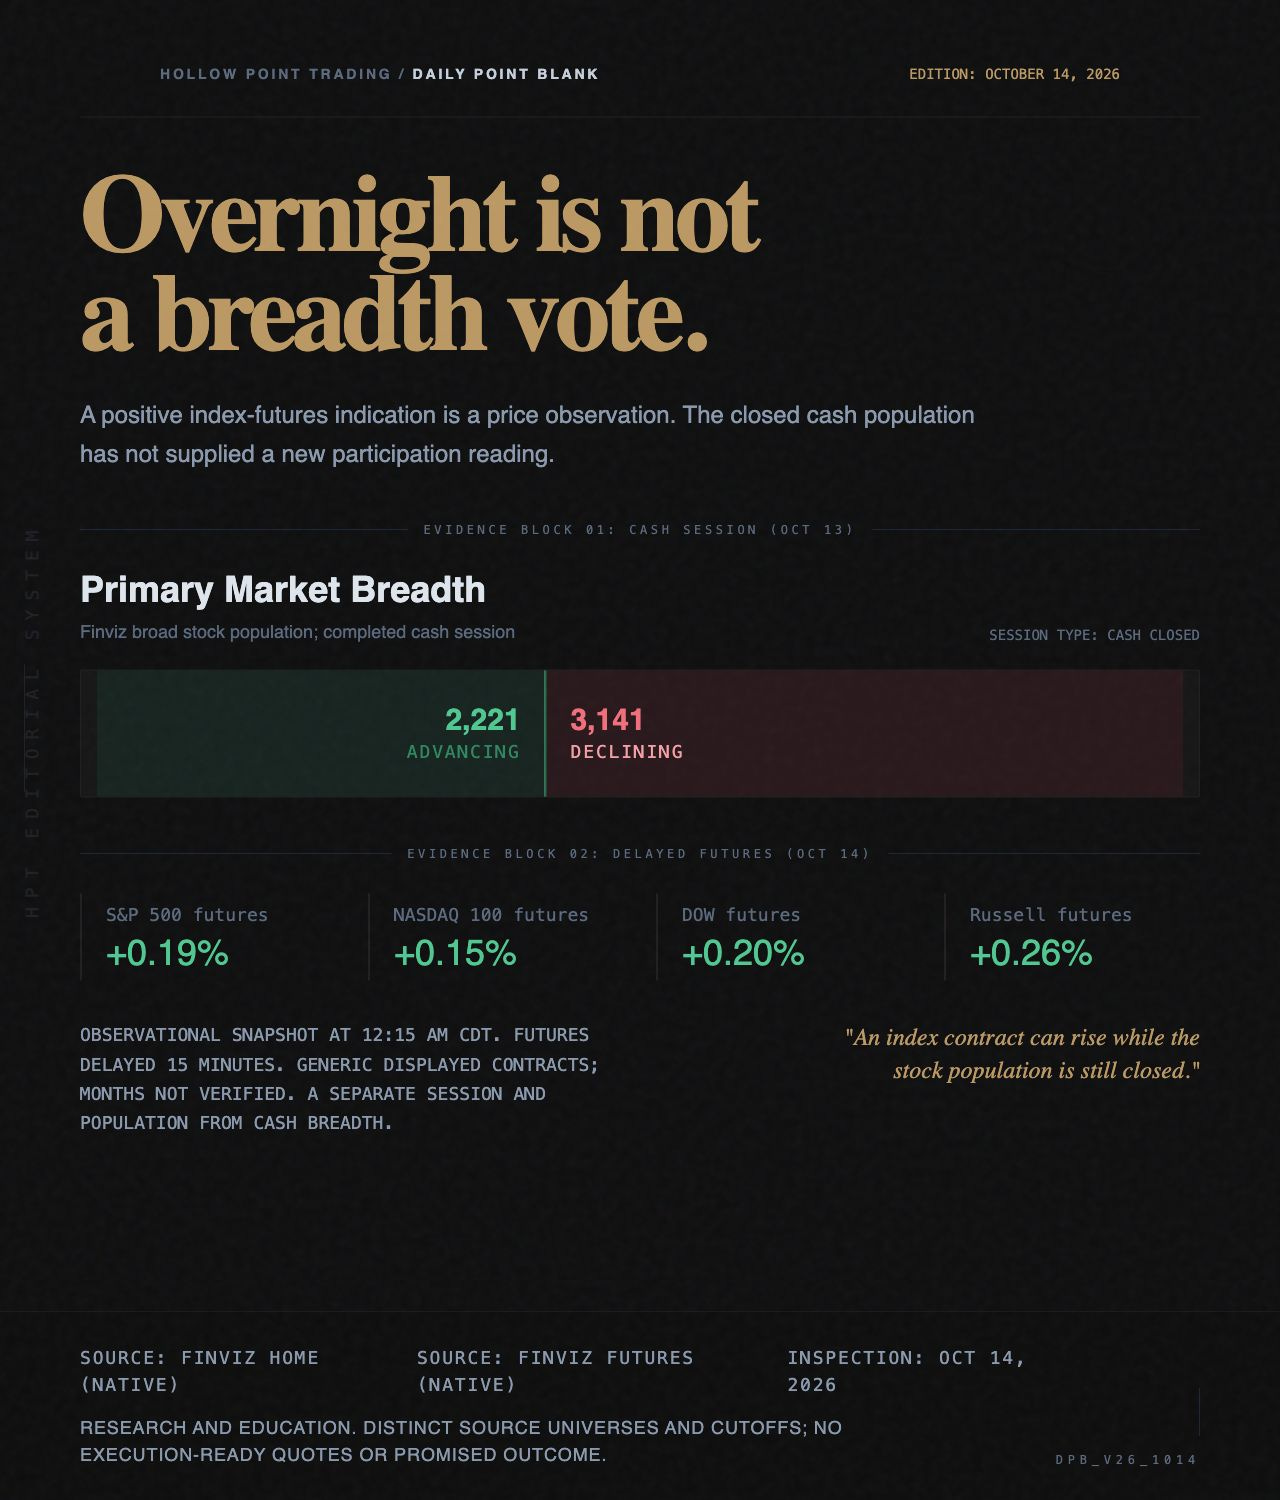
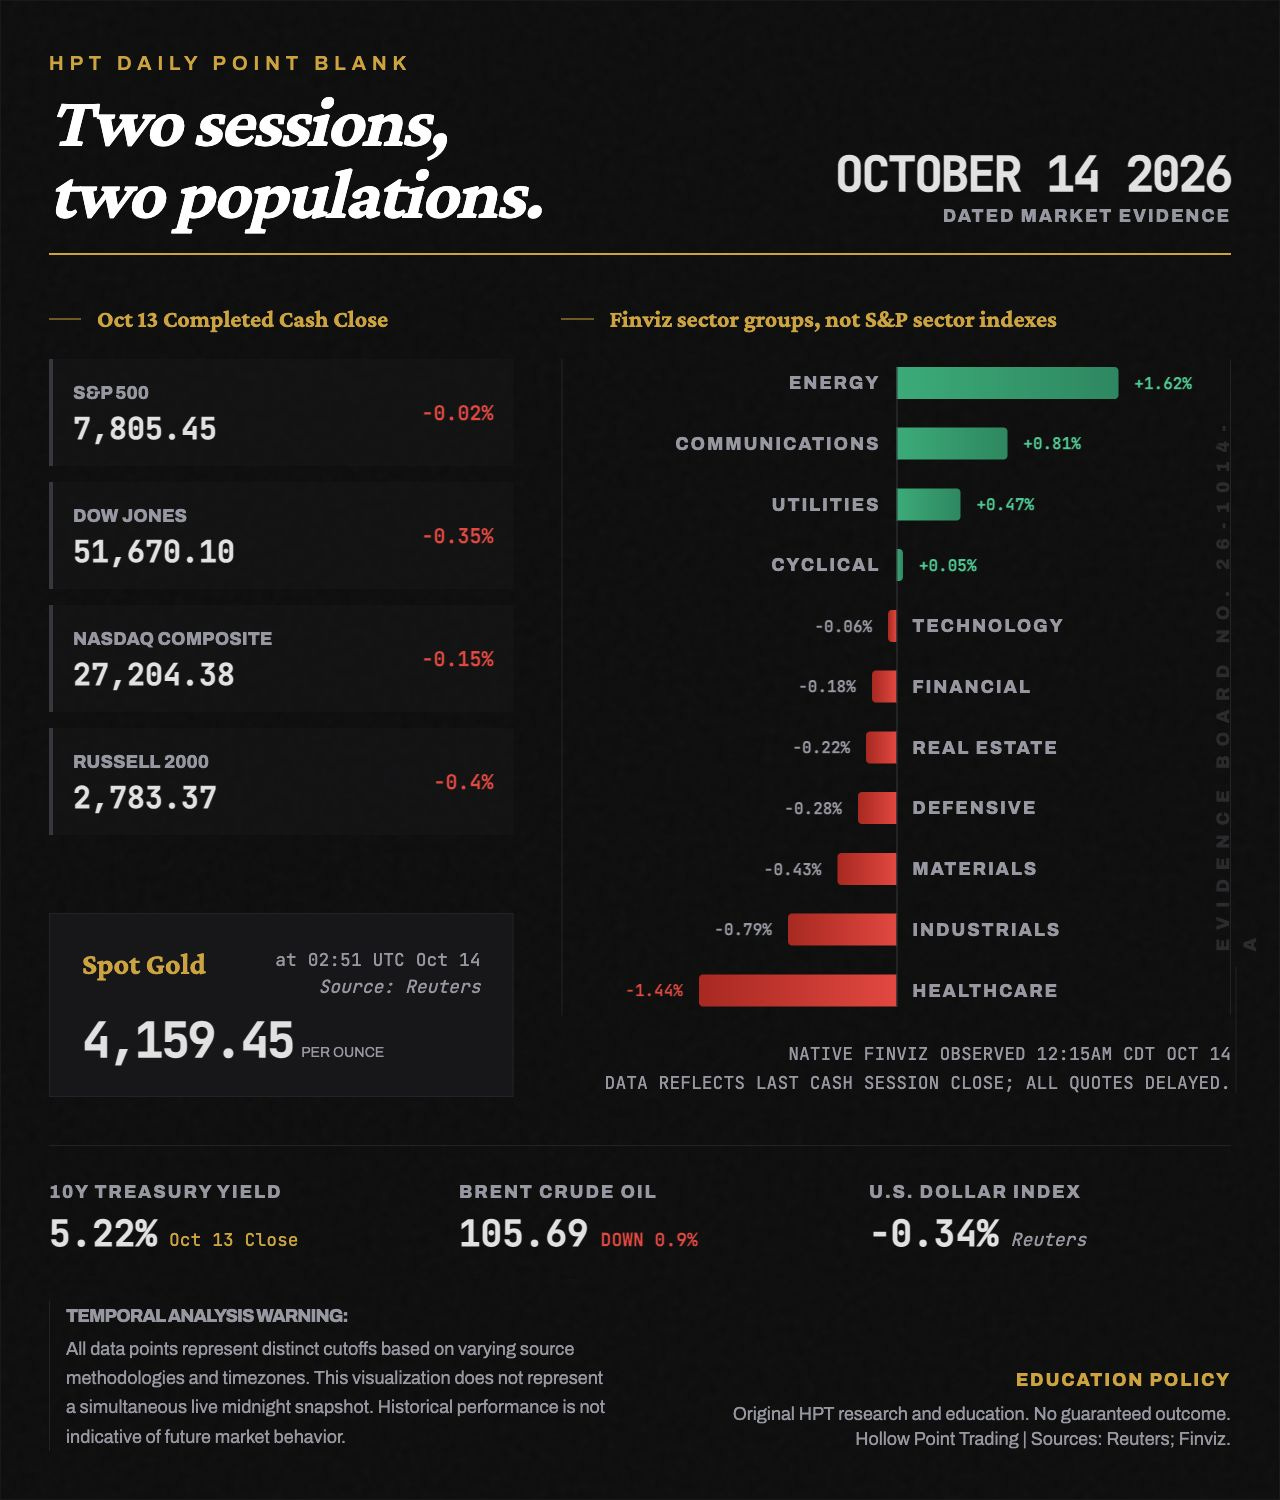
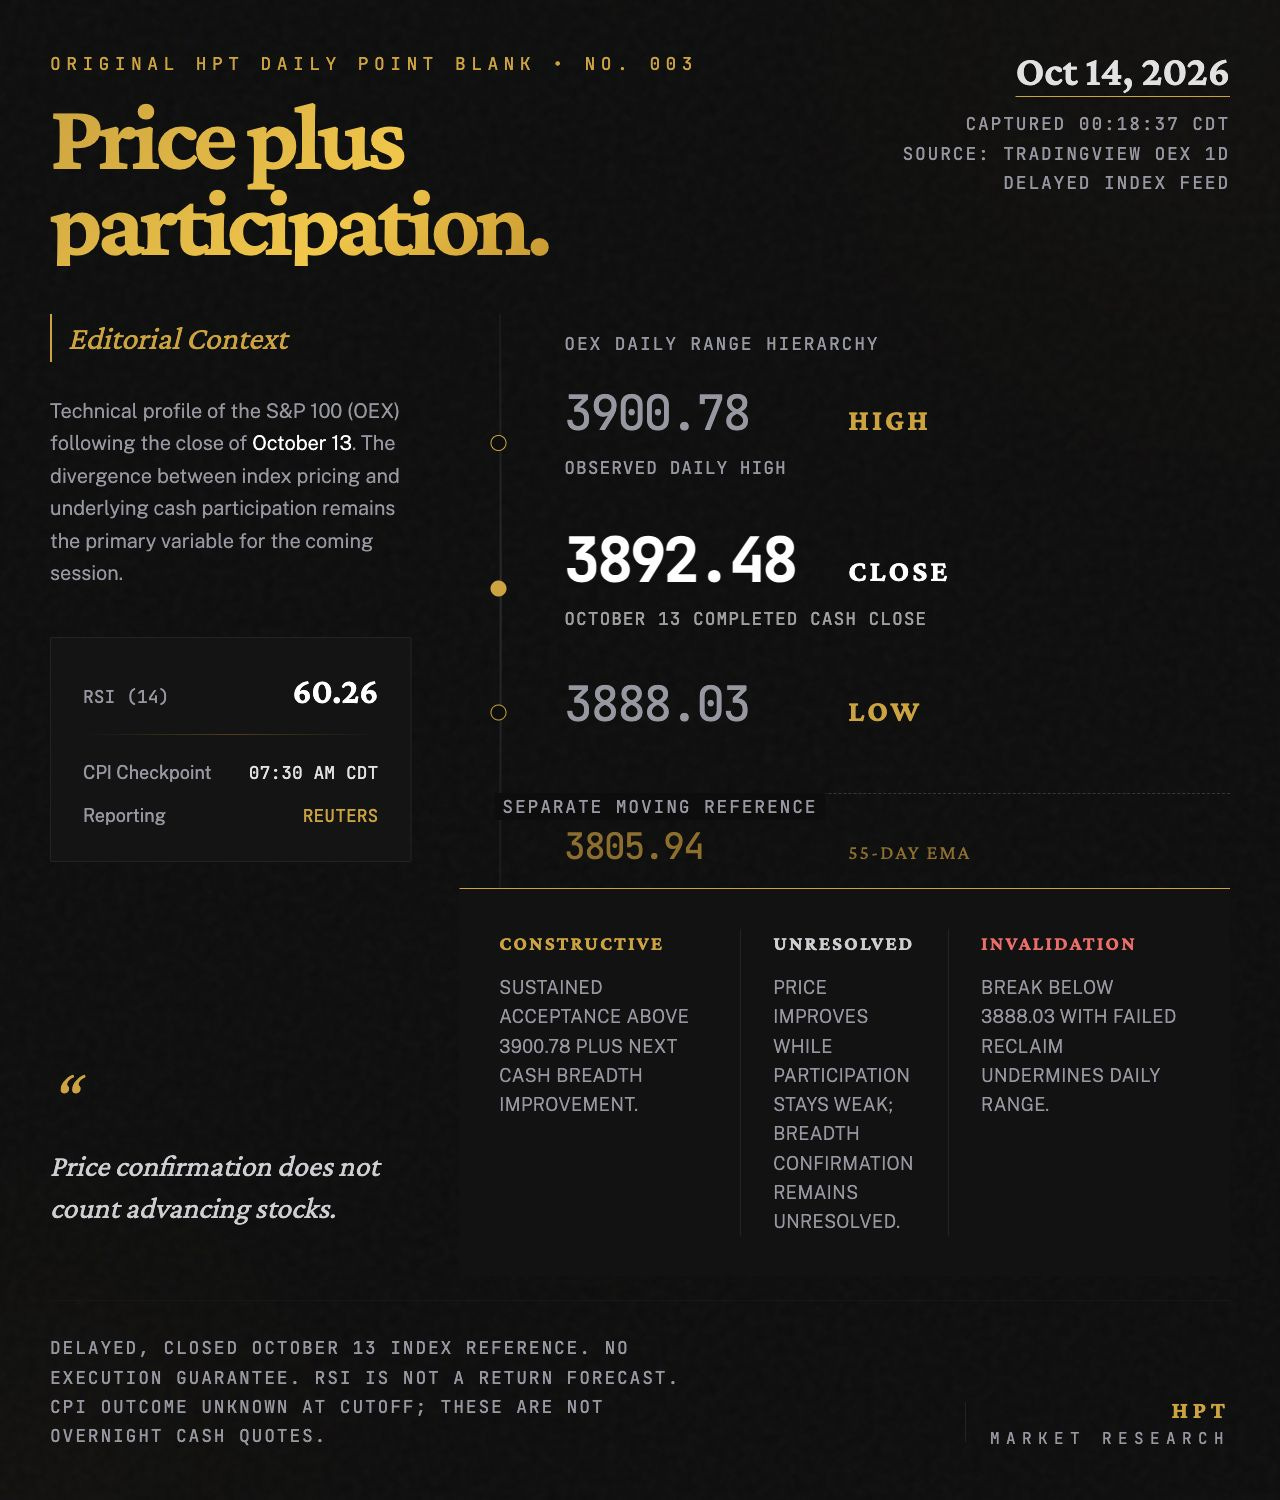
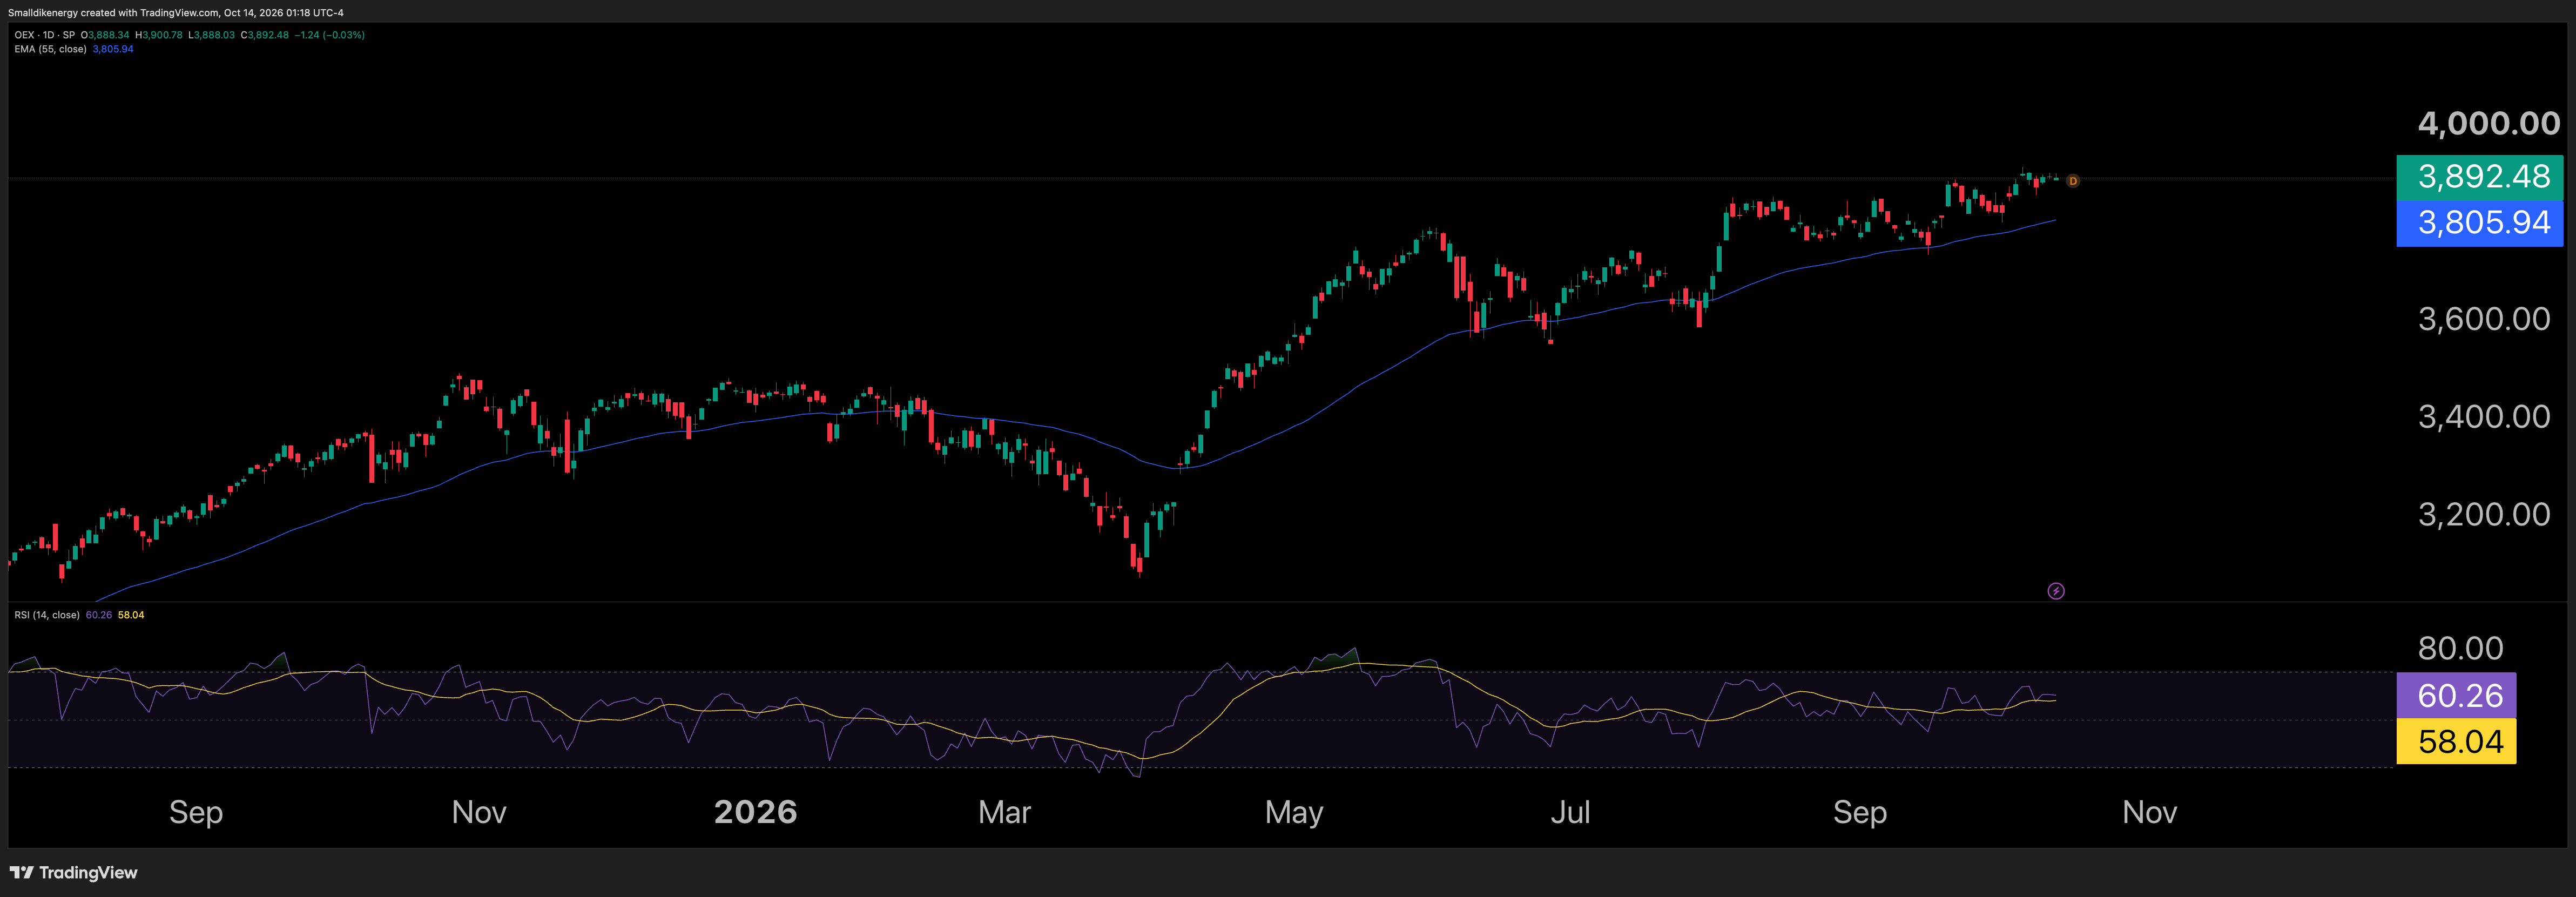
Image captions
Panel one: Original HPT cash-population and overnight-futures comparison. Finviz native dashboard and generic futures board observed October14 around00:15Chicago; futures delayed15minutes. No contract-month or execution quote claim. Broad stock population, not an exchange-specific or S&P constituent count.
Panel two: Original HPT market evidence board. Completed October13 cash closes, native Finviz broad sector groups, and separately dated Reuters rates/oil/dollar and spot-gold references. The groups are not official S&P sector indexes. Sources retain distinct cutoffs; no simultaneous live midnight board.
Panel three: Original HPT conditional price-and-participation map. S&P100 October13 completed daily reference, genuine TradingView SP delayed feed; 55EMA and RSI-only lower panel. Numerical hierarchy is schematic, not a scaled chart or synthetic candles. No automatic order or guaranteed level.
Chart: Genuine TradingView native OEX1D export October14 at00:18:37America/Chicago, dedicated agent-owned publication layout, SP delayed index feed. October13 latest candle date independently read back. Established55EMA and RSI(14)-only lower panel; candles, legend and price scale visually agree. Completed cash session, not an overnight cash quote.
Sources checked October14,2026
Reuters October13 closing cross-asset report,17:31Eastern update: https://www.marketscreener.com/news/world-stocks-dip-on-ai-spending-concerns-brent-settles-lower-ce785dd2d980f624
Reuters October14 gold report,spot reference02:51UTC: https://www.marketscreener.com/news/gold-prices-hold-firm-ahead-of-us-inflation-data-ce785dd2d880f326
AP October13 completed US index closes: https://apnews.com/article/a0a577dfd12f63ee6780a56ab02b55c4
Native Finviz broad stock population and sector groups:
https://finviz.com/
https://finviz.com/groups?g=sector&v=140
Native Finviz delayed generic futures: https://finviz.com/futures