
A refinery can run close to full capacity and still earn less on every barrel it processes. That is the tension worth carrying into Chevron’s next earnings discussion. The operating achievement tells us something about use of equipment. It does not supply the price spread, cost structure or corporate profit contribution needed to value that achievement.
This October 3 Saturday evening study focuses on CVX’s refinery utilization disclosure and the October 30 reporting checkpoint. U.S. equity markets are closed. The supporting daily chart was captured anew tonight through the completed October 2 candle. Its prices are historical observations from a specified feed, not weekend trading quotes.
Macro: A barrel has different economics before and after refining
Start with the business route. Upstream operations produce oil and gas. Refining transforms purchased or internally supplied feedstock into products. A higher crude price can support a producer’s realization while raising a refinery’s input cost. Whether refining economics improve depends on product prices relative to that input, alongside operating expenses and the products the facility actually makes.
An integrated company therefore needs more than a one-direction oil thesis. Investors should separate production exposure from processing exposure and examine how the different businesses contribute. Integration can diversify economic sensitivities, but it does not guarantee that one segment will offset another by the right amount in every quarter. The relationship needs to be demonstrated in the accounts.
There is no new commodity price claim in this weekend edition. The macro question is how to interpret the next operating bridge: did more activity meet better unit economics, or did throughput increase while the spread narrowed? Those paths can produce different financial outcomes even when the facilities are equally busy.
Fundamental: The disclosed 97% describes capacity use
Chevron’s July 31 second-quarter release reports record crude-unit throughput at its U.S. refineries and crude-unit utilization of 97%. It also reports worldwide production up 20% from the prior year. Company-wide reported earnings were $12.1 billion and adjusted earnings were $12.0 billion. These are historical second-quarter disclosures. Neither corporate earnings total is a measure of refinery profit alone. Source: Chevron’s second-quarter release.
The capacity measure answers how much of the relevant crude-unit capacity was used over the stated period. It does not mean that 97% of sales became profit. Nor does it reveal the margin earned on the last incremental barrel. A record throughput statement can be operationally meaningful while leaving the financial question open.
The margin worksheet: Give volume and economics separate columns
Consider an invented miniature refinery with capacity to process 100 units during a period. At 97% utilization it processes 97 units. If each unit contributes two dollars after the variable costs included in this simplified example, contribution is $194 before fixed costs. If unit contribution falls to one dollar while utilization remains 97%, contribution falls to $97. The plant is just as busy, but the simplified contribution is half as large. These are teaching assumptions, not Chevron volumes, costs or margins.
Now compare a less busy period: 90 units at two dollars each produce $180 before fixed costs. The 97-unit period at one dollar produces less contribution despite processing more. Volume growth does not settle the profit question. The size of the margin change can outweigh the activity change, and the full financial model still requires fixed costs and the company’s actual accounting definitions.
The same worksheet prevents an overconfident upside estimate. With utilization already high, an analyst should not assume unlimited further volume growth from the same equipment. Additional throughput may require more available capacity, fewer interruptions or a changed operating configuration. The 97% disclosure alone does not quantify those possibilities or establish the cost of achieving them.
For the next results, I would track crude-unit throughput, relevant capacity, refining earnings and management’s explanation of margin and expense changes together. Keep geography and periods consistent. A U.S. utilization figure should not quietly become a worldwide profitability measure. An aggregate earnings improvement should not be attributed entirely to refinery activity when the company also has substantial production exposure.
The catalyst: October 30 supplies the next financial checkpoint
Chevron’s investor-relations event page schedules its third-quarter 2026 conference call for Friday, October 30 at 11 a.m. EDT, or 10 a.m. CT. It says the earnings release, data supplement, presentation and prepared remarks will be available before the call. That is a planned event and document sequence, not third-quarter results already delivered. Source: Chevron’s announced event details.
My inference is that the operating disclosures can help distinguish capacity execution from unit economics when that update arrives. I am not forecasting a particular refining margin or corporate earnings number. If the upcoming materials do not provide a comparable bridge, the uncertainty remains. A strong utilization headline cannot fill an undisclosed profit line.
Technical: A recovery is consolidating above the 55 EMA
The fresh TradingView chart requests NYSE:CVX and displays Chevron through NYSE by Cboe One, identified as BATS:CVX, on daily candles. Friday’s completed bar opened at $204.80, reached $207.32, traded down to $204.45 and closed at $206.69. The established 55-day EMA reads $201.47. RSI(14), the only lower panel, reads 51.65. These are dated, feed-specific observations.
The June-to-October framing shows the summer recovery, September’s higher peak and the recent consolidation. Price remains above the rising average, but the latest close is below the displayed $208.25 swing high. RSI is only modestly above its 50 midpoint. That combination leaves a constructive trend relationship with an unfinished local breakout.
A continuation scenario needs a future daily close above $208.25 followed by a retest that holds. Friday’s $207.32 high is the first nearer hurdle. A quick excursion above either reference followed by rejection would supply weaker evidence than retained acceptance. The older September peak near the displayed $217.50 area is distant context, not an automatic destination.
The base scenario is continued balance between the displayed $202.70 swing low and $208.25 ceiling. The selected-swing midpoint is $205.48, while the separate control-candle midpoint is $205.12; their different anchors explain their different values. Movement around that cluster can describe consolidation without confirming a new advance. The chart’s $206.13 retracement is another selected-swing reference, not an independent guarantee of support.
The bearish scenario begins with a daily loss of $202.70 followed by failure to reclaim it. The EMA at $201.47 and the marked $200 round number then become nearby reassessment references. The EMA will change with new daily bars. Acceptance beneath the updated average and $200 would weaken the wider recovery interpretation; no precise lower target is asserted from this static image.
Risk: A busy plant and a confirmed breakout need different evidence
The proposed continuation fails if an attempted $208.25 reclaim cannot hold and the stock subsequently closes beneath $202.70. The business interpretation must separately answer to the reported volume, margin and expense bridge. A successful chart retest cannot prove refining profitability, and a utilization figure cannot validate an entry.
Use actual prices, spreads and liquidity when the equity session reopens. The October 30 event can gap through planned exit levels; options add time decay and volatility exposure. This is educational analysis with no HPT position, executed trade, realized return or guaranteed outcome claimed. The goal is to make the next observation decisive enough to revise the view.
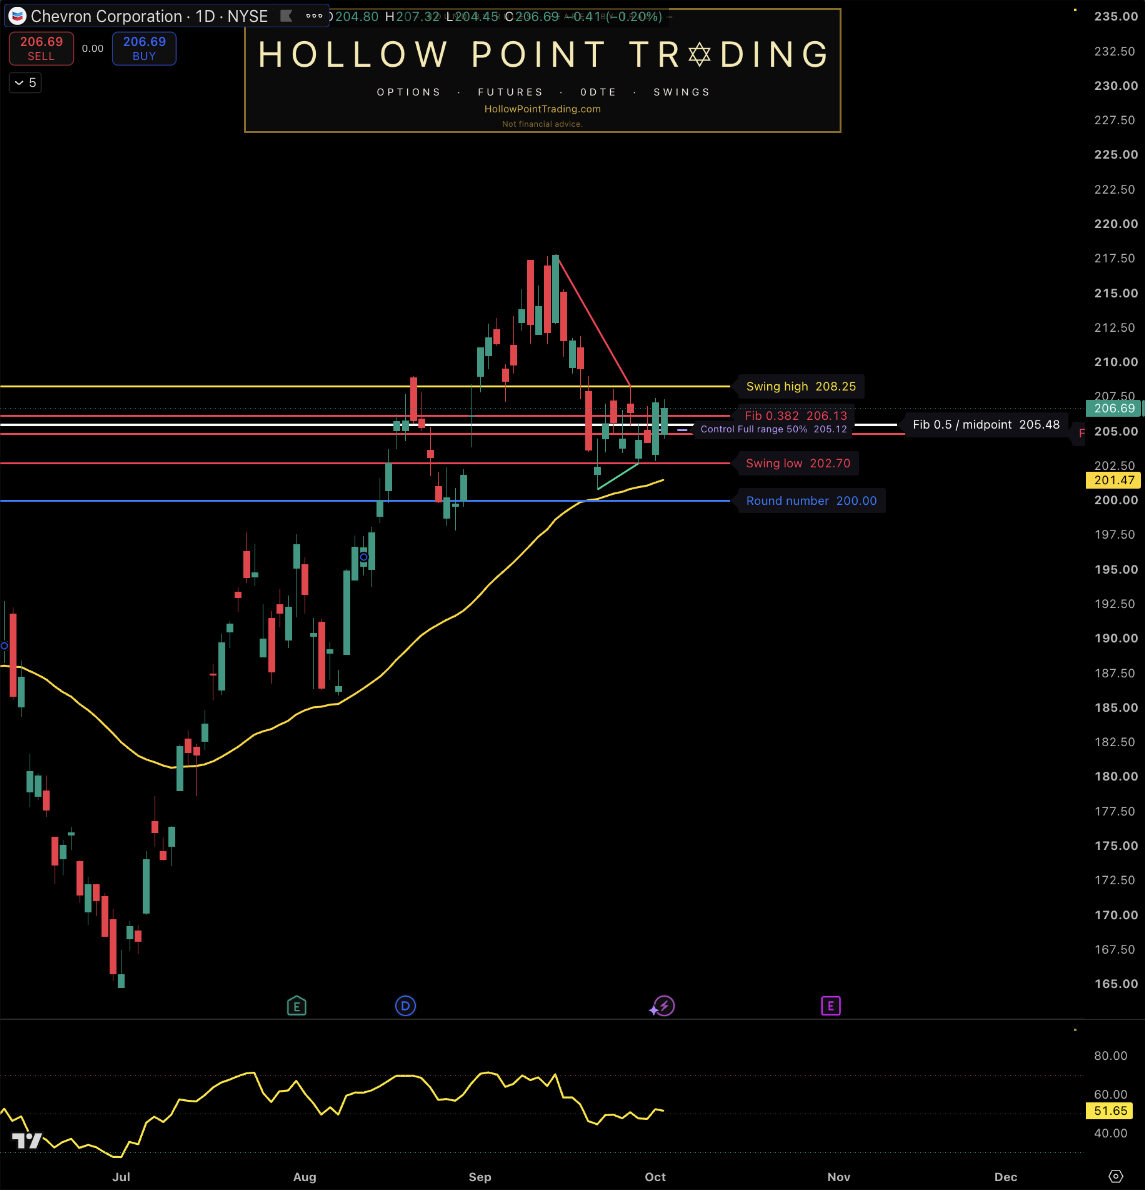
Source: TradingView, requested NYSE:CVX, observed BATS:CVX / NYSE by Cboe One; daily (1D). Captured October 3, 2026 at approximately 8:39 p.m. CT. Saturday equity market closed; latest completed candle October 2. June–October recovery/consolidation frame; established EMA(55) $201.47 and RSI(14) 51.65, the sole lower panel. Swing and control references use different anchors. Static feed-specific image does not establish causation, live weekend prices, refining margins or executable terms.
Sources and discussion
Chevron — July 31, 2026 second-quarter results and operating measures
Chevron investor relations — October 30 third-quarter conference-call schedule
TradingView — fresh publisher-owned CVX daily chart
Discussion: What combination of throughput, margin and expense evidence would make Chevron’s high utilization more valuable to you, and what daily price behavior would distinguish a durable $208.25 breakout from another rejection?