
A gasoline pump can make a retailer’s sales growth look faster without telling you how many extra households shopped its aisles. Costco’s latest report supplies both a reported comparable-sales figure and a version that removes gasoline-price and currency effects. Reading the pair together is more useful than choosing whichever percentage makes the strongest headline.
This October 4 Sunday study examines that comparison after the September 24 fiscal-year results. U.S. equity markets are closed. The chart is a new capture of completed daily candles through October 2, rather than a live Sunday quote. The next market session can test price acceptance; subsequent operating disclosures can test whether the commercial trend persists.
Macro: The consumer basket has a price component
Retail sits where household spending meets merchandise prices. Warehouse clubs add a particular business model to that broad sector: customers combine recurring shopping with membership access and a value proposition. Within that model, the dollar value of a basket can change because the quantity, mix or prices of purchases change. A larger dollar total alone does not identify which mechanism did the work.
Gasoline makes the distinction especially visible. The same physical volume sold at a higher price can generate more dollars. Foreign exchange creates a second translation issue for an international business: local-currency activity can look different when reported in dollars. Neither effect makes the reported sale unreal. It changes what question a growth statistic can answer.
For a weekend research process, build the comparison before predicting the consumer. Put the reported number beside the adjusted number, keep their periods aligned, and then ask what additional evidence is missing. The adjustment is useful for isolating specified influences. It does not by itself measure shopping trips, units per trip, customer income or merchandise profitability.
Fundamental: Costco’s two comparable-sales readings
Costco’s September 24 release reports total-company comparable sales up 9.4% for its 16-week fourth quarter, versus 6.7% excluding gasoline-price and foreign-exchange changes. The 2.7-percentage-point spread is calculated from those disclosed rates. Both describe growth; their different definitions prevent treating them as interchangeable evidence.
The release also reports quarter net sales of approximately $93.9 billion, up 11.2%. Net sales and comparable sales have different scopes. Costco explicitly treats the comparable metrics as supplemental information rather than substitutes for GAAP net sales. A complete reading therefore keeps the actual dollar total alongside the comparable measure.
The useful inference is restrained: the specified adjustment materially changes the quarter’s growth reading, while the adjusted comparison remains positive. This is not proof that every customer bought more units, and the spread is not a disclosed dollar estimate of incremental profit. Subtracting two growth rates does not supply a margin, a basket count or a separate gasoline-income statement.
The teaching point: A percentage-point bridge is not a profit bridge
Consider an illustrative store that sells the same number of gallons at a higher pump price. Its gasoline revenue can rise while its gross profit depends on the difference between selling price and cost. A second illustrative store can sell more merchandise while its mix shifts toward lower-margin products. These examples are arithmetic explanations, not estimates of Costco’s quarter.
That is why the next disclosure needs matched questions. Does the adjusted comparable trend hold? What does management disclose about shopping frequency, basket size and product mix? How do merchandise costs and operating expenses behave? A favorable answer to one question can coexist with an unfavorable answer to another. The operating thesis becomes more useful when it can survive that separation.
The source checked this morning did not expose a dated upcoming event on its events page, so no future release date is asserted here. The next operating update is a checkpoint when Costco actually publishes it. Record the new period and definitions before comparing it with this 16-week quarter. A shorter monthly window should not silently become an equivalent quarter or an annual forecast.
Technical: A rebound is approaching the declining average
The supporting TradingView chart requests NASDAQ:COST and displays the NASDAQ-listed company on the Cboe One feed, observed as BATS:COST. October 2’s completed daily bar opened at $921.18, reached $921.18, traded down to $909.66 and closed at $920.65. The established 55-day EMA reads $929.85. RSI(14), the sole lower panel, reads 51.36. These historical feed observations are not executable weekend prices.
The April-to-October view shows a sharp spring peak, subsequent weakness and a September rebound from the lower part of the visible range. The latest close remains under the declining EMA and the displayed $931.09 swing-high reference. Momentum has recovered around RSI’s midpoint, but price has not yet established acceptance above that overhead area.
The constructive scenario needs a future daily close through roughly $930–$931, followed by a pullback that holds the reclaimed area. The EMA moves with new candles, so update its value during that test. A close above resistance followed by immediate loss of the level would weaken the interpretation. A sustained reclaim would improve local structure while leaving the broader spring decline to be assessed separately.
The base case is continued rotation between the $900 round-number area and the $931.09 reference. The displayed $907.10 midpoint and $912.76 retracement are intermediate historical guides, not guarantees of a bounce. The bearish scenario is failure to recover overhead resistance, then a daily loss of $900 with a failed reclaim. The visible $883.10 swing-low reference becomes a subsequent observation area, without implying a certain destination.
Risk: Define what would change each conclusion
A proposed $930–$931 recovery loses its basis if the reclaimed area fails and price subsequently closes beneath $900. That price condition does not determine whether adjusted retail activity is healthy. Conversely, improving operating disclosures cannot guarantee that a chart level will hold. Keep the commercial inference and the market confirmation accountable to their respective evidence.
Use actual quotes, spreads and liquidity when the session reopens. News can gap through planned exits; options introduce volatility and time-decay exposure. This is educational analysis, with no HPT position, execution, realized return or promised result claimed. The practical goal is to state the next observation clearly enough that a changed fact can change the view.
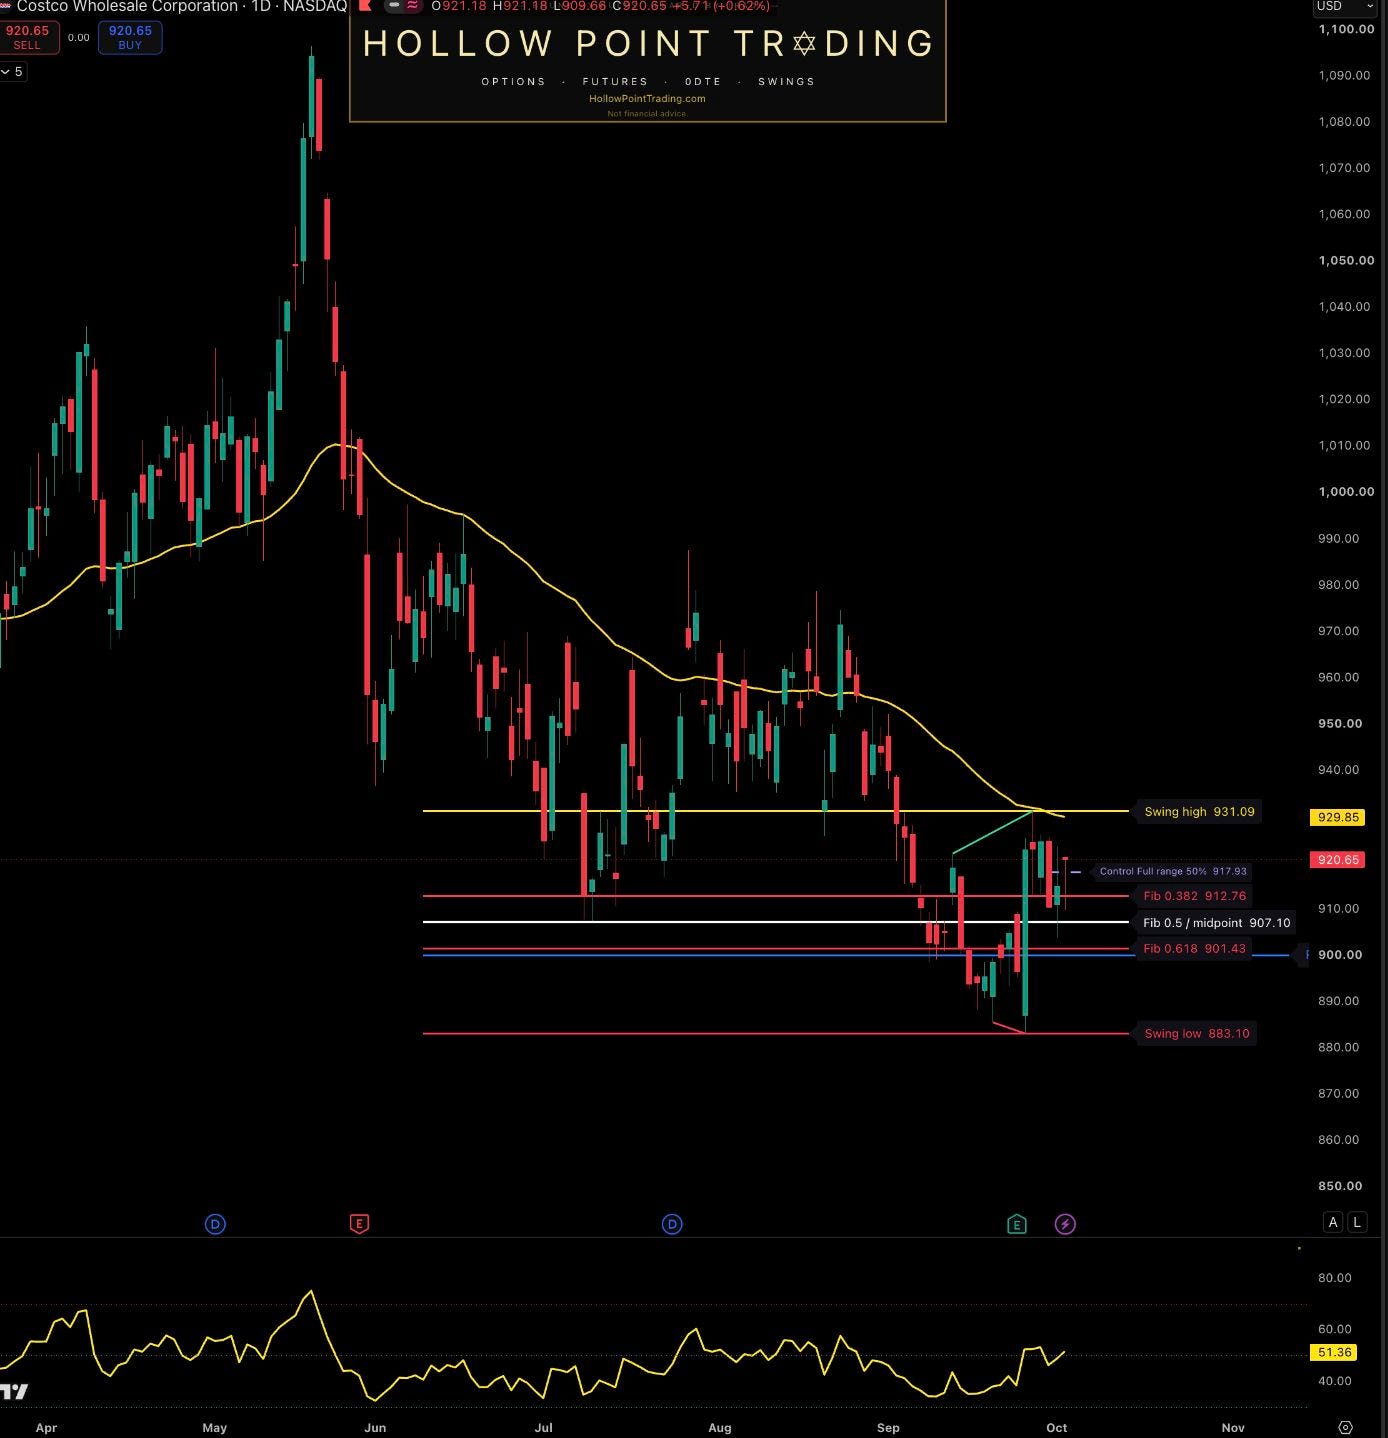
Source: TradingView, requested NASDAQ:COST, observed BATS:COST / NASDAQ by Cboe One, daily (1D). Captured October 4, 2026 at approximately 9:09 a.m. CT. Sunday equity market closed; latest completed candle October 2. April–October historical frame; established EMA(55) $929.85; RSI(14) 51.36 is the sole lower panel. Static feed-specific observations do not prove causation or supply live weekend execution prices.
Sources and discussion
Costco’s September 24 results — reported and adjusted comparable-sales definitions
Costco events page — checked October 4; no upcoming date asserted
TradingView — fresh publisher-owned COST daily chart
Discussion: Which operating disclosure would most clarify Costco’s adjusted sales trend, and what price behavior would convince you that a $930–$931 reclaim has held?