
A generator can sit behind an AI workload without every dollar earned by its manufacturer becoming AI revenue. That distinction matters for Caterpillar: the business story is stronger when we know which application is growing, and weaker when a broad segment is treated as a single theme.
This is Hollow Point Trading’s October 3, 2026, 2:30 p.m. Central weekend edition, prepared after its scheduled slot. U.S. equities are closed on Saturday. Today’s fresh chart capture shows Friday’s completed daily candle. The company evidence below is from its August 4 second-quarter release, not a newly reported October result.
Macro — Compute demand reaches industrial equipment through electricity
The physical side of computing creates an industrial research question. A planned facility needs usable power, and the equipment serving that need has its own procurement, manufacturing and installation sequence. The excitement surrounding software does not erase those steps. For an equipment supplier, the relevant transmission runs through the product that is purchased, the application it serves and the economics of supplying it.
Think of the chain as a series of separate decisions. A customer wants more computing capacity. It evaluates a site and its power needs. It chooses equipment and a delivery schedule. The supplier manufactures and fulfills that order. A problem at one stage can alter timing at another. This is a general analytical framework, not a claim that a specific Caterpillar order has been delayed or accelerated.
That framework makes application-level disclosure useful. “Industrial” is a broad market label; “power generation” narrows the activity. “Data-center applications” narrows it again. The more specific the evidence, the more specific the claim can be. An investor should not extend the narrowest label over the whole company simply because it makes a cleaner headline.
Fundamental — Start with the power-generation row
Caterpillar’s second-quarter release reports Power Generation sales of $3.098 billion, versus $2.407 billion a year earlier, a 29% increase. It says increases in large reciprocating engines and turbines and turbine-related services were primarily in data-center applications. Power & Energy total sales were $8.238 billion, up 17%; segment profit was $2.027 billion, up 30%, and its margin was 24.6% versus 22.1%.
The application table also includes Oil and Gas and Industrial, plus inter-segment sales. A reference to data centers in the growth commentary does not disclose a separate, comprehensive data-center revenue figure. Neither the $3.098 billion application row nor the $8.238 billion segment total can be relabeled as pure AI sales.
Map the claim before building the valuation argument
A useful research notebook has three columns: the disclosed category, what management says drove its change, and what remains unquantified. Put the power-generation row in the first column. Put the application commentary in the second. Leave the exact AI-only revenue share in the third. An empty cell can be more informative than a confident-looking invented number.
The exercise changes how one reads a strong quarter. A narrow demand driver can contribute to a larger business without defining every part of it. Other applications, internal sales and the cost of production still matter. A thematic argument becomes more durable when it survives that wider business map instead of depending on a slogan.
For a fictional example, imagine an equipment group selling 100 units across three uses. One use contributes 40 units, and management says a particular customer class drove most of that use’s growth. We still cannot conclude that all 40 units went to that class, or that all 100 units share its demand outlook. These units are invented for teaching; they are not Caterpillar estimates.
The company-wide result sets the context, not the attribution
The August 4 headline release reports company sales and revenues of $20.5 billion, up 24%, with operating margin of 20.9% versus 17.3%. It attributes the sales increase primarily to higher volume and favorable price realization. That is historical operating context for the power discussion. It does not demonstrate that the entire company’s growth came from data centers.
The business case to test at a subsequent release is persistence: does the application continue contributing while profitability holds up? A stronger answer would combine continued application demand with sound operating economics. A weaker answer could include a slowing application or costs that consume the benefit of higher activity. These are research scenarios, not announced third-quarter outcomes.
Use the next official results announcement to confirm the reporting date before building an event trade. This article does not assume an unverified future earnings date. A calendar entry from a third party and an issuer-confirmed event are different levels of evidence. The historical quarter is enough to formulate the question; it is not enough to answer the next one.
Technical — Friday moved above the average, but left an upper wick
The new TradingView daily capture shows Caterpillar’s NYSE listing on the Cboe One feed, identified internally as BATS:CAT. October 2 opened at $840.80, reached $858.87, traded down to $836.46 and closed at $845.42, up 2.31%. The established 55-day EMA is $832.34. RSI(14), the sole lower panel, reads 58.82.
The focused September-to-October view shows a recovery out of the visible dip. Friday’s entire displayed candle range is above the average, while the close is below its session high. Those observations describe the structure without telling us which buyer caused it. The chart cannot establish that a particular earnings disclosure, data-center order or investor narrative produced Friday’s advance.
Bull scenario: a later test that retains the updated 55-day EMA would support a continuation premise. Acceptance above $858.87 would then clear Friday’s upper boundary. A brief move above the high followed by a failure back underneath it would undermine that specific breakout interpretation. Wait for the type of confirmation appropriate to the timeframe; this is not a prescribed trade.
Base scenario: movement between Friday’s $836.46 low and $858.87 high would leave the latest daily range in play. A stock can consolidate above an average without delivering an immediate extension. The average updates with new daily bars, so do not treat today’s $832.34 reading as permanently fixed.
Bear scenario: losing $836.46 would first challenge Friday’s range. A failed recovery of the average would make the larger repair less convincing. The visible $800 round-number line is a farther observation reference, not guaranteed support or a target. A sustained reclaim of the lost boundary would weaken the breakdown case.
Risk — An application thesis and an entry are separate decisions
The stock can gap when the next session opens, crossing a reference without offering the retest a trader expected. Options add spreads, implied volatility and time decay that this daily image does not show. RSI above 50 is a description of daily momentum, not a guarantee that momentum will persist. Use a newer capture when later candles arrive.
Keep the claim as precise as the disclosure and the setup as conditional as the price evidence. This is educational research, with no asserted HPT holding, executed trade, prescribed position size or realized return.
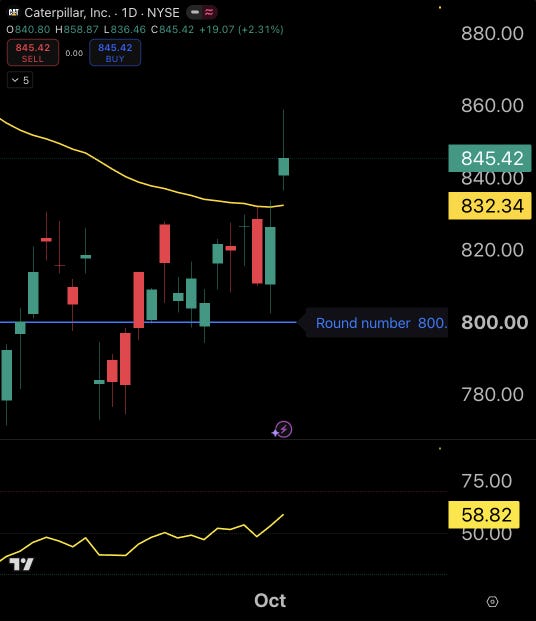
Source: genuine TradingView publisher-owned chart; requested NYSE:CAT, observed BATS:CAT / NYSE by Cboe One, daily (1D). Captured October 3, 2026 at approximately 2:32 p.m. America/Chicago. Saturday equity market closed; latest completed candle October 2. Established 55-day EMA $832.34; RSI(14) 58.82 is the only lower panel. Focused September–October historical, feed-specific image; later bars change indicators, and a daily candle does not show intraday execution. The $800 line is a round-number reference. No live weekend quote, forecast or guaranteed fill.
Sources and evidence limits
Caterpillar full second-quarter results — August 4, 2026, Power & Energy application table
Caterpillar second-quarter headline results — August 4, 2026
Company figures are historical reported results. The fictional equipment group is a teaching illustration. Demand transmission, future business tests and price scenarios are analysis, not actual third-quarter results. No undisclosed AI-only revenue allocation or unverified future reporting date is assumed.
Discussion: What application-level evidence would make you more confident in Caterpillar’s data-center power thesis, and which daily price failure would invalidate your continuation scenario?