
Every platform ships with MACD. Every beginner turns it on in week one. And almost nobody uses it the way it was actually built to be used. They trade every crossover, ignore where those crossovers happen, treat a lagging tool like a crystal ball, and then blame the indicator when it whipsaws them out of three trades in a morning.
This is the guide that fixes that. By the end you'll understand exactly what MACD is made of, what each of its three parts is actually telling you, how to read momentum shifting before the cross prints, why the zero line changes the entire meaning of a signal, how to spot the divergence that front-runs reversals, how the tool behaves differently in a trend, a chop, and a high-volatility flush, and — most importantly — how to stop MACD from lying to you by pairing it with the right tools. Real numbers, real setups, and the mistakes that quietly bleed accounts.
This is meant to be the last MACD guide you ever need to read. It is long on purpose. Momentum is the single most misunderstood concept in retail trading, and MACD is the instrument most people use to misunderstand it. We're going to take it apart to the bolts and put it back together so it actually works in your hands.
Let's build it from the ground up.
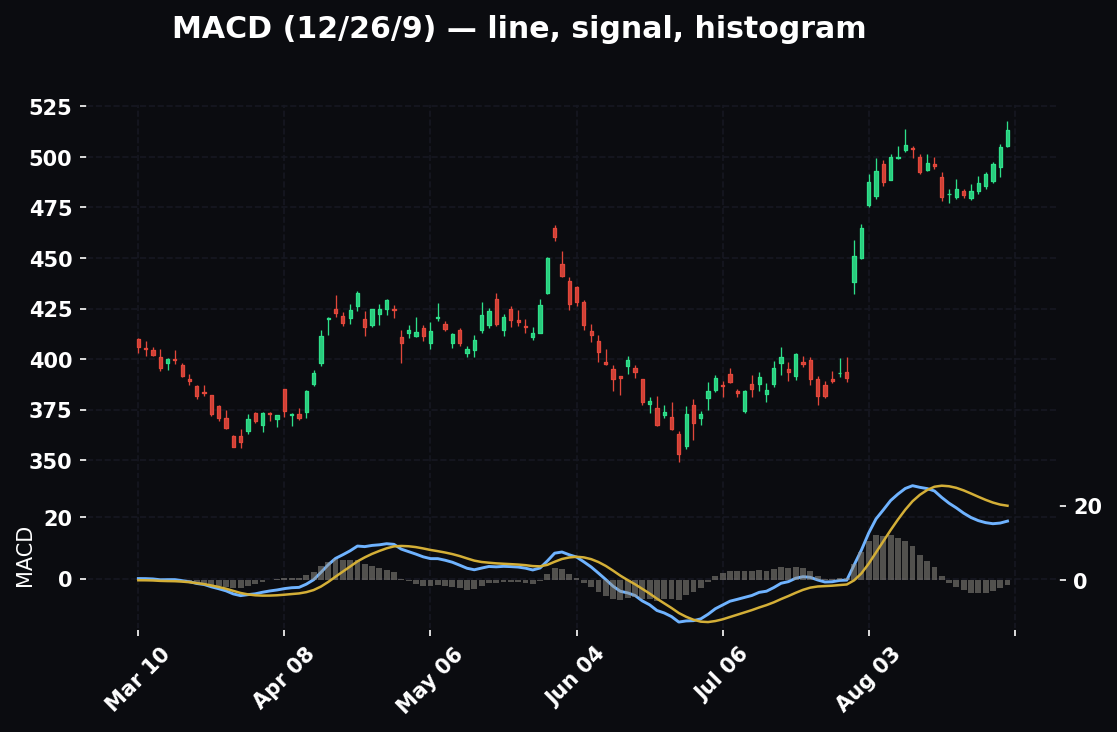
What MACD Actually Is
MACD stands for Moving Average Convergence Divergence. Gerald Appel built it in the late 1970s, and the name tells you the whole story if you slow down and read it: it measures whether two moving averages are pulling apart (diverging) or coming together (converging). That's it. It's a momentum tool disguised as a trend tool, and confusing those two things is where most people go wrong.
Here's the construction, piece by piece. First, a definition you'll need: an EMA — exponential moving average — is just an average price over a set number of bars that weights recent bars more heavily than old ones, so it reacts faster than a plain average. When someone says "the 12 EMA," they mean the average of roughly the last twelve closes, tilted toward the most recent.
MACD is built from three components.
1. The MACD line
Take the 12-period EMA and subtract the 26-period EMA.
MACD line = EMA(12) − EMA(26)
That's the entire calculation for the main line. When the fast 12 EMA is above the slow 26 EMA, that subtraction gives a positive number and the line sits above zero. When the fast is below the slow, you get a negative number and the line drops below zero. The MACD line is literally a live readout of the distance between two moving averages.
2. The signal line
Take a 9-period EMA of the MACD line itself.
Signal line = EMA(9) of the MACD line
This is a smoothed, slower version of the MACD line. It's the MACD line's own moving average. Its whole job is to lag the MACD line slightly so that when the two cross, you get a discrete event to react to.
3. The histogram
Subtract the signal line from the MACD line and draw it as bars.
Histogram = MACD line − signal line
When the MACD line is above its signal line, the histogram bars are positive (above zero). When it's below, the bars are negative. The histogram measures the gap between the two lines — and as you'll see, that gap is the most valuable and most-ignored part of the whole indicator.
So the standard notation "MACD (12, 26, 9)" just means: fast EMA 12, slow EMA 26, signal EMA 9. Those are Appel's original defaults and they remain the convention across virtually every charting platform, which matters more than you'd think — because everyone is watching the same numbers, the levels those numbers produce carry weight.
A note on units, and why your MACD looks different from mine
One thing that trips people up: MACD is measured in the price units of the instrument you're charting. The MACD line on the NQ, where price moves in thousands of points, will read in the tens or hundreds. The MACD line on a $30 stock will read in fractions. A reading of "+18" means nothing on its own — it means nothing until you know what instrument, what timeframe, and what its normal range is. This is why you never compare raw MACD values across two different tickers, and why the histogram's shape and direction matter far more than its absolute number. Some platforms offer a "percentage" or "normalized" MACD to fix this, but the standard is absolute, and the standard is what everyone watches. Learn to read the shape, not the digits.
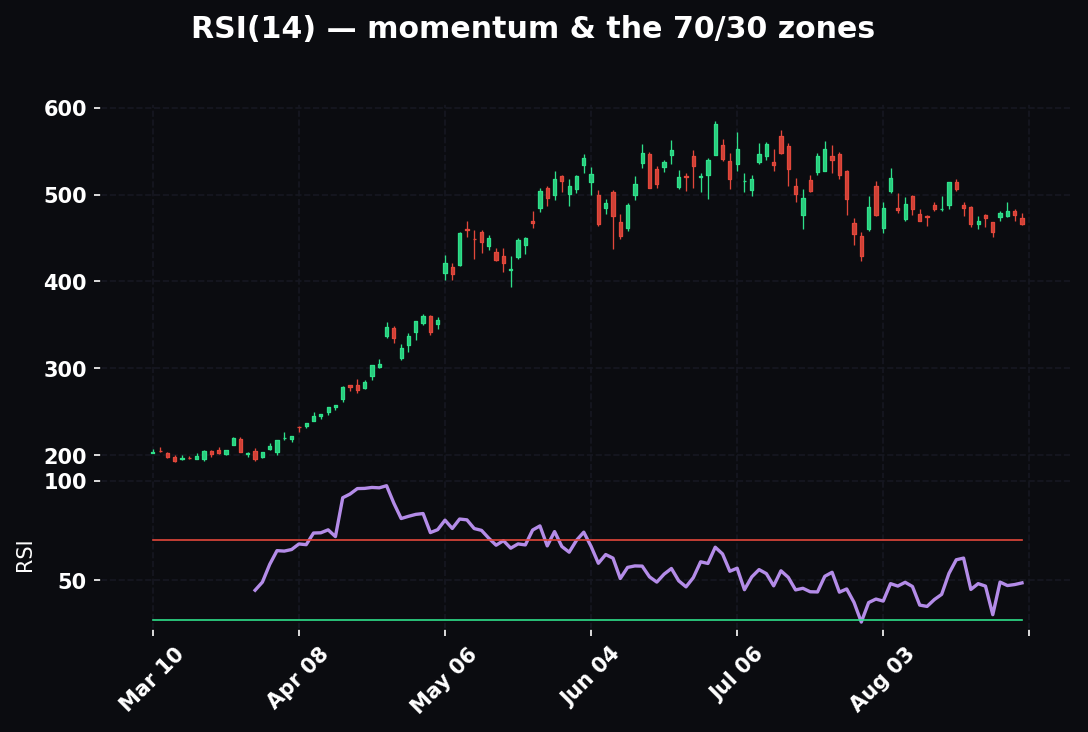
The Mechanism — Why It Works
Strip away the branding and MACD is a speed gauge for two moving averages. That's the mechanism, and understanding it is what separates people who use MACD from people who just watch it wiggle.
Think about what it means for two moving averages to spread apart. The 12 EMA is fast; it hugs recent price. The 26 EMA is slow; it represents the more established trend. When price accelerates upward, the fast EMA pulls away from the slow one, the subtraction produces a bigger positive number, and the MACD line rises. The rate at which those averages separate is momentum. When price is grinding higher but losing steam, the two EMAs stop spreading and start drifting back together — momentum is fading even though price may still be ticking up.
This is the key insight that most beginners never internalize: MACD measures the rate of change of the trend, not the trend itself. Price can keep making new highs while MACD is already rolling over, because the speed of the advance peaked before the price did. A car cresting a hill is still moving forward while it's already decelerating. MACD sees the deceleration. Price alone doesn't.
The derivative view (for people who like the math)
If you've had any calculus, here's the clean way to hold it: price is position, the MACD line is roughly the first derivative (velocity — how fast the trend is moving), and the histogram is roughly the second derivative (acceleration — how fast the velocity itself is changing). That's why the histogram turns first: acceleration goes negative before velocity does, and velocity peaks before position does. A ball thrown straight up is still rising when it's already decelerating, and it's decelerating for the entire ascent before it ever stops. The histogram is the deceleration meter. The MACD line is the velocity meter. Price is where the ball actually is. That nesting — acceleration, then velocity, then position — is the entire logic of the tool, and once you see MACD as three stacked derivatives you'll never misread the sequence again.
That's why MACD is genuinely useful and also why it's dangerous in the wrong hands. It gives you an early tell on momentum — but momentum shifts happen constantly, most of them meaningless, and MACD will faithfully report every one of them. The skill is filtering.
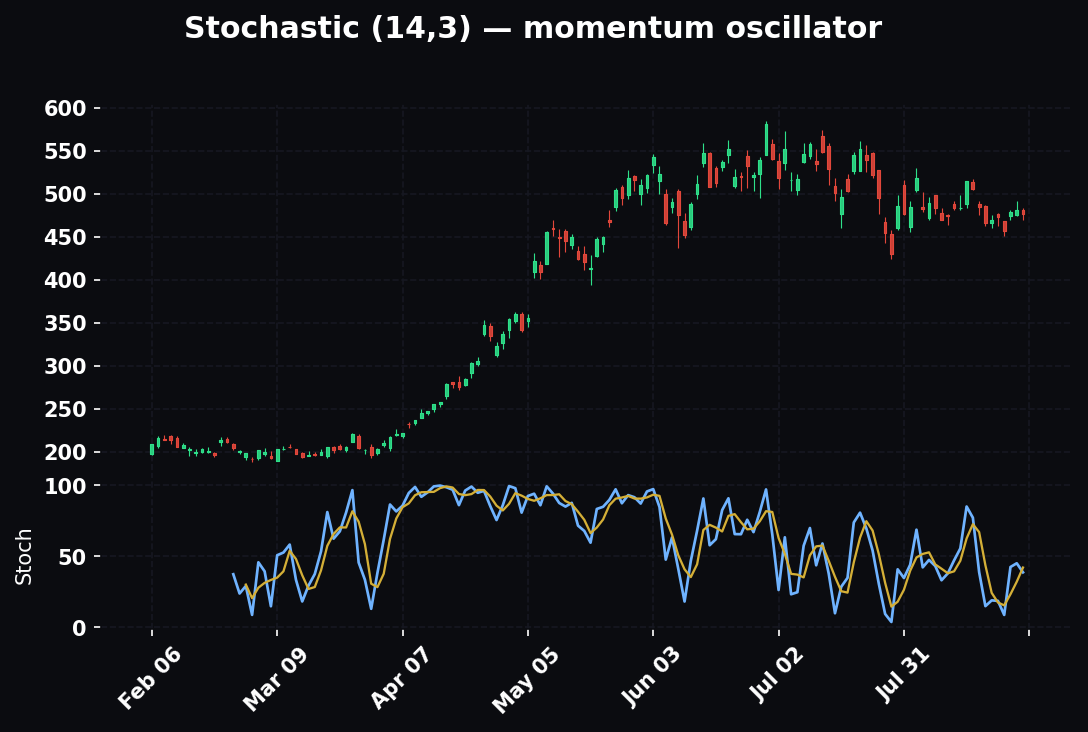
How To Read It — Step By Step
There are four distinct reads inside MACD, and they stack from fastest and noisiest to slowest and most reliable. Learn them in this order.
Read 1: The histogram (turns first, matters most)
The histogram is your earliest signal. Because it's the difference between the MACD line and the signal line, it starts shrinking the moment those two lines stop spreading apart — which happens before they actually cross.
Picture positive histogram bars in an uptrend: 0.8, 1.4, 2.1, 2.6, 2.9, 2.8, 2.4... The bars grew, peaked at 2.9, and are now shrinking. Nothing has crossed yet. The MACD line is still above the signal line. But momentum topped at that 2.9 bar. The histogram inflection — the point where bars stop growing and start contracting — is the first crack. Traders call taller bars "momentum expanding" and shrinking bars "momentum contracting."
Rule to burn in: the histogram turns before the lines cross, and the lines cross before price confirms. The histogram is your leading edge within MACD, which is itself a lagging indicator. Keep that nesting in mind — it stops you from treating a single shrinking bar like a reversal.
The difference between a pause and a peak
The single hardest thing about the histogram is distinguishing a genuine momentum top from a routine breath inside a strong trend. Here's the tell. In a healthy trend, the histogram makes a series of peaks that stay roughly the same height or keep climbing: 2.1, then a pullback to 1.2, then a fresh push to 2.4. That mid-trend dip to 1.2 is a pause — momentum caught its breath and then re-expanded. A genuine peak looks different: 2.9, then 2.8, then 2.4, then 1.6, then 0.9 — a steady, multi-bar contraction that doesn't re-expand, ideally while price is still grinding to new highs. One shrinking bar is a pause. Three or four consecutive shrinking bars with no re-expansion is momentum genuinely bleeding out. Count the bars. The market rewards patience here more than almost anywhere else.
Read 2: The crossover (the classic signal)
When the MACD line crosses above the signal line, that's a bullish cross — momentum has turned up enough that the fast line overtook its own average. When the MACD line crosses below the signal line, that's a bearish cross. On the histogram, a cross is simply the moment the bars pass through zero (flip from negative to positive, or positive to negative).
This is the signal everyone knows and everyone overtrades. A cross is real information — but a cross by itself, with no context, is close to a coin flip. Context is the next two reads.
The quality of a cross — not all crosses are equal
Before we get to context, notice that crosses themselves come in grades. A wide-angle cross — where the two lines meet at a steep angle and the histogram flips from a deep negative bar straight into a tall positive one — carries real force behind it. A shallow, grazing cross — where the two lines drift together nearly parallel, kiss, and separate by a hair, producing histogram bars of ±0.2 — is momentum barely changing its mind. The steep, decisive cross is the one worth trading. The lazy graze is the one that whipsaws you. You can read the angle at a glance: the more vertical the histogram's flip through zero, the more conviction behind the turn.
Read 3: The zero line (the context that changes everything)
This is the read that separates amateurs from operators, and it's the one most people skip entirely.
Remember: the MACD line is above zero when the 12 EMA is above the 26 EMA, which means the shorter-term trend is bullish. Below zero means bearish. So where a crossover happens relative to zero tells you whether it's aligned with the trend or fighting it.
- A bullish cross above the zero line = buying momentum resuming inside an established uptrend. High-quality, trend-aligned. These are the ones you want.
- A bullish cross below the zero line = the first bounce inside a downtrend. Counter-trend. Lower quality, often just a pullback that fails.
- A bearish cross below zero = selling resuming inside a downtrend. Trend-aligned.
- A bearish cross above zero = first weakness inside an uptrend. Counter-trend, frequently just a dip.
Same crossover, four completely different meanings depending on zero-line context. When you hear "trade with the zero line," this is it: take crosses that agree with which side of zero you're on, and treat crosses that fight it as suspect until proven otherwise. The zero line is MACD's built-in trend filter, and it's free. Use it.
The zero-line cross itself is a signal
Beyond filtering crossovers, the MACD line crossing zero is its own event, and a meaningful one. When the MACD line pushes from negative to positive territory, the 12 EMA has just crossed above the 26 EMA — a genuine shift in the short-term trend, not just a momentum wobble. Trend-following traders sometimes ignore the signal-line cross entirely and trade only zero-line crosses, because they're slower but far cleaner: fewer signals, each one representing an actual change in which EMA is on top. A zero-line cross that comes after a signal-line cross in the same direction is confirmation stacking — momentum turned (signal cross), then the short-term trend followed it across zero (zero cross). That two-step sequence, signal cross then zero cross, is one of the most reliable trend-initiation patterns MACD produces.
Read 4: Divergence (the reversal tell)
Divergence is when price and MACD disagree about direction, and it's the most powerful signal in the toolkit.
- Bearish divergence: price makes a higher high, but MACD makes a lower high. Price pushed to new highs on weaker momentum. The advance is running on fumes.
- Bullish divergence: price makes a lower low, but MACD makes a higher low. Sellers drove a new low but with less force behind it. The decline is exhausting.
Divergence works because of the mechanism we already covered — MACD measures momentum, and a new price extreme on fading momentum is the market telling you the move is decelerating. It's an early warning, not a trigger. Markets can diverge for a long time before they actually turn ("divergence can persist"), which is why divergence is a reason to get alert and tighten risk, not a reason to blindly fade a strong trend. Confirm it with a structure break or a trend-aligned cross before acting.
Regular versus hidden divergence
There's a second family of divergence most retail traders never learn, and it's the more useful one for trend traders. What we described above is regular divergence — it warns of reversals. Hidden divergence warns of continuations:
- Hidden bullish divergence: price makes a higher low, but MACD makes a lower low. In an uptrend, price pulled back shallowly (higher low) while momentum flushed harder (lower low) — the shakeout was worse than the price damage, and the trend is likely to resume up. This is a continuation signal, a "buy the dip" tell inside an uptrend.
- Hidden bearish divergence: price makes a lower high, but MACD makes a higher high. In a downtrend, a weak bounce in price (lower high) came with a big momentum pop (higher high) — momentum overshot the actual recovery, and the downtrend is likely to resume.
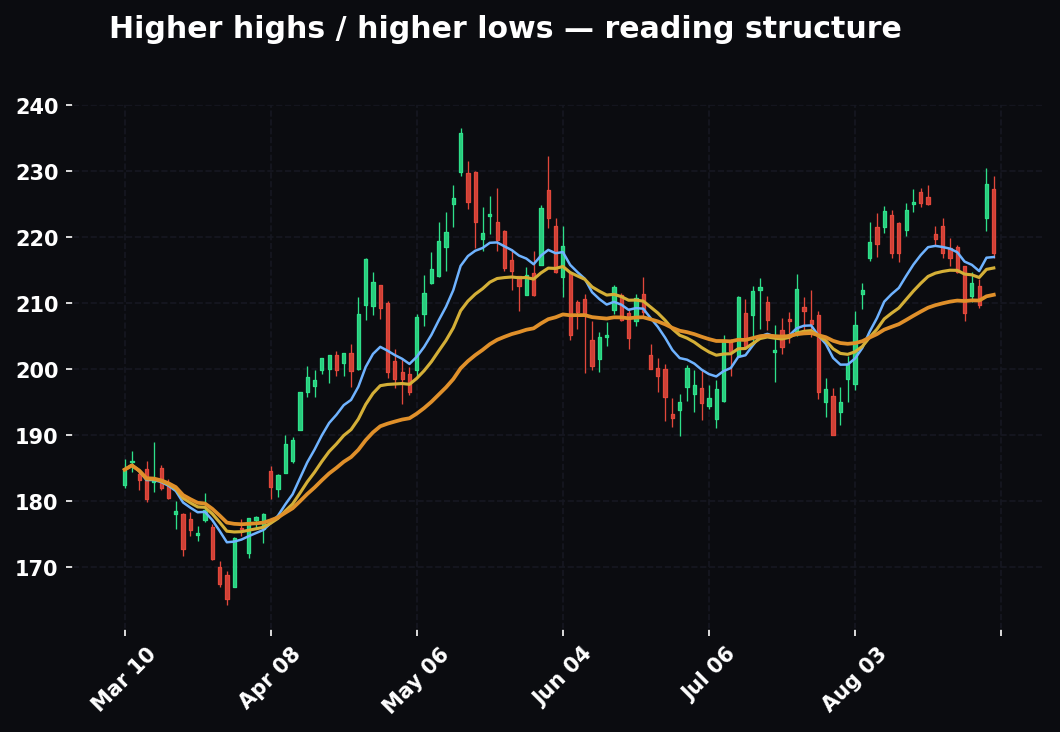
The rule of thumb: regular divergence = the swing between two tops (or two bottoms) at the trend's extremes, warning of a turn. Hidden divergence = the swing at the pullback inside a trend, warning of continuation. Trend traders live on hidden divergence because it lets them re-enter with the trend after a shakeout. Reversal traders live on regular divergence. Knowing which one you're looking at keeps you from fading a trend when the signal was actually telling you to join it.
Worked Examples With Real Numbers
Let's make this concrete. Numbers below are illustrative but realistic in scale.
Example A — the trend-aligned continuation (the bread and butter)
An index future is in an uptrend. On the daily, price has been climbing and the MACD line has been hovering around +18, above the zero line, confirming the fast EMA sits above the slow. Price pulls back for four sessions. During the pullback:
- MACD line drifts from +18 down to +6 (still above zero — trend intact)
- Histogram goes 4.0 → 2.1 → 0.4 → −0.8 (crossed below signal during the dip)
- Then histogram: −0.8 → −0.3 → +0.5 (inflection up, then a fresh bullish cross)
The bullish cross prints at MACD +7, above the zero line. This is a Read-3 A-grade setup: momentum resuming in the direction of the established trend, confirmed by the histogram turning first. You enter on the cross, stop below the pullback low. Because MACD never dropped below zero, you were never fighting the trend — you were buying a dip in an uptrend, which is exactly what the tool is best at.
Now add the hidden-divergence lens. During that pullback, did price make a higher low than the last pullback while MACD flushed to a lower low? If so, you had hidden bullish divergence stacking on top of the trend-aligned cross — two independent reasons pointing the same way. That's the kind of confluence that turns a good trade into a high-conviction one.
Example B — the divergence that front-ran the top
Same instrument, three weeks later. Price makes a new swing high at 20,450, then a higher high at 20,610. But look at MACD:
- At the 20,450 high, MACD line peaked at +22
- At the higher 20,610 high, MACD line only reached +14
Higher price, lower MACD high. Bearish divergence. Momentum behind the second push was noticeably weaker. You don't short yet — divergence alone isn't a trigger. But you flag it, tighten your stop on any long, and wait. Two bars later the histogram rolls negative, then the MACD line crosses below signal while still above zero (a counter-trend Read-3 warning — the first weakness in the uptrend). When price then breaks the prior swing low, you have structure confirming what the divergence warned about. The divergence gave you the heads-up 6-8 bars before the break.
Here's the sequencing that makes this trade professional rather than lucky: divergence (alert) → histogram roll (momentum decelerating) → signal cross below zero-line-still-above (momentum turned but not yet trend-confirmed) → structure break (price confirms). Four independent things lining up in order. The amateur shorted at the divergence and got run over on the higher high. The operator waited for the structure break and caught the meat of the move with a defined stop above 20,610.
Example C — the trap (why you don't trade every cross)
Choppy, sideways market. No trend. The MACD line is oscillating right around the zero line: +2, then −1, then +3, then −2. Every one of those tiny moves produces a crossover. If you traded each one you'd have taken six trades in a session and lost on most of them to whipsaw, because there was no momentum to ride — the two EMAs were tangled together, the histogram bars were tiny (±0.5), and the whole thing was noise. This is MACD's worst environment, and recognizing it is worth more than any signal: when the MACD line is pinned to the zero line with a flat, tiny histogram, the tool is telling you there's no trade. Stand down.
Example D — the high-volatility flush and V-reversal
Now the ugly one that teaches the most. A sharp risk-off flush hits. Price drops hard and fast. MACD line rockets from +10 down through zero to −45 in a handful of bars — a deep, vertical plunge. The histogram prints huge negative bars: −8, −11, −9. Then price puts in a violent V-bottom and rips back up.
Here's the trap: MACD is nowhere near crossing back up when price bottoms. It's at −45. By the time the histogram inflects, ticks positive, and the MACD line crosses signal, price has already recovered a third of the drop. If you waited for the textbook MACD long here, you bought the recovery late and gave back a chunk on the next pullback. In a high-volatility V-reversal, MACD's lag is at its most punishing. The lesson isn't that MACD is broken — it's that in fast, two-sided volatility you lean far more on faster tools (RSI hitting a deep oversold and snapping back, a reclaim of a key level, price structure) and treat MACD only as a later confirmation that the recovery has legs. Different regime, different weighting. We'll formalize that next.
MACD In Different Market Regimes
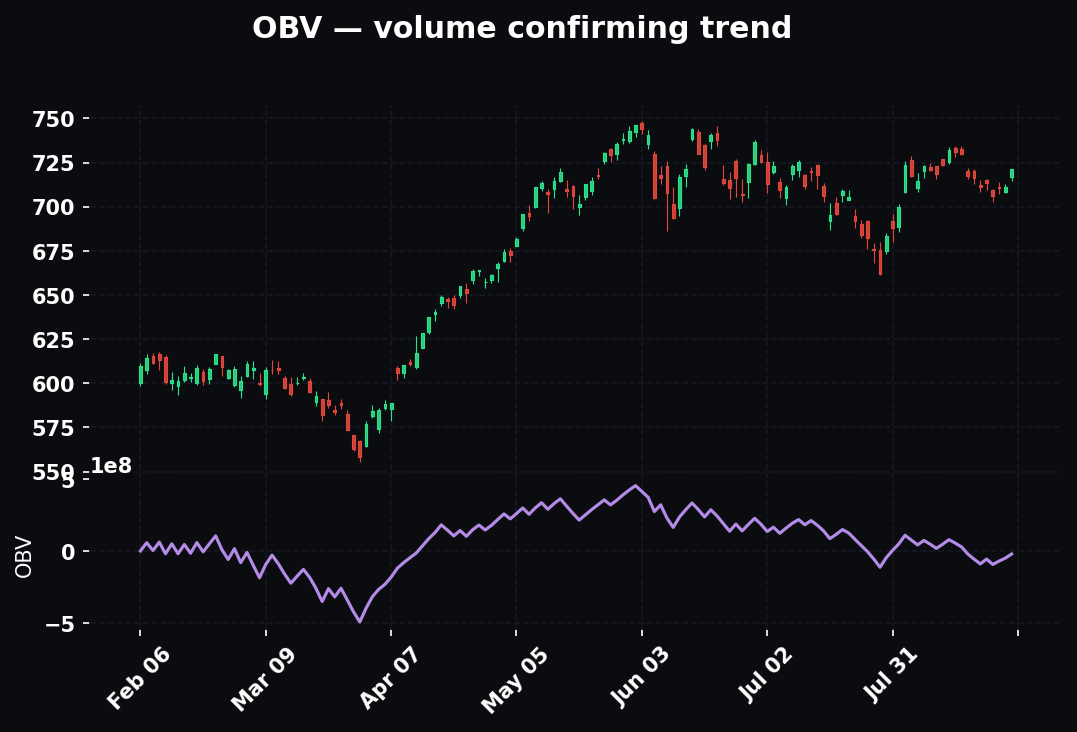
The biggest reason MACD "stops working" for people is that they use it the same way in every environment. It is not a one-setting tool. Its reliability swings enormously depending on the regime, and reading the regime first is what tells you how much to trust the signal.
Trending markets — MACD's home turf
In a clean, one-directional trend, MACD is at its best. The two EMAs stay spread apart, the MACD line holds firmly on one side of zero, and pullbacks produce clean, trend-aligned crossovers you can trade again and again. In a strong uptrend, every bullish cross above zero is a fresh entry, and hidden bullish divergence marks the dips. This is where you weight MACD heavily and take its signals with confidence — as long as they agree with the zero line.
The one caution in a trend: MACD can flatten out at an extended level and stop making new histogram peaks even as the trend grinds on. That flattening isn't a sell signal by itself in a strong trend — it's just the trend maturing. Don't let a lack of fresh momentum expansion scare you out of a trend that's still structurally intact. Read the structure, not just the momentum.
Ranging / chop — MACD's graveyard
In a sideways range, MACD is actively dangerous. The EMAs tangle, the line saws across zero, and it fires crossover after crossover, almost all of them losers. Example C above is the textbook case. The single most valuable regime skill is recognizing chop and switching MACD off as a trigger. In a range you either stand down entirely or you flip your whole approach — fade the extremes of the range using RSI and price levels, and use MACD only as a confirmation that a range breakout is real (a decisive zero-line cross with an expanding histogram as price clears the range boundary on volume). Inside the range, MACD is noise. At the range break, it's confirmation. Know which one you're looking at.
High volatility — MACD lags hardest
In fast, high-volatility conditions — news flushes, gap-and-go days, V-reversals — MACD's lag is maximally punishing (Example D). Moves happen faster than the 26 EMA can track, and by the time MACD confirms, the easy money is gone. In this regime you de-weight MACD as a timing tool and lean on faster instruments, using MACD only to confirm that a violent move has established a new momentum regime rather than to time the turn. A useful tell: when the MACD line makes an extreme excursion far from zero (a very deep or very high reading relative to its normal range), the move is stretched and prone to a snap-back — extreme MACD readings in high vol are exhaustion tells, not continuation signals.
Low volatility / compression — the coil
The opposite regime: price compresses into a tight range, volatility dries up, and MACD flatlines near zero with a dead-flat histogram. This looks like chop but it's different — it's a coil. The read here is anticipatory: a long, flat MACD compression is often the quiet before an expansion. You don't trade the flatline, but you get ready, because the first decisive zero-line cross with an expanding histogram out of a long compression frequently marks the start of the next real trend. Compression is MACD telling you to load the spring, not to fire.
Crosses vs Histogram Inflections — Timing The Entry
Here's how to actually use the histogram's early-warning property without getting faked out.
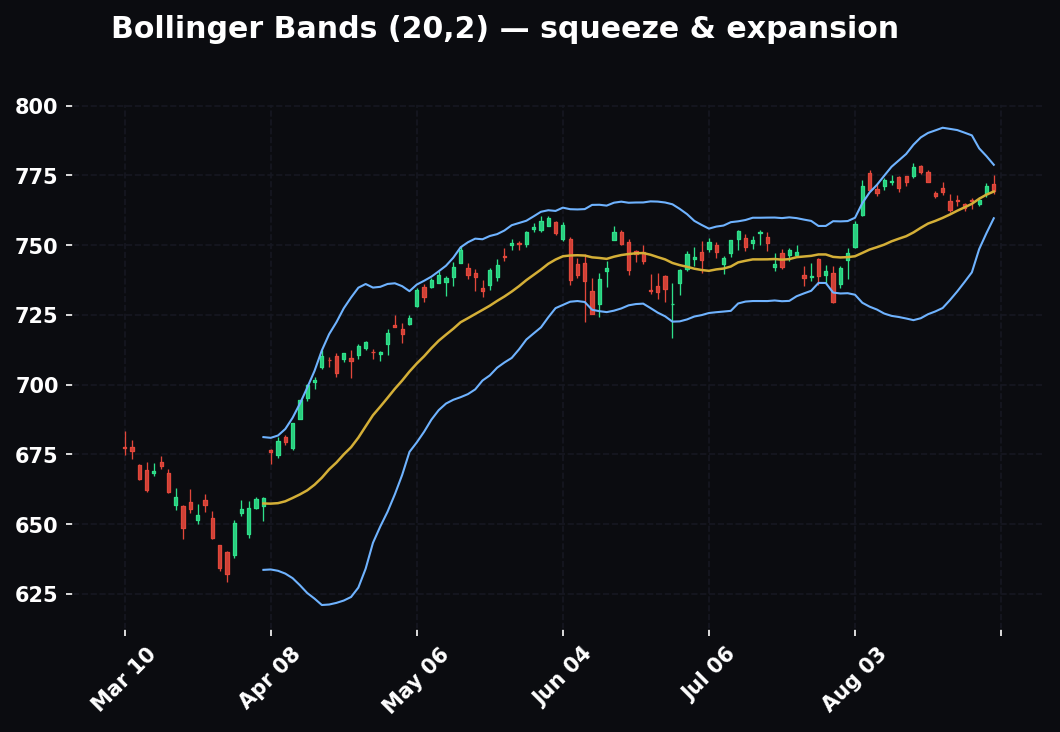
The histogram inflection (bars stop growing, start shrinking) is your alert. It says "momentum is decelerating, pay attention." It is not your entry. Acting on the first shrinking bar every time gets you chopped up, because momentum pauses inside healthy trends constantly.
The crossover is your trigger — slower, but it's actual confirmation that the fast line gave way. The sequence you want to trade is: histogram inflects → you get ready → cross confirms → you act, if zero-line context agrees. Inflection without a following cross is often just a breather. A cross that agrees with the zero line and was preceded by a clean inflection is your highest-probability MACD entry.
Think of it as a two-stage rocket. The histogram lights the warning. The cross launches. The zero line tells you whether you're pointed the right direction.
Entering earlier, safely — the histogram-through-zero technique
Once you've internalized the sequence, there's an advanced timing move for aggressive-but-disciplined entries. The histogram crossing its own zero (the moment it flips from negative to positive) is mathematically identical to the MACD/signal crossover — same event. But you can front-run that by reading the histogram's rate of change: when negative bars go −0.8, −0.3, −0.1, you can see the flip coming a bar early and prepare your order rather than react to it. The discipline is that you still require the zero-line context and at least one piece of confluence — you're not entering earlier by lowering your standards, you're entering earlier by reading the same information faster. Beginners should wait for the confirmed cross. Once you've watched a few hundred of them, you can lean on the histogram's slope to get positioned a bar sooner. That single bar, over hundreds of trades, is a meaningful edge — but only if you never use it as an excuse to skip the filters.
Multi-Timeframe MACD — The Real Edge
The most important upgrade to your MACD reading isn't a setting or a signal — it's using more than one timeframe at once. A single-timeframe MACD trader is playing the game half-blind. Momentum is fractal: there's daily momentum, hourly momentum, and five-minute momentum, and they are frequently pointing in different directions. The edge is aligning them.
The top-down structure
Work from the top down. Pick a regime timeframe (say the daily) and an entry timeframe (say the 15-minute), typically a 4-to-6x step between them. The higher timeframe's zero line sets your permission:
- Daily MACD above zero → you are only allowed to take long entries on the 15-minute.
- Daily MACD below zero → you are only allowed to take short entries on the 15-minute.
Then, on the entry timeframe, you hunt for the trend-aligned cross. What this does is brutally simple and enormously effective: it forces every one of your lower-timeframe trades to agree with the higher-timeframe momentum regime. The counter-trend 15-minute crosses — the ones that whipsaw you — get filtered out before you ever consider them, because they fight the daily zero line.
The three-timeframe stack
The full professional read uses three:
- Higher timeframe (bias): which side of zero? This is your directional permission. Nothing else on this timeframe matters for entry — you're only reading the zero line.
- Middle timeframe (setup): is MACD here setting up in the permitted direction? Is it pulling back toward a cross, showing hidden divergence, coiling for a zero-line cross?
- Lower timeframe (trigger): the actual entry cross, taken only when 1 and 2 agree.
When all three align — daily above zero, 4-hour pulling back and hooking up, 15-minute printing a fresh bullish cross above its own zero line — that is a timeframe-weighted confluence entry, and it's the highest-probability signal MACD can give you. When they conflict — daily up, 4-hour down, 15-minute crossing up — you have noise, and you pass. The conflicts are where beginners lose money by forcing the lowest timeframe's signal against the tide.
A worked multi-timeframe read
Daily MACD: +30, well above zero, histogram flat but positive. Bias = long only. 4-hour MACD: pulled back to +4, histogram just inflected up from −2 to +1 — setup forming in the permitted direction. Drop to the 15-minute: MACD line at +1.5 crossing above signal, above its own zero line, histogram expanding, and it's happening right at a prior-day-high retest that's now acting as support. Three timeframes agreeing, plus a level. You enter the 15-minute long with a stop below the level, and the daily's +30 momentum is the wind at your back. Compare that to the trader who saw only the 15-minute cross, took it blind, and got it right by luck this time and wrong the next.
Why MACD Lags — And How To Fix It
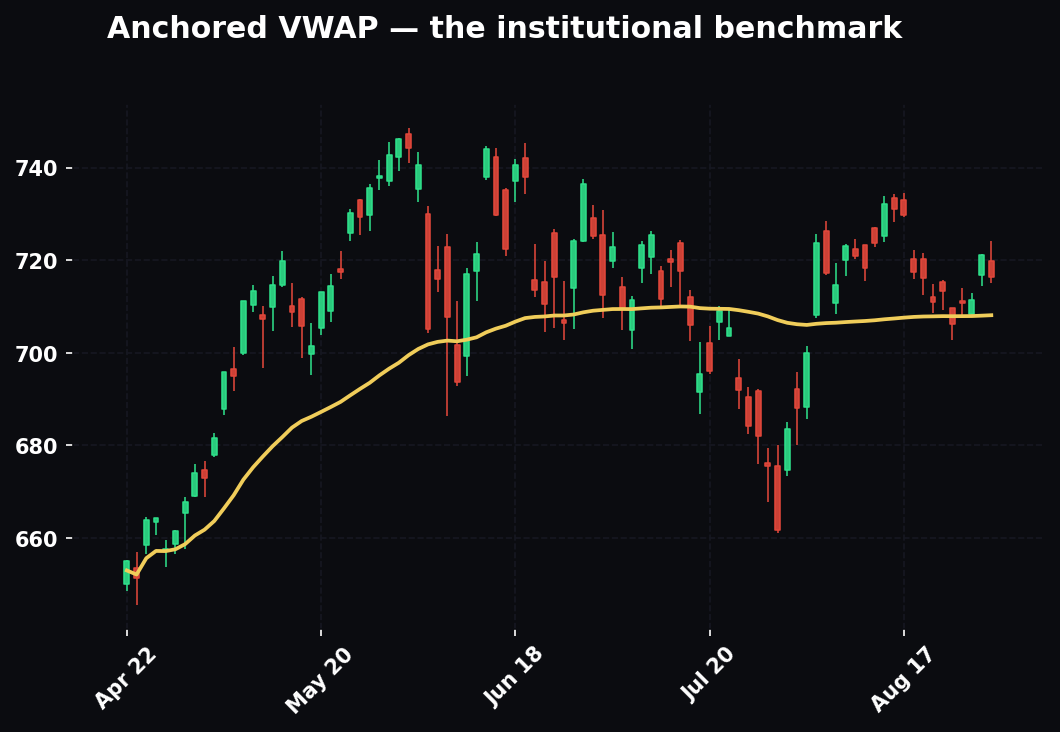
MACD is a lagging indicator, and pretending otherwise is how people lose money. It's built entirely from moving averages, and moving averages are backward-looking by definition — they average bars that have already closed. The 26 EMA in particular is slow. By the time a clean, trend-aligned crossover prints, a chunk of the move has already happened. That lag is the cost of MACD's reliability; the smoothing that keeps it from firing on every tick is the same smoothing that makes it late.
You do not fix lag by shortening the settings until MACD reacts faster — that just trades lag for noise and you end up back in the whipsaw. You fix it by pairing MACD with a leading tool so the fast tool warns and the slow tool confirms.
Pairing 1 — RSI (the classic)
The natural partner is RSI (Relative Strength Index), an oscillator that measures whether price is overbought or oversold on a 0-100 scale, reacting faster than MACD. The division of labor is clean: RSI tells you when a move is stretched (it hits 70+ overbought or 30- oversold early), and MACD tells you when momentum has actually turned (the cross). RSI is the early warning; MACD is the confirmation. When RSI flashes overbought and prints bearish divergence, then MACD rolls its histogram and crosses down below the recent high — those two lagging-and-leading tools agreeing is far stronger than either alone.
A concrete sequence for a top: RSI tags 78 (stretched) → RSI makes a lower high at 71 while price makes a higher high (RSI divergence, the leading warning) → MACD histogram inflects → MACD signal cross down → structure breaks. RSI warned twice before MACD ever moved. That's the whole point of the pairing: RSI buys you time, MACD gives you conviction.
Pairing 2 — Price structure
Price structure — higher highs/higher lows vs lower highs/lower lows — is leading, because structure breaks in real time while MACD is still catching up. A MACD cross that confirms a fresh structure break is gold: the break tells you the trend changed, the cross tells you momentum agrees. A MACD cross with no accompanying structure change is far weaker — it's momentum flickering inside an intact structure, which is often just a pullback. Always ask: does this cross come with a break of a swing high or low? If yes, high conviction. If no, treat it as a lower-grade signal.
Pairing 3 — Volume
Volume is the conviction meter. A trend-aligned MACD cross backed by expanding volume has real participation behind it; the same cross on dead, declining volume is a move nobody's showing up for and it tends to fail. Volume is especially decisive at range breakouts: a bullish zero-line cross as price clears range resistance on a volume surge is a genuine breakout; the identical cross on flat volume is a fakeout waiting to happen.
Pairing 4 — Key levels
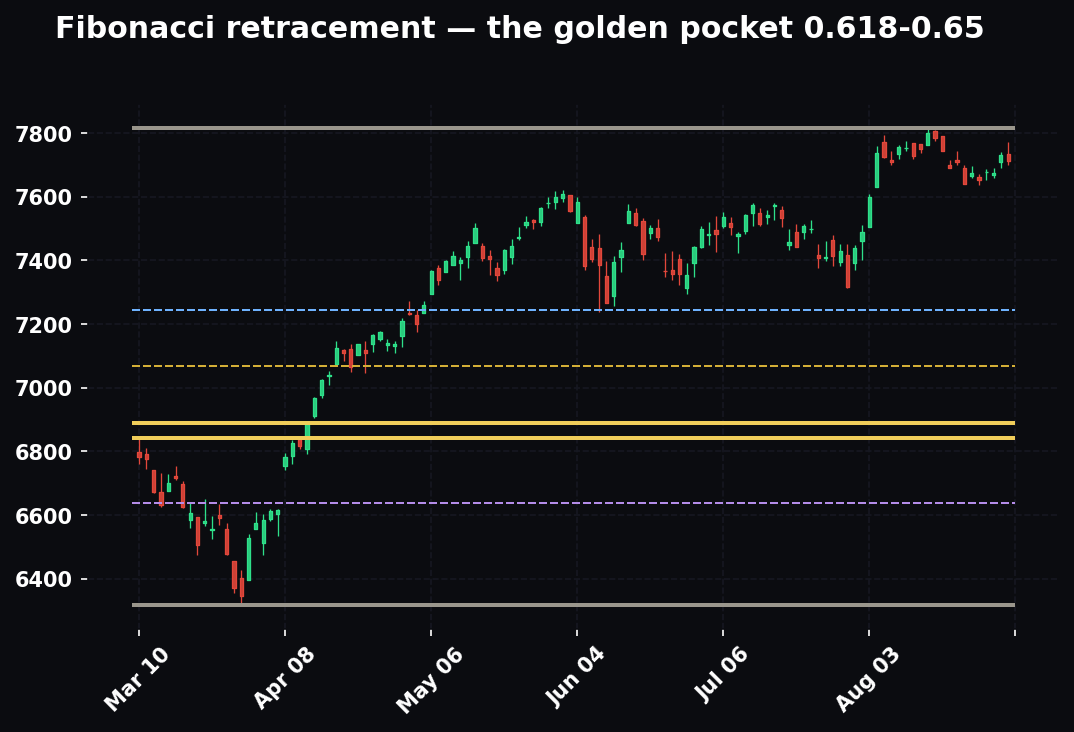
A bullish MACD cross firing at a support level, a value-area low, a prior-day low, or a golden-pocket retracement is a level and a momentum signal firing at the same price. The level gives you a precise invalidation (just beyond it) and the cross gives you the timing. This is the pairing that feeds directly into risk sizing, because the level defines your stop.
The meta-rule across all four: MACD should never be your only reason. It's a confirmation layer. Its job is to answer "has momentum actually turned?" after something faster — RSI, structure, a level — has told you where to look. A MACD signal with no confluence is a coin flip with extra steps.
MACD And The HPT Framework
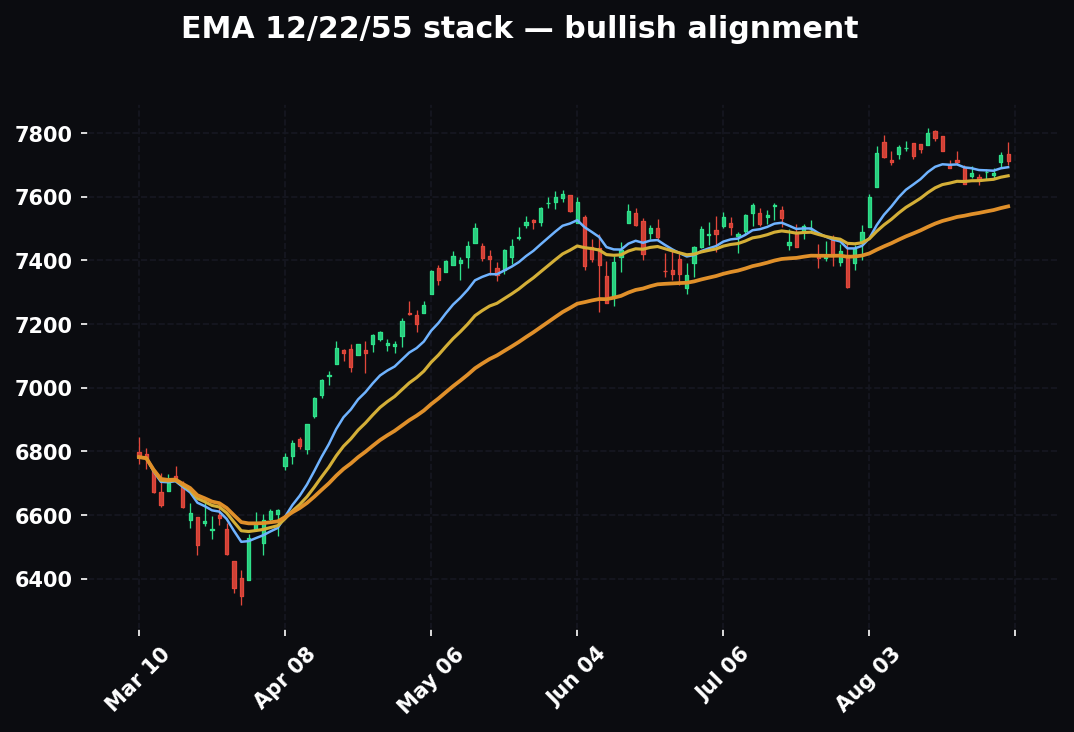
At Hollow Point, trend is defined by the EMA 12/22/55 stack, and the daily 55 EMA is the bias tell — it decides which direction you're allowed to lean. MACD slots into that framework as a momentum confirmation layer, not a bias-setter. The daily 55 sets the direction; MACD's zero-line context tells you whether momentum currently agrees.
The alignment is almost poetic: MACD's zero line and the HPT bias framework are asking the same question from different angles — which side of the trend are we on? When price is above the daily 55 (HPT bullish bias) and MACD is making its crosses above the zero line, those are the same signal confirming each other, and that's exactly the timeframe-weighted confluence the framework is built on. Higher-timeframe MACD (daily) sets the momentum regime; you drop to a lower timeframe (say 15-minute) and take MACD crosses only in the direction the daily zero line allows. That single rule — lower-timeframe entries filtered by higher-timeframe momentum — eliminates the majority of bad MACD trades.
When MACD and the 55 disagree
The most useful moments are the disagreements. If price is above the daily 55 (bullish bias) but daily MACD has crossed below zero, you have a bias that says "lean long" and a momentum reading that says "the short-term is weakening." That's not a contradiction to ignore — it's a signal to stand down and wait. Either momentum re-aligns with the bias (MACD crosses back above zero, and you resume taking longs) or the weakness deepens and price loses the 55 (bias flips). Disagreement between the bias tell and the momentum tell is the framework's way of saying "no clean trade right now." That patience — refusing to trade the disagreement — is worth more over a year than any single signal.
Feeding the risk model
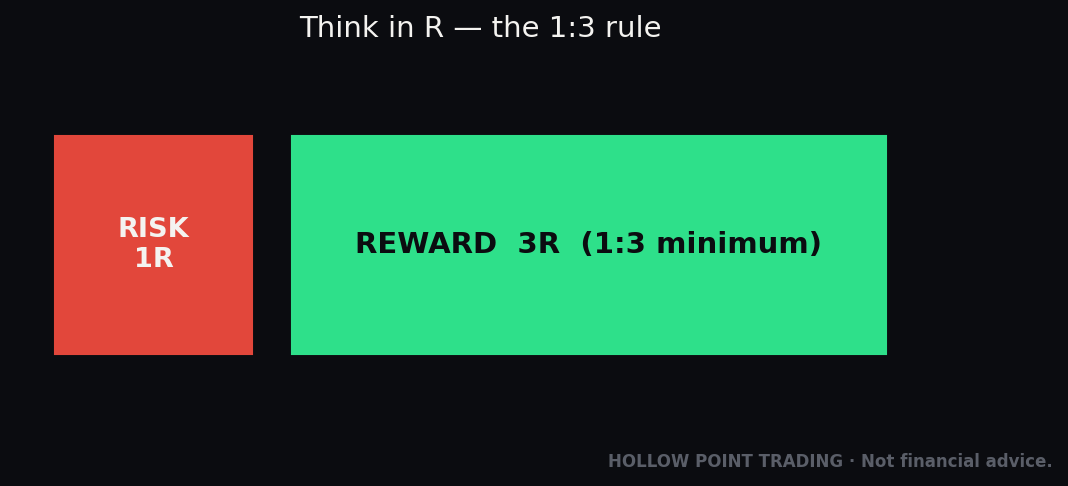
And it feeds the risk model. A trend-aligned MACD cross off a defined level gives you a clean invalidation (the other side of the level), which lets you size a minimum 1:3 R/R trade. Concretely: bullish cross above zero, firing at a prior-day low that's holding as support at 20,300, with your invalidation at 20,285 (15 points of risk). For 1:3 you need 45 points of reward, targeting 20,435 — and you only take the trade if there's clean air to that target with no wall of resistance in the way. The levels do the work; MACD helps you time the entry; discipline banks it. If the 1:3 math doesn't clear, the trade doesn't exist, no matter how pretty the cross.
Settings For Different Timeframes
Start here, and change nothing until you have a real reason: 12, 26, 9. It's the default because it's what the entire market watches, and on the daily and 4-hour it's genuinely well-calibrated. On daily charts, leave it alone. Standardization is an edge — shared levels get respected.
Where adjustment can be defensible:
- Faster / scalping (1m–5m): some traders run 5, 35, 5 (a well-known alternative that's actually slower on the fast leg but responds differently) or shorten toward 8, 17, 9 for quicker crosses. The tradeoff is always the same — faster settings, more signals, more noise, more whipsaw. You are buying earlier entries with worse signal quality.
- Slower / position (weekly): default 12/26/9 on the weekly is already a slow, high-conviction read; most position traders don't touch it.
The 5, 35, 5 case, honestly
The 5, 35, 5 variant deserves a real explanation because it's genuinely different rather than just "faster." Widening the slow EMA to 35 makes the MACD line smoother and slower to cross zero, which reduces whipsaw around the zero line, while the shorter 5-period signal makes the signal-line crosses quicker. The net effect is a MACD that whips less at the zero line but hooks faster on the signal — some swing traders genuinely prefer it for that reason. It's a legitimate alternative, not a gimmick. But — and this is the point — it is a choice of character, not a better indicator. You pick it because you want that behavior and then you leave it fixed. You do not flip between 12/26/9 and 5/35/5 chart to chart hunting for the one that confirms your bias. That's not tuning; that's fooling yourself.
The over-optimization trap
The honest truth: the vast majority of "optimized" MACD settings are curve-fitting — someone found numbers that would have worked beautifully on last month's chart and won't next month. The gain from tuning settings is small and fragile. The gain from reading the zero line and demanding confluence is enormous and durable. Spend your energy there. If you change settings, change them because a timeframe genuinely demands it, then leave them fixed — don't fiddle chart to chart.
There's also a hidden cost to non-standard settings that nobody mentions: you give up the crowd. Part of why 12/26/9 crosses "work" is reflexive — enough traders and algos watch the same standard MACD that the signals become partly self-fulfilling. Run an exotic setting and your MACD crosses at prices nobody else's does, so you lose that crowd effect entirely. That's a real reason to respect the default beyond mere tradition.
The Classic Mistakes
1. Trading every crossover. The single biggest one. Crosses fire constantly, most in the chop around the zero line where there's no momentum to capture. A cross is not a trade. A cross with zero-line context, structure, and confluence is a trade. If you find yourself taking five MACD signals in a morning, you are not trading MACD — you are being traded by it.
2. Ignoring the zero line. A bullish cross below zero (counter-trend) and a bullish cross above zero (trend-aligned) are treated as identical by beginners, and they are not remotely the same trade. If you take one thing from this guide, take the zero line. It is the free trend filter built into the tool, and skipping it is the difference between a coin flip and an edge.
3. Treating a lagging tool as leading. Expecting MACD to call tops and bottoms in real time. It won't. It confirms; it doesn't predict. Pair it with something faster if you want early warning. Every time you feel the urge to "get in before the cross" with no confluence, you are asking a lagging tool to lead, and it will punish you.
4. Forcing signals in a range. MACD is a momentum tool and ranges have no momentum. Flat, zero-pinned MACD with a tiny histogram means no trade — read that as a signal in itself. The trader who can sit on their hands through a zero-pinned MACD outperforms the one who can read every divergence, because the range is where accounts go to die.
5. Acting on the first shrinking histogram bar. Momentum pauses inside trends all the time. Inflection is an alert, not a trigger. One shrinking bar is a breath. Wait for the cross, and ideally for three-plus bars of genuine contraction before you even treat it as a real deceleration.
6. Fading a strong trend on divergence alone. Divergence can persist for a long time — a strong trend can print three, four, five divergences before it actually turns. It's a reason to tighten risk and get alert, not a reason to blindly short a freight train. Confirm with structure. The graveyard is full of traders who shorted the "obvious" bearish divergence and got run over because the trend simply kept diverging.
7. Over-optimizing settings. Chasing magic numbers instead of learning to read the default. The default is fine. Your reading is the problem. Every hour spent optimizing settings is an hour not spent learning the zero line, which is where the actual money is.
8. Comparing MACD values across instruments or timeframes. A +18 on the NQ daily and a +18 on a $40 stock's 5-minute mean completely different things because MACD is in the instrument's price units. Never say "MACD is high, so it's overbought" based on an absolute number. Read it relative to that instrument's own recent range, or read the histogram's shape, not its digits.
9. Confusing the two divergence types. Trading a hidden bullish divergence (a continuation signal) as if it were regular bullish divergence (a reversal signal) means you'll enter against the wrong expectation and manage the trade wrong. Know whether the divergence is at the trend's extreme (regular, reversal) or at a pullback (hidden, continuation) before you act.
10. Trusting the signal on the unclosed bar. MACD recalculates tick by tick as the current bar moves. A cross that's "printing" mid-bar can un-print before the bar closes. Beginners jump on the live cross and get faked out when the bar closes back the other way. Wait for the bar to close before you treat a cross as real, or you'll trade dozens of crosses that never actually happened.
11. Same weighting in every regime. Using MACD with equal confidence in a clean trend and in a violent V-reversal. Its reliability is regime-dependent — high in trends, near-zero in chop, punishingly late in high vol. If you're not asking "what regime am I in?" before you weight the signal, you're using the tool wrong.
12. No invalidation. Taking a MACD cross with no defined level to be wrong at. MACD gives you timing, not a stop. If you can't point to the price that proves the trade wrong — and get 1:3 to your target from there — you don't have a trade, you have a hope.
How The Pros Use It Differently From Beginners
The gap between an amateur and a professional using the exact same MACD, exact same 12/26/9, is enormous, and it comes down to a handful of mental shifts.
Beginners react to the cross. Pros read the context around the cross. A beginner sees a bullish cross and thinks "buy signal." A pro sees a bullish cross and instantly asks four questions: which side of zero, what's the higher-timeframe regime, is there structure or a level here, and is anything diverging against it? The cross is the last thing the pro looks at, not the first.
Beginners want more signals. Pros want fewer, better ones. The amateur adds faster settings and lower timeframes to get more crosses, drowning in noise. The professional adds filters — the zero line, the higher timeframe, mandatory confluence — specifically to throw most signals away. The pro's edge is in the trades they don't take. A pro might take three MACD-based trades a week and pass on forty crosses. A beginner takes all forty-three.
Beginners treat MACD as a system. Pros treat it as one input. No professional trades "the MACD strategy." MACD is a momentum confirmation layer sitting on top of a structure-and-levels framework. It answers exactly one question — has momentum turned? — and the pro has three other tools answering the other questions. The beginner asks MACD to do everything and is baffled when it can't.
Beginners fear missing the move. Pros are happy to confirm late. Because MACD lags, acting on it means you're always a little behind the absolute turn. Beginners hate this and try to front-run, sacrificing the confirmation that made MACD worth using. Pros accept the lag as the price of reliability — they'd rather catch 70% of a confirmed move than 100% of a guessed one and 0% of the many guesses that were wrong.
Beginners see a number. Pros see a story. A beginner reads "+14." A pro reads "momentum peaked at +22 two swings ago, made a lower high at +14 on a higher price high — that's the third divergence in this trend, the histogram's been contracting for five bars, and we're stretched above the daily 55 — this trend is old and I'm tightening everything." Same +14. Completely different information, because the pro reads the sequence and the context, not the snapshot.
Beginners use MACD to predict. Pros use it to confirm and to size. The professional's real use of MACD is often about risk management, not entry: a trend-aligned cross off a clean level is what lets them size a proper 1:3 trade with a defined invalidation. MACD isn't telling them the future — it's giving them a structured, repeatable reason to press or stand down, with the math attached.
FAQ
Is MACD good for day trading or only swing trading? Both, but the principles don't change with the clock — only the noise does. On lower timeframes MACD fires more often and whips more, so the zero-line filter and higher-timeframe alignment become more essential, not less. A 5-minute MACD trader who ignores the 1-hour zero line is asking to be chopped up. Day traders should lean harder on multi-timeframe filtering than swing traders, because their signal-to-noise is worse.
What's the best MACD setting? 12, 26, 9. Genuinely. The energy you'd spend hunting a better setting is far better spent learning the zero line and demanding confluence. If a timeframe truly needs a different character, 5/35/5 is a defensible swing alternative — but pick one, fix it, and stop fiddling. The default's crowd effect is itself part of why it works.
Can MACD predict reversals? No. It's a lagging, confirming tool. Divergence gives you an early warning of a possible reversal, but divergence can persist for a long time, so it's a "get alert and tighten risk" signal, not a "reverse now" trigger. Anything that claims to predict tops and bottoms in real time is doing something MACD structurally cannot do.
Should I use the crossover or the zero-line cross? Use both, layered. The signal-line crossover is the faster, noisier trigger; the zero-line cross is the slower, cleaner trend-shift event. The strongest sequence is a signal cross followed by a zero-line cross in the same direction — momentum turned, then the short-term trend confirmed it. Trend traders can trade zero-line crosses alone for fewer, cleaner signals.
Why did MACD whipsaw me? Almost certainly you traded a cross in a range — zero-pinned MACD with a tiny histogram, no momentum to capture. Or you traded against the higher-timeframe zero line. Or you acted on a mid-bar cross that un-printed at the close. All three are filterable. The tool didn't fail; the filters weren't applied.
MACD says buy but RSI says overbought — who wins? That's not a conflict, it's the pairing working as designed. RSI overbought is the early stretch warning; a MACD bullish cross can still fire while a move is stretched. The read is: momentum is up (MACD) but the move is extended (RSI), so if you take the long, take it small, tighten the stop, and expect the pullback RSI is flagging. When they do fully agree — RSI reset out of overbought and MACD crossing up in a trend — that's the clean signal.
Do I need the histogram if I have the lines? The histogram is the lines — it's their difference — but it makes the two things you care about (the gap's direction and its rate of change) visible at a glance, and it turns first. Keep it. It's your earliest tell and the fastest way to read momentum expanding versus contracting.
Does MACD work on crypto / forex / stocks the same way? The mechanism is identical on any instrument that trends, because it's pure math on price. The character differs — crypto's higher volatility means more violent MACD excursions and harder lag in flushes; forex's ranginess means more zero-line chop. Same tool, but you weight it by the instrument's regime, exactly as you would across the four regimes above.
Should I trust a MACD signal on the current, unclosed bar? No. MACD recalculates every tick, so a live cross can vanish before the bar closes. Wait for the close. The only exception is the advanced histogram-slope read for getting an order positioned a bar early — but even then you confirm on close before you're truly committed.
Quick-Reference Cheat-Sheet
Construction
- MACD line = EMA(12) − EMA(26)
- Signal line = EMA(9) of the MACD line
- Histogram = MACD line − signal line
- Default settings: 12, 26, 9 — leave them alone
- MACD is in the instrument's price units — never compare values across tickers
What each part tells you
- MACD line = the trend's momentum / velocity (distance between fast/slow EMAs)
- Signal line = smoothed MACD, gives you the cross event
- Histogram = the gap / acceleration; turns first, your earliest tell
Reading order (noisy → reliable)
- Histogram inflection = alert (momentum decelerating) — want 3+ contracting bars, not one
- Crossover = trigger (momentum turned) — steep decisive cross beats shallow graze
- Zero line = context (trend-aligned vs counter-trend)
- Divergence = reversal or continuation warning (price and MACD disagree)
Zero-line context
- Bull cross ABOVE zero = trend-aligned, A-grade
- Bull cross BELOW zero = counter-trend, suspect
- Bear cross BELOW zero = trend-aligned, A-grade
- Bear cross ABOVE zero = counter-trend, suspect
- MACD line crossing zero itself = short-term trend shift (12 EMA crossing 26 EMA)
Divergence
- REGULAR (at the extremes → reversal): price HH + MACD LH = bearish top; price LL + MACD HL = bullish bottom
- HIDDEN (at the pullback → continuation): price HL + MACD LL = bullish continuation; price LH + MACD HH = bearish continuation
- Can persist — alert, not trigger. Confirm with structure.
The nesting rule
- Histogram turns before lines cross → lines cross before price confirms
- Acceleration → velocity → position (histogram → MACD line → price)
- Inflection = get ready. Cross = act (if zero line agrees).
Regime weighting
- Trend = MACD's home, weight it heavily (with zero line)
- Range/chop = graveyard, stand down or use only for breakout confirmation
- High vol / V-reversal = lags hardest, de-weight, confirm-only
- Compression/coil = load the spring, trade the first decisive cross out
Multi-timeframe
- Higher TF zero line = directional permission
- Only take lower-TF crosses in that direction
- Three-TF stack (bias / setup / trigger) aligned = highest-probability signal
Pairing (fix the lag)
- RSI = early/leading stretch warning; MACD = momentum confirmation
- Structure = leading; a cross confirming a structure break is gold
- Volume = conviction; expanding volume on a cross = real
- Levels = the invalidation for your stop
- MACD is never your only reason
Top mistakes to never make
- Trading every cross · ignoring the zero line · treating a lagging tool as leading · forcing signals in a range · acting on one histogram bar · fading a trend on divergence alone · over-optimizing settings · comparing raw values across instruments · confusing regular vs hidden divergence · trusting the unclosed-bar cross · same weighting every regime · no defined invalidation
HPT fit
- Daily 55 EMA + MACD zero line set the bias — when they disagree, stand down
- Lower-TF crosses only in the higher-TF direction
- Trend-aligned cross off a level → defined invalidation → 1:3 R/R → bank it
Monday-morning playbook
- Set regime on the higher timeframe (which side of zero?) — cross-check the daily 55
- Drop to your entry timeframe
- Only hunt crosses that agree with the higher-TF zero line
- Wait for the sequence: histogram inflects → cross confirms → above zero for longs / below for shorts
- Demand one piece of confluence: level, structure break, RSI, or volume
- Check divergence as a veto — diverging against you = stand down
- Define invalidation, size for 1:3 minimum — no 3-to-1, no trade
- In a range — flat, zero-pinned, tiny histogram — do nothing
The levels do the work. MACD helps you time it. Discipline banks it.
Bound by rules, feared by trade.