
Walk onto any trading Discord and you'll see it: a chart smothered in Bollinger Bands, some guy shorting every touch of the upper band and blowing up his account in real time. He thinks the bands are a reversal signal. They're not. He's using a volatility gauge as a direction gauge, and the market is charging him tuition for the mistake. He'll do it again tomorrow. He'll do it in a different ticker next week. The tool isn't broken — his read is.
Bollinger Bands are one of the most useful tools ever bolted onto a price chart — and one of the most consistently misread. The problem isn't the indicator. It's that nobody taught the reader what the bands are actually measuring. Everyone learns the picture — three lines, price bouncing between them — and nobody learns the mechanism. So the picture becomes a superstition: band up top means sell, band down low means buy. That's not analysis. That's a coin flip with extra steps. So let's fix that, top to bottom, so you can put this to work Monday morning without lighting money on fire.
By the end of this you'll know how the bands are built, what they measure (and what they emphatically do not), why the squeeze is the single highest-value signal on the tool, how to tell a trend-walk from a range-fade, how the bands behave differently in a grind, a chop, and a news shock, how to read them across timeframes at the same time, and how to stack %B, Bandwidth, Keltner Channels, EMAs, RSI, and volume into a read you can actually trade with real numbers on it. We'll work through more than a dozen concrete examples with prices attached, walk a full multi-timeframe read start to finish, and close with a cheat sheet you can screenshot and keep on the second monitor.
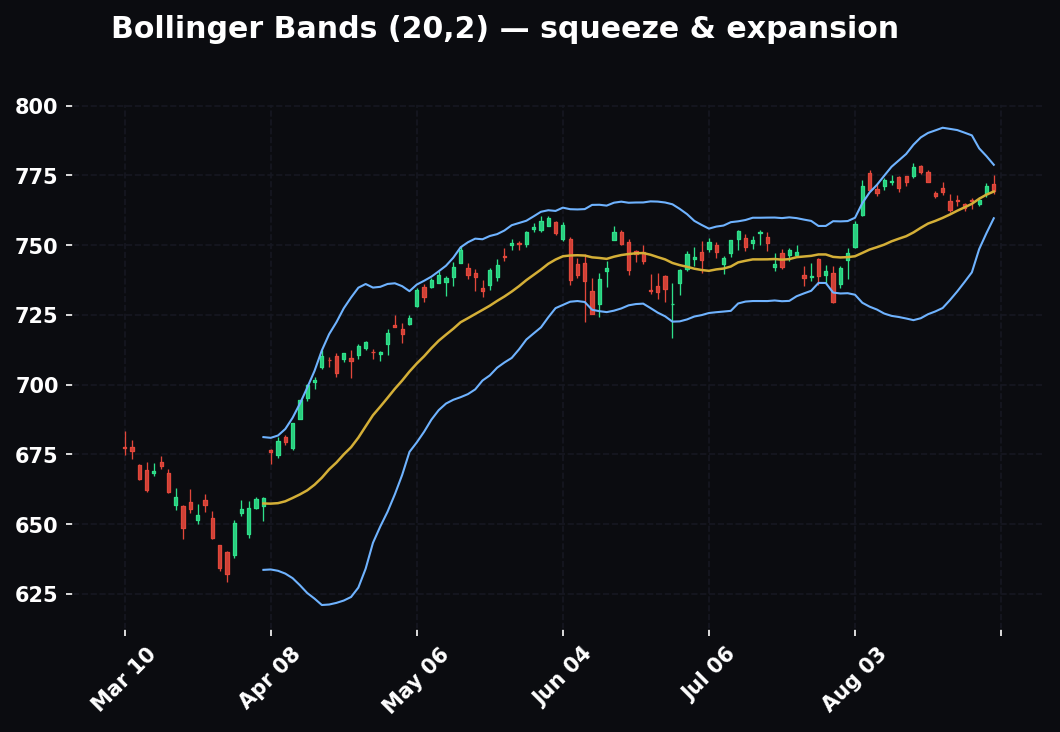
What Bollinger Bands Actually Are
John Bollinger built these in the early 1980s. The construction is simple, and understanding it is the whole game — because the mechanism explains everything the bands do. Skip the construction and you'll be memorizing rules you don't understand, which is exactly how people end up fading strength and calling it a system.
Three lines:
- Middle band: a 20-period simple moving average (SMA). The average closing price over the last 20 bars. Nothing fancy. This is your baseline "fair value" for the recent window.
- Upper band: the middle band plus 2 standard deviations of price.
- Lower band: the middle band minus 2 standard deviations of price.
Standard deviation is the only term you have to internalize here. It's a statistical measure of how spread out a set of numbers is around their average. When recent closes are clustered tightly around the 20 SMA, standard deviation is small. When closes are flying all over the place, standard deviation is large.
Let's make that concrete. Suppose over the last 20 bars a stock closed in a tight band between 99.50 and 100.50, mostly hugging 100. The 20 SMA is 100.00, and the standard deviation of those closes might be, say, 0.30. Bands would sit at roughly 100.60 (upper) and 99.40 (lower) — a total width of about 1.20 points. Now suppose the same stock over its last 20 bars swung between 94 and 106, closing all over the place. The average might still be 100.00 — but the standard deviation is now maybe 3.50. Bands sit at 107.00 and 93.00 — a width of 14 points. Same middle band, same "fair value," but the envelope is more than ten times wider. Nothing about direction changed. Only the energy changed, and the bands told you.
Why standard deviation and not a fixed percentage
You could build a channel a fixed 2% above and below a moving average. Some people do — that's an envelope, not a Bollinger Band. The reason Bollinger used standard deviation is that it's self-adjusting to the market's current behavior. A fixed-percent envelope is the same width whether the market is dead or on fire. A standard-deviation band is narrow when the market is dead and wide when it's on fire — automatically, with no input from you. That adaptivity is the entire point. The bands don't need to be tuned to the instrument because they tune themselves to whatever the last 20 bars have been doing.
Because the bands are set at ±2 standard deviations, they breathe with volatility. Quiet market → closes cluster → small standard deviation → bands pull in tight. Wild market → closes scatter → large standard deviation → bands blow wide open. The bands are literally a live readout of how excited price has gotten lately. Watch them long enough and you stop seeing three lines and start seeing a set of lungs — inhaling into a coil, exhaling into a move, inhaling again.
That "±2 standard deviations, 20-period SMA" is Bollinger's default and it's the default for a reason — it holds up across timeframes and instruments better than the alternatives people tinker into. Leave it at 20, 2 until you have a specific, tested reason not to. Bollinger himself has said if you lengthen the period you should widen the deviations, and if you shorten it, tighten them — his rough guidance is that a 50-period average wants closer to 2.1 deviations, and a 10-period average wants closer to 1.9 — but for 95% of readers, don't touch it. The people who fiddle the settings are almost always trying to make last week's chart look perfect, which is a different activity from trading next week's chart.
The statistical footnote everyone quotes wrong: in a normal distribution, about 95% of data sits within 2 standard deviations of the mean. So people say "95% of price stays inside the bands." Roughly true as a tendency, but markets are not normally distributed — they have fat tails, they trend, they gap. Price spends real time riding outside the bands. In a strong trend, the empirical number can drop well below 95% because price rides the outer band for extended stretches. That gap between the textbook and the tape is exactly where the beginner gets killed. He read "95% inside the bands" and concluded "a touch of the band is a rare, extreme event I should fade." In a trend it isn't rare and it isn't extreme — it's the trend telling you it's healthy. The rest of this guide is about closing that gap between the statistics-class version and the market version.
The Mechanism — Why The Bands Work
Here's the one sentence that reorganizes everything:
Bollinger Bands measure volatility, not direction.
The width of the bands tells you how volatile price is. The position of price within the bands tells you where you are in that volatility envelope. Neither of those, by itself, tells you which way price is about to go. A touch of the upper band means "price is now far above its recent average" — that's it. In a downtrend that's an exhaustion warning. In an uptrend that's a sign of strength. Same touch, opposite meaning. The band doesn't know which regime you're in — you have to supply that.
Sit with that, because it's the sentence most people skip. The tool is agnostic about direction by design. Asking Bollinger Bands "which way is price going?" is like asking a thermometer which way the weather is heading. The thermometer tells you it's cold. Whether cold means "storm coming" or "clear and freezing" depends on everything else on the map. The bands tell you the market is quiet or loud, and where price sits in that. The map — trend, structure, bias — is your job.
Volatility mean-reverts even when price does not
Why the bands work at all comes down to a single durable market truth: volatility is mean-reverting even when price is not. Price can trend for months. It can go up and keep going up and make fools of everyone calling a top. There is no law of physics that drags price back to an average. But volatility is different. Volatility cannot stay compressed forever, and it cannot stay explosive forever. Tight coils resolve into big moves. Big moves exhaust and settle back down. That oscillation — quiet, loud, quiet, loud — is the most reliable rhythm in all of markets, far more reliable than any prediction about direction.
Think about why that has to be true. A market at rest — tiny ranges, everyone agreeing on price — is a market storing energy. Positioning builds up on both sides. Stops cluster just outside the range. Sooner or later something tips it, and the pent-up positioning unwinds in a rush: that's expansion. But expansion is self-limiting too. A violent move exhausts the buyers or sellers driving it, brings in profit-takers and faders, and volatility bleeds back out as the market finds a new resting level. Neither state is stable. The market is always traveling from one to the other. Bollinger Bands are a microphone on that rhythm — they don't predict the weather, they measure the barometric pressure, and pressure extremes resolve.
That's the engine. Everything else is application.
How To Read Them, Step By Step
Read the bands in this order. Every time. The order matters as much as the steps — get the sequence wrong and you'll interpret a detail before you've established the context that gives the detail meaning.
Step 1 — Read the width first, not the touch. Before you look at whether price is at a band, ask: are the bands wide or narrow relative to their own recent history? Wide bands = high volatility, moves are already extended, chase-risk is high. Narrow bands = low volatility, energy is compressing, a move is being built. Width is the headline. The touch is a detail. Beginners do this backwards — they see the touch first and never look at the width, so they can't tell the difference between a touch that matters and a touch that's noise.
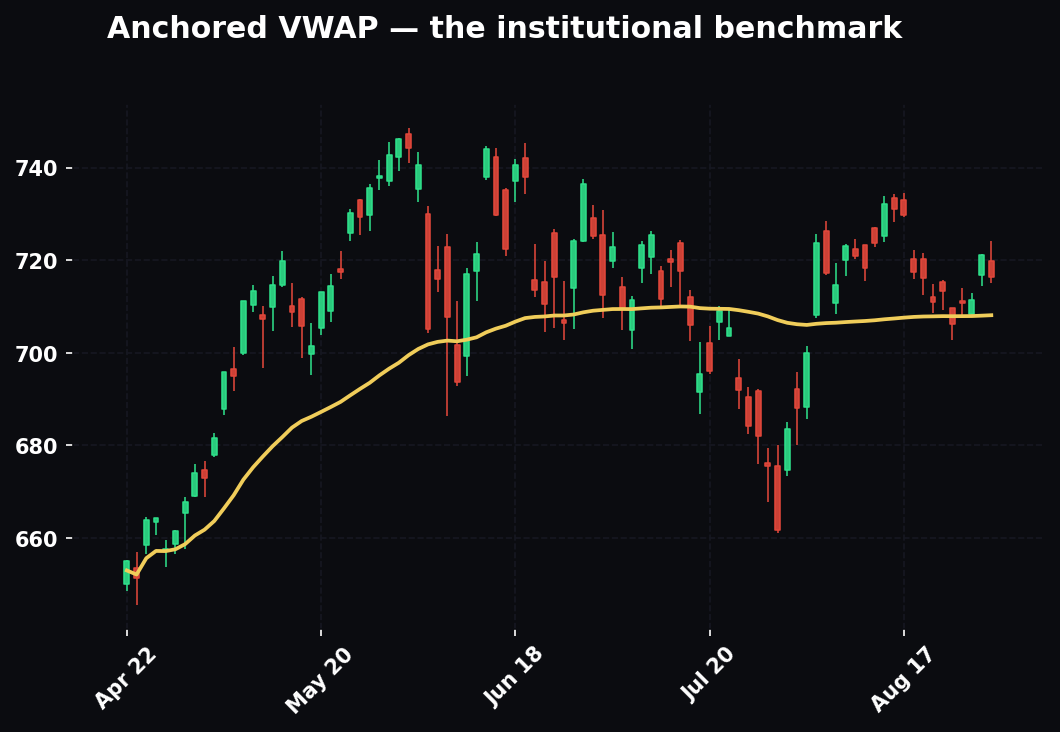
Step 2 — Identify the regime: trending or ranging? This is the read that determines whether a band touch is a "reversal" or a "continuation." You do NOT get this from the Bollinger Bands. You get it from structure and your moving averages. In the HPT framework, trend is defined by the EMA 12/22/55 stack — 12 over 22 over 55 and sloping up is an uptrend, the reverse is a downtrend, tangled and flat is a range. The daily 55 EMA is the bias tell — which side of it price lives on frames everything you do on the lower timeframes. Establish regime before you interpret a single band touch. If you only remember one sequencing rule from this whole guide, make it this: regime before touch, always.
Step 3 — In a trend, read band-walking. When price hugs and rides the upper band through a series of bars, that's a band-walk, and it's a signature of a strong trend, not a reversal. Strong uptrends walk the upper band; strong downtrends walk the lower band. During a walk the middle band (20 SMA) acts as dynamic support/resistance for pullbacks. Fading a band-walk is the classic account-killer — more on that in the mistakes section.
Step 4 — In a range, read the mean-reversion. When the EMAs are flat and price is oscillating, the bands become tram-lines. Touches of the upper band tend to fade back toward the middle; touches of the lower band tend to bounce. Here — and only here — "touch = fade candidate" is a reasonable working assumption, with confirmation.
Step 5 — Watch the width extremes. A squeeze (bands at their narrowest in months) is a coiled spring — the setup. A bulge (bands at their widest, an "expansion") means the move is mature and you should be managing risk, not initiating fresh chases.
Step 6 — Confirm with the price bar and volume. A band touch with a rejection candle (long wick, engulfing) and a volume spike is a real signal. A band touch on a nothing doji with dead volume is noise. The bands locate the opportunity; the candle and the tape confirm the trigger.
A worked read of the six steps, one chart
Say you pull up SPY on the hourly. Step 1: the bands are wide — noticeably wider than they were a week ago — so you're already in an expanded, mature move; you're not going to be initiating fresh chases up here. Step 2: EMA 12 is above 22 is above 55 and all three slope up, and on the daily SPY is comfortably above its 55 EMA. That's a clean uptrend, so any band signal gets read through a with-trend lens. Step 3: price has been riding the upper band for the last six hourly bars, pulling back to the 20 SMA twice and pushing right back up. That's a band-walk — strength, not a top. So a beginner's instinct ("upper band, it's overbought, short it") is already dead on arrival by Step 3. Step 4 doesn't apply — you're not in a range. Step 5: the bands are wide but not blown out to a historic bulge, so the move has life but you respect that it's not fresh. Step 6: on the last pullback to the 20 SMA, a hammer printed on a volume uptick. That's your read — a with-trend long off the middle band, not a countertrend short at the top. Six steps, and the tool that would've gotten a beginner run over just handed a disciplined reader a clean entry.
The Squeeze — The Single Highest-Value Signal
If you take one thing from this piece, take this.
Bollinger's own name for it is The Squeeze: the bands contract to their narrowest width in a long lookback (Bollinger uses a 6-month low in Bandwidth as a benchmark). Low volatility, by its own mean-reverting nature, is a forecast of high volatility to come. The squeeze doesn't tell you direction. It tells you a big move is loading. Your job is to be positioned to strike the instant it releases and to not get faked out by the head-fake that often comes first.
Why it's the highest-value signal: it's the one time the bands give you an edge in timing rather than just a description of the present. Every other band read is descriptive — it tells you what is. The squeeze is the one read that tells you what's about to be. And a great trade is mostly about timing — being in size right as expansion begins, with your risk defined by the coil itself, is how you get the 1:3+ reward-to-risk that makes a system profitable. You are not predicting direction with a squeeze. You are pre-positioning your attention and your risk so that when direction reveals itself, you're already there with a tight stop instead of chasing a move that's 200 points gone.
How to trade a squeeze, concretely
- Spot the compression — Bandwidth at a multi-month low, bands visibly pinched.
- Wait for the expansion bar — the first bar that closes decisively outside the range with the bands starting to flare apart. Volume should confirm.
- Enter in the direction of the break.
- Stop goes on the other side of the coil — this is the gift of the squeeze: your risk is tiny because the range was tiny. Small stop + big expansion move = the math works.
- Beware "the head fake." Bollinger explicitly warns the squeeze often fires a false move in one direction first, then reverses into the real move. If the break fails and reclaims the range fast, be ready to flip. Don't marry the first pop.
Worked example — NQ 15-minute squeeze
NQ futures on the 15-minute. Bands have pinched to a Bandwidth of 0.4% — the tightest in three weeks — while price coils between 20,180 and 20,230, the EMA 12/22/55 all flat and stacked on top of each other. That's a textbook squeeze: no trend, energy compressing. A bar closes at 20,245, clearing the coil high, bands snapping open, volume 2x the 20-bar average. Entry 20,245. Stop below the coil at 20,175 — 70 points of risk. At 1:3 that targets 20,455, and because you entered on the expansion instead of chasing 200 points late, the move has room to actually get there. That's the squeeze doing what nothing else on the chart can do: handing you a defined-risk entry right at the ignition point.
Worked example — the head fake that pays
Same NQ setup, different day. Bandwidth is at a two-month low, price coiling 20,180–20,230. A bar pokes below the coil to 20,168 and closes at 20,170 — a downside break. The impulsive trader shorts it. But volume on that break is below average, and two bars later price snaps back inside the range and closes at 20,215. That reclaim-the-range-fast is the head fake's signature: a break on weak volume that immediately reverses. The disciplined trader either never took the short (weak volume, no confirmation) or bailed instantly on the reclaim — and now flips. The next bar clears 20,230 on 2x volume and runs. The fake to the downside flushed the weak-handed shorts and gave the real move fuel. Entry on the upside reclaim at 20,235, stop back below 20,165, and the same 1:3 math applies. The lesson isn't "squeezes are unreliable" — it's that the first pop out of a coil is a question, not an answer, and the volume and the reclaim tell you which pops to trust.
Why the squeeze's math is unbeatable
The reason professionals hunt squeezes isn't mysticism — it's the risk arithmetic. Reward-to-risk is defined by two numbers: how far to your stop, and how far to your target. A squeeze compresses the first number to almost nothing because the range you're risking against is tiny. If your stop is 70 points away instead of the 200 points it'd be if you chased the same move mid-flight, then the same expansion move that a chaser catches at 1:1 you catch at 1:3 or better — purely because you were early and your risk was small. You didn't need to be smarter about direction. You needed to be in position before direction declared. That's the entire edge, and it's why the squeeze earns the "highest-value signal" title.
Walking The Band vs. Fading The Band
This is the fork in the road, and getting it right is 80% of trading Bollinger Bands well. Almost every dollar lost on this indicator is lost at this fork, by someone who took the fade when the chart was screaming walk.
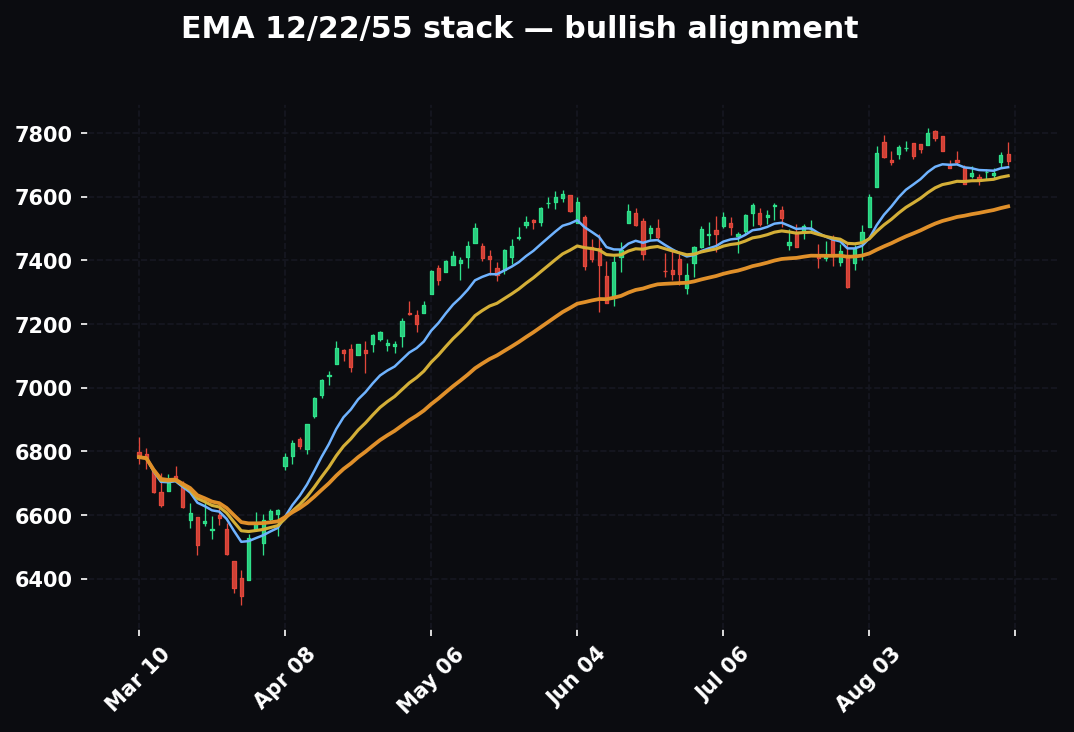
Walking the band (trend regime). In a strong trend, price will touch the far band and keep going — touch, pull back a hair to the 20 SMA middle band, push right back to the far band, repeat. Each touch is confirmation of strength, not a top or bottom. Your play in a walk is to trade with it: buy pullbacks to the middle band in an uptrend, sell rallies to the middle band in a downtrend, and let the walk run. The band-walk ends not when price touches the band "too many times" but when structure breaks — a failure to make a new high, a close back inside that holds, the EMA stack rolling over. Counting touches is not analysis. "It's touched the band five times, it has to reverse" is the gambler's fallacy in a candlestick costume. The walk ends when structure says it ends, not when your patience does.
Fading the band (range regime). In a flat, rangebound market with no EMA trend, the bands are rubber walls. Price stretches to the upper band and snaps back toward the mean; stretches to the lower band and snaps back up. Here you fade — but only with a confirming rejection candle and ideally %B agreement (below). Target the middle band, not the opposite band, unless the range is clean and wide. In a tight range the middle band is the honest target; reaching for the far band is greed that gives back the trade when price stalls at the mean and reverses on you.
How do you know which one you're in? Structure and the EMAs, every time. Trending EMA stack → walk it, trade with it. Flat, tangled EMAs → fade it, trade the reversion. When in doubt, assume trend and don't fade. Fading is the lower-probability, higher-glamour trade and it's where beginners lose the most. Catching the exact top feels brilliant; it also happens about a fifth as often as beginners attempt it. The market spends more time trending in impulse than most people fading it will admit. If you must have a default, let it be "trade with the move." You'll be wrong sometimes, but you'll be wrong small and right big, which is the only distribution that pays.
The transition zone — where walks become fades
The hardest read isn't a clean walk or a clean range — it's the moment one becomes the other. A walk that's ending and a range that's forming look nearly identical for a few bars. The tells: the far-band touches stop reaching as far (%B lower highs — see below), the pullbacks to the middle band start breaking through it instead of bouncing, and the EMA stack starts to flatten and tangle. When you see price close through the 20 SMA and hold below it after a long upper-band walk, the walk is likely done — that's your cue to stop buying middle-band pullbacks and start treating the structure as a range or a possible reversal. Don't flip from walk-mode to fade-mode on a single bar; wait for the middle band to actually fail as support and for the EMAs to lose their stack.
Bollinger Bands In Different Market Regimes
The same three lines behave like three different tools depending on the weather. Reading them well means knowing which weather you're in.
Trending regime — the grind
In a clean trend, the bands tilt in the direction of the move and price rides the outer band. Bandwidth is moderate to wide and often stays elevated for the duration. The middle band becomes a moving trendline you can lean on. Your entire playbook here is with-trend: buy pullbacks to the 20 SMA in an uptrend, sell rallies to it in a downtrend, ignore the "overbought" screaming of the outer band. The single most expensive mistake in a trend is treating the outer-band touch as a top. In a grind, the outer band is a handrail, not a wall.
Ranging regime — the chop
In a range, the bands go flat and roughly horizontal, and Bandwidth sits low to moderate. Price oscillates between the outer bands and the tram-line logic works: fade the extremes toward the middle, with confirmation. This is the only regime where the beginner's instinct — sell the top, buy the bottom — is actually correct, which is cruelly why beginners think it works everywhere. It works here, in confirmed chop, with a rejection candle and %B agreement, targeting the mean. The danger in a range is the false breakout: price pokes outside a band, sucks in breakout traders, and snaps back. In a confirmed range, that poke-and-snap is a fade signal, not a breakout signal — the mirror image of how you'd read the same bar in a trend.
High-volatility regime — the shock
When a catalyst hits — earnings, a Fed print, a geopolitical headline — volatility explodes and the bands blow wide open, sometimes doubling in width in a handful of bars. Here the bands are almost useless as an entry tool and valuable as a risk tool. A band touch means nothing when the bands are three times their normal width; price can and will run outside a band that's already enormous. What the bulge tells you is: do not initiate fresh chases, size down, widen your expectations for noise. The bands are shouting "the environment is dangerous, not opportune." Some of the worst fills of a trader's career come from treating a shock-widened outer band as an extreme to fade. It isn't extreme relative to the new volatility — it's normal, just enormous.
Low-volatility regime — the coil
The dead-quiet regime is the squeeze, covered above, and it's the mirror of the shock: bands pinched to a multi-month low, Bandwidth on the floor, energy loading. The read here is pure patience — you're not trading the coil, you're waiting for it to fire. The mistake is boredom-trading inside the coil, taking tiny fades off tiny band touches for tiny profits, right up until the expansion bar runs your stop. In a coil, sit on your hands and set a Bandwidth alert.
The through-line across all four: the bands' width tells you which regime you're in, and the regime tells you which rulebook applies. Read width first, always — it's Step 1 for a reason.
Multi-Timeframe Reading — The Bands On Three Screens At Once
A band signal on the 5-minute means something completely different depending on what the hourly and the daily are doing. Timeframe-weighted confluence is the difference between a scalp that fights the tide and one that rides it.
Higher timeframe sets the bias. Look at the daily bands and daily EMA 55 first. If the daily is in an upper-band walk above a rising 55 EMA, your bias is long, and you're hunting long setups on the lower timeframes — lower-band bounces, middle-band pullbacks, squeeze breaks to the upside. You are not taking lower-timeframe short fades against that daily bias, no matter how pretty they look on the 5-minute.
Trading timeframe sets the setup. The 15-minute or hourly is where you find the actual entry — the squeeze, the pullback, the fade. This is where the six-step read gets applied in detail.
Lower timeframe sets the trigger. The 1-minute or 2-minute is where you time the pull of the trigger — the rejection candle, the reclaim, the volume spike — once the higher timeframes have agreed.
The alignment that pays
The highest-conviction trades happen when the timeframes nest: the daily is trending up, the hourly puts in a squeeze, and the 5-minute fires the expansion bar to the upside on volume. All three agree. That's when you size up. When they conflict — daily trending up but the hourly squeeze breaks down — you either pass or you treat it as a lower-conviction counter-trend scalp with a tight leash, never as a full-size position. The bands give you a signal on every timeframe; confluence is only real when the signals agree at one price across timeframes.
A worked multi-timeframe read
Daily NQ: price above a rising 55 EMA, bands tilted up, riding the upper band for two weeks — clean uptrend, bias long. Hourly NQ: bands have pinched to a three-week Bandwidth low while price coils in a tight 120-point range — a squeeze, setting up inside the daily uptrend. 15-minute: an expansion bar closes above the coil high on 2x volume, bands flaring. 2-minute: a small pullback and a hammer off the broken coil high confirms the trigger. Every timeframe agrees: long. Entry on the 2-minute trigger, stop below the coil on the hourly, target set by the daily's room to run. That nesting — daily bias, hourly setup, lower-timeframe trigger — is the whole game, and the bands contributed a read on all three screens at once.
%B and Bandwidth — The Two Numbers That Sharpen Everything
The bands are visual. These two derived indicators turn them into numbers you can set alerts and rules on. If the bands are the picture, %B and Bandwidth are the picture converted to hard data you can automate.
%B (Percent B) tells you where price sits within the bands as a single number:
%B = (Price − Lower Band) / (Upper Band − Lower Band)
- %B = 1.00 → price is exactly at the upper band
- %B = 0.50 → price is exactly at the middle band (the 20 SMA)
- %B = 0.00 → price is exactly at the lower band
- %B > 1.00 → price is above the upper band (outside)
- %B < 0.00 → price is below the lower band (outside)
Why it's useful: it makes "how stretched is this?" a hard number, and it makes divergence visible. If price makes a new high but %B makes a lower high — the second push didn't reach as far into the upper band — that's momentum fading beneath the surface. In a range, %B > 1 into a rejection candle is a clean fade trigger; %B < 0 into a bounce candle is a clean long trigger. It's the bands' version of an oscillator, built from the bands themselves.
%B divergence, worked
Say a stock pushes to a new high of 152.00 and %B reads 1.05 — price is poking above the upper band, strong. It pulls back, then rallies again to a higher high of 152.80, but this time %B reads only 0.88 — price didn't even reach the upper band on the new high. That's a %B divergence: price made a higher high, but its position within the volatility envelope made a lower high. The second push had less thrust relative to its own volatility. In a range or at the end of an extended run, that's a warning that momentum is bleeding out beneath a surface that still looks strong. Pair it with a rejection candle and you have a fade with an actual thesis, not just "it's high."
Bandwidth measures how wide the bands are as a single number:
Bandwidth = (Upper Band − Lower Band) / Middle Band
This is your squeeze detector, quantified. Bandwidth at a 6-month low = a Bollinger squeeze, full stop. You don't have to eyeball "are the bands tight?" — you watch the Bandwidth line drop to the floor. Rising Bandwidth = expansion underway (move maturing). Falling Bandwidth = compression building (move loading). Set an alert on Bandwidth hitting a multi-month low and you'll never miss a squeeze setup on your watchlist again.
Bandwidth as a scanner input
The practical superpower of Bandwidth is that it's a single number you can rank a whole watchlist by. Instead of flipping through 150 charts asking "is this one coiled?", you compute each name's current Bandwidth as a percentile of its own last six months and sort. The names at the 1st–5th percentile of their own Bandwidth are your squeeze candidates for tomorrow — coiled, loaded, waiting. That's how you turn a visual pattern into a systematic hunt. %B automates where price is, Bandwidth automates how loaded the coil is, and together they make the whole tool programmable.
Confluence — Stacking The Bands With Keltner, Volume, and Structure
The bands alone are a partial read. Here's how HPT-style timeframe-weighted confluence turns them into a decision. Confluence isn't piling on indicators until the chart is unreadable — it's assembling a small set of independent tools that, when they agree at one price, raise your conviction and your size.
Bollinger Bands + Keltner Channels = the TTM Squeeze
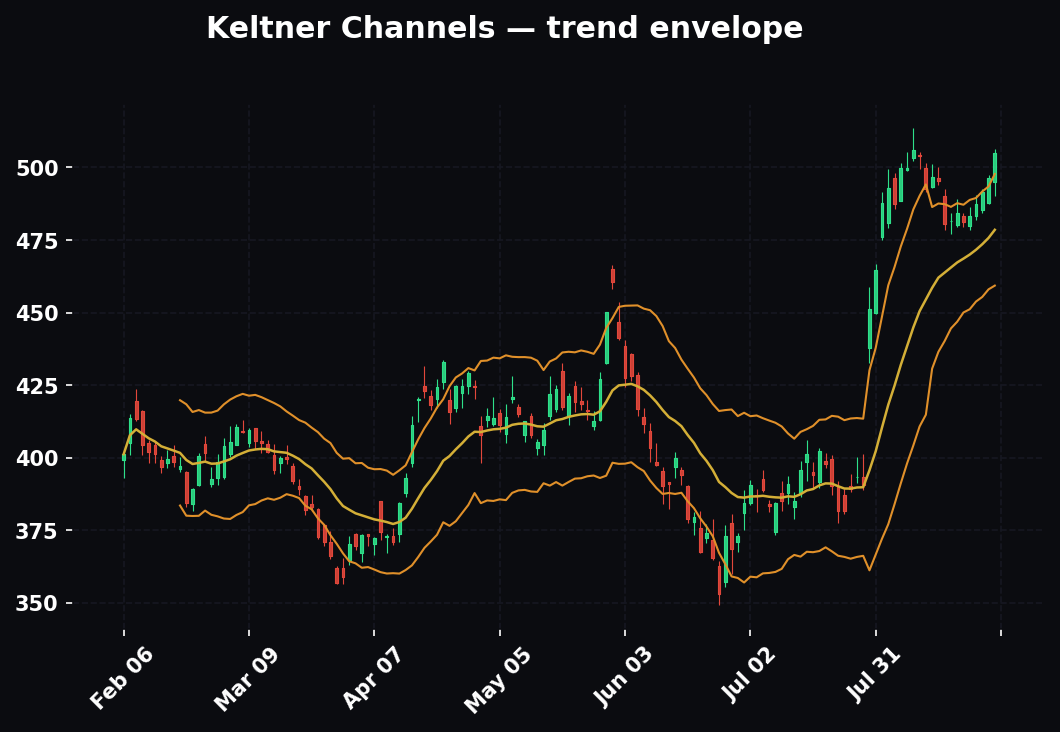
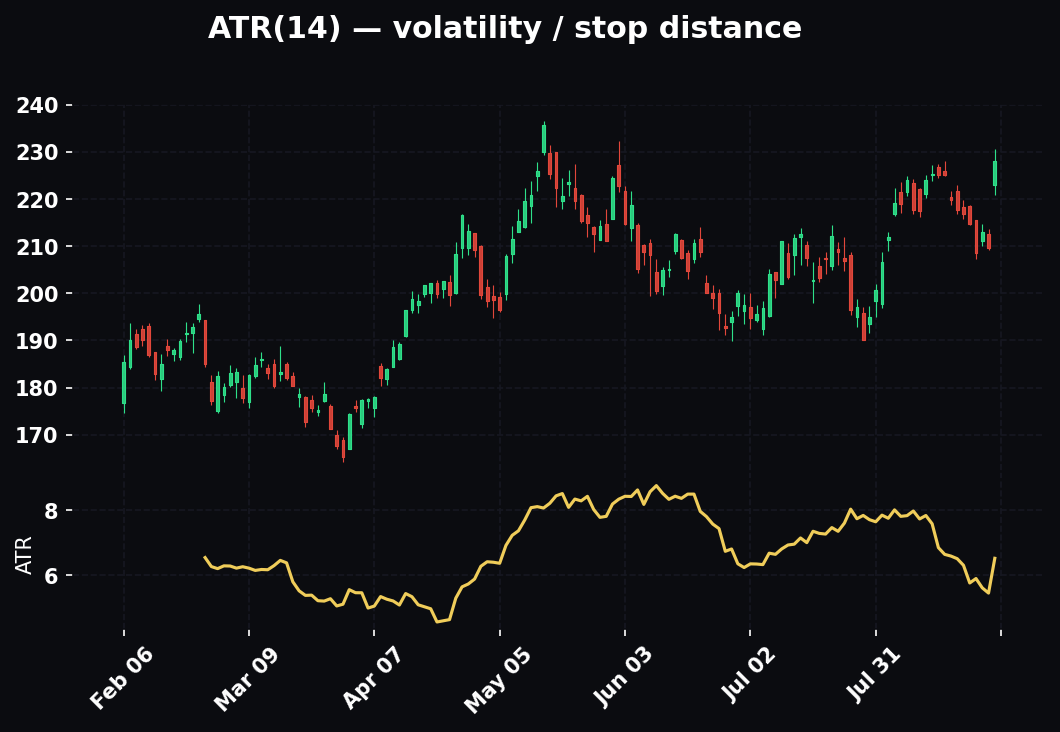
This is the highest-leverage combination on the tool. Keltner Channels look similar — a moving average with an upper and lower channel — but they're built from Average True Range (ATR), a pure volatility measure, instead of standard deviation. The subtle difference is what makes the combo magic. Standard deviation, which the Bollinger Bands use, reacts faster and more dramatically to a sudden drop in volatility than ATR does. So when the market goes truly quiet, the Bollinger Bands contract faster than the Keltner Channels — and slip inside them.
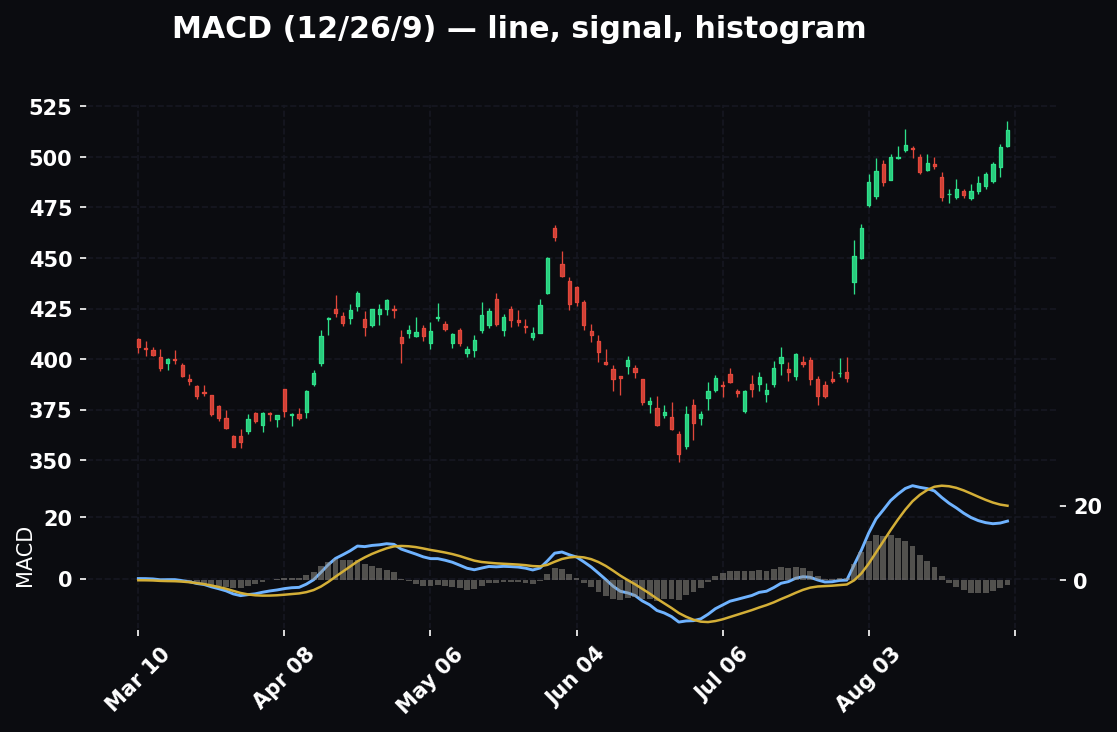
John Carter's famous TTM Squeeze works exactly off that lag: because Bollinger Bands react faster to volatility contraction than Keltner Channels do, in a genuine squeeze the *Bollinger Bands pull inside the Keltner Channels. When BB is inside KC — the squeeze is "on," the market is coiled. When the Bollinger Bands push back outside the Keltner Channels — the squeeze has "fired" and the expansion move is beginning. Most platforms plot this as red dots (squeeze on) turning green (squeeze fired). It converts the whole squeeze concept into a binary on/off light, and it's one of the cleanest setups a beginner can learn. Pair the fire signal with a momentum histogram for direction and you've got a complete entry: the dots tell you when (squeeze fired), the histogram tells you which way* (momentum positive or negative), and your stop goes on the far side of the coil.
Bands + Volume
Volatility and participation should agree. A band break or expansion bar on rising volume is real — the crowd is committing. The same break on limp volume is a trap waiting to reverse. In a range, a lower-band touch with a volume spike and a hammer is a far higher-quality bounce than a quiet drift into the band. Volume is the lie detector for every band signal. Go back to the head-fake example: the thing that separated the fake break from the real break was volume. The fake broke on below-average volume; the real move broke on 2x. When the bands and the tape disagree, believe the tape.
Bands + EMA 12/22/55
The EMAs supply the regime and bias the bands can't. Daily 55 EMA sets the directional bias; the 12/22/55 stack on your trading timeframe tells you walk-or-fade. Only take band signals that agree with the higher-timeframe bias — a lower-band bounce is a much better trade when the daily is above its 55 EMA than against it. This is the pairing that does the heaviest lifting, because it directly supplies the one thing the bands structurally cannot: direction. The bands find the stretch; the EMAs tell you whether that stretch is a springboard or a cliff.
Bands + RSI/MACD
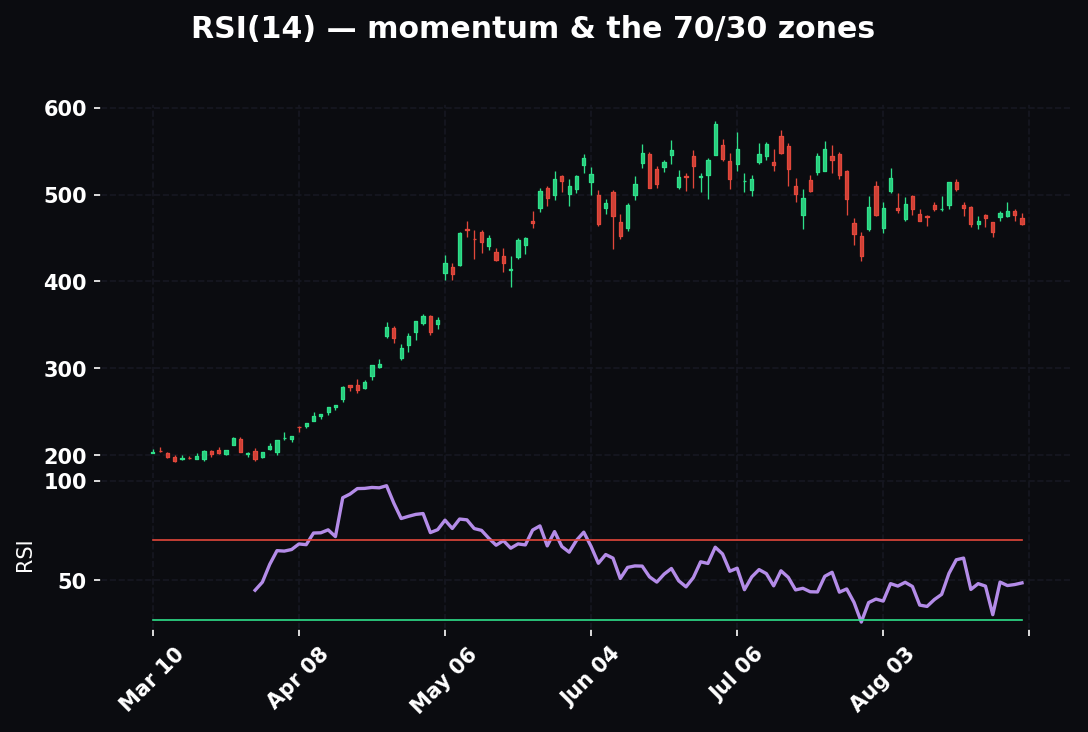
A range-fade off the upper band gets stronger with an RSI failure to make a new high or a MACD bearish cross into the touch. Notice these are independent confirmations — RSI and MACD are momentum tools built from price differently than the bands are built from volatility. When a volatility tool (band touch), a position tool (%B), a momentum tool (RSI divergence), and a trend tool (EMA bias) all point the same way at one price, that's four different lenses agreeing — and that's what conviction is made of.
Confluence isn't more indicators for their own sake — it's independent tools agreeing at one price. When the band touch, the %B divergence, the volume, and the EMA bias all point the same way, you size up. When they conflict, you pass. The levels do the work; discipline banks it.
How The Pros Use It Differently From Beginners
The same three lines, read by two people, produce opposite trades. Here's the gap, laid out, because seeing the contrast is how you cross it.
Beginners read the touch. Pros read the width. The novice's eye goes straight to "price is at the band." The professional's eye goes first to "how wide are the bands relative to their own history" — because width sets regime and regime sets the rulebook. The pro has answered three questions before the beginner has finished looking at the touch.
Beginners think the band is a wall. Pros know it's a handrail in a trend and a wall only in a range. To the beginner, the outer band is always a boundary price shouldn't cross. To the pro, whether it's a boundary or a guide-rail depends entirely on regime — and in a trend, price riding the band is the most bullish thing it can do, not a reason to fade.
Beginners fade strength. Pros trade with it and fade only confirmed exhaustion. The novice's default is countertrend — sell the top, buy the bottom, everywhere. The pro's default is with-trend, and they fade only in a confirmed range with confirmation stacked on top. The pro takes the lower-glamour, higher-probability side almost every time.
Beginners hunt reversals. Pros hunt squeezes. The beginner spends their day trying to call tops and bottoms off band touches. The pro largely ignores touches and spends their attention on Bandwidth, waiting for the coil that offers defined-risk entry at the ignition point. One is fishing for lottery tickets; the other is waiting for the one setup where the math is stacked in their favor.
Beginners use the bands alone. Pros never do. To the novice, the bands are the system. To the pro, the bands are one lens in a stack — regime from EMAs, trigger from candles and volume, bias from the higher timeframe. The bands locate; the stack confirms; discipline sizes.
Beginners fiddle the settings. Pros leave them at 20, 2 and get better at reading. The novice, after a losing streak, tweaks the inputs looking for the magic number. The pro knows the edge was never in the settings — it's in regime recognition, patience for the squeeze, and confirmation discipline. They leave the tool alone and sharpen the reader.
Beginners react to the current bar. Pros anticipate the next regime. The novice trades what the band is doing right now. The pro is already thinking one step ahead: a squeeze means a move is loading, so they pre-position their attention and risk before the move exists. Anticipation, not reaction, is the whole difference in a trade's timing — and timing is where the reward-to-risk lives.
The Mistakes That Cost People Money
Mistake 1 — Fading a band-walk. The number-one killer. Price rides the upper band in a strong uptrend; the beginner shorts every touch "because it's overbought" and gets run over five times in a row. A band touch in a trend is strength. Never fade a walk. Check the EMA stack before you ever call a band touch a reversal. If you fix only one habit, fix this one — it accounts for more blown accounts on this indicator than everything else combined.
Mistake 2 — Treating touches as automatic reversals. A touch is not a signal. Price touching or exceeding a band is normal — it happens constantly, and price can stay outside the band for many bars. A touch is an alert to pay attention, nothing more. The signal is the touch plus confirmation: rejection candle, volume, %B, regime agreement. "It touched the band" is where your analysis starts, not where it ends.
Mistake 3 — Ignoring the regime. Using range rules in a trend and trend rules in a range. This is the same error as #1 and #2 dressed up differently, and it's why regime identification is Step 2 of the read. Get the regime wrong and every other read inverts — a fade becomes a suicide, a with-trend entry becomes a top-tick. Regime first, everything else second.
Mistake 4 — Trading the head fake. Jumping on the first pop out of a squeeze without waiting for a confirmed close and without a plan to flip if it fails. Squeezes love to fake one way first. Respect it. Let the first pop prove itself with a close and volume before you commit, and keep a flip plan ready.
Mistake 5 — Fiddling the settings. Changing 20,2 to some backfit number that looked great on last week's chart. The default is robust across markets and timeframes. Stop optimizing the indicator and start reading it. Every hour spent tuning inputs is an hour not spent learning regime recognition, which is where the actual edge lives.
Mistake 6 — Bands in a vacuum. No structure, no EMAs, no volume — just bands. The bands are a volatility lens, not a system. Alone they're half a read. The other half — direction — has to come from somewhere, and if you don't supply it deliberately, you'll supply it accidentally through bias and hope.
Mistake 7 — Forgetting the bands lag. They're built on a 20 SMA and trailing standard deviation. In a violent gap or news spike, the bands widen after the fact. Don't expect them to catch the very first bar of a shock — they frame the environment, they don't front-run the catalyst. Use them to read the aftermath, not to predict the event.
Mistake 8 — Chasing the expansion bar late. Even when you read a squeeze correctly, entering three bars into the expansion — after price has already run — throws away the entire reward-to-risk gift the squeeze offered. The edge is being early with a tight stop. Enter on the expansion bar or the first pullback, not after the move is half over. Late is just chasing with extra confidence.
Mistake 9 — Reaching for the far band as a target in a range. Fading the upper band toward the lower band assumes the full range plays out every time. Often price stalls at the middle band (the mean) and reverses. In a range, the middle band is the honest, high-probability target. Greed for the far band gives back good trades.
Mistake 10 — Confusing "outside the band" with "extreme." Price closing outside a band is not automatically an extreme — especially when the bands are already wide from a shock. A close outside a narrow, coiled band is meaningful; a close outside an enormous, post-catalyst band is noise. Always read the width the touch is happening in.
Mistake 11 — Boredom-trading the coil. Taking tiny fades off tiny touches inside a squeeze because nothing's happening and you're impatient. The coil is a place to wait, not to trade. Your small scalps inside it will be exactly the positions the expansion bar runs over. Set an alert, sit on your hands.
Mistake 12 — Marrying a direction through the head fake. The flip side of Mistake 4 — not just taking the fake, but refusing to abandon it when it reclaims the range. Ego turns a small stop-out on a fake into a full-size loss on a real move that goes the other way. The squeeze is direction-agnostic by design; hold your directional opinion loosely until the expansion confirms it.
The Playbook — How To Actually Use This Monday
Setup A — The Squeeze Break (highest value).
- Scan for Bandwidth at a multi-month low. Bands visibly pinched, EMAs flat.
- Wait for the expansion bar: decisive close outside the coil, bands flaring, volume ≥ 1.5x average.
- Enter on the break in that direction. Stop on the far side of the coil.
- Target 1:3 minimum off that tight stop. Be ready to flip on a fast failed break (head fake).
Setup B — The Trend Pullback (walk-with-it).
- Confirm uptrend: EMA 12>22>55, price above daily 55.
- Wait for a pullback from the upper-band walk to the middle band (20 SMA).
- Enter long on a bounce candle off the middle band with volume. Stop below the middle band / recent HL.
- Ride toward the upper band. Trail as it walks. Exit on structure break, not on "it touched the band again."
Setup C — The Range Fade (only in confirmed ranges).
- Confirm range: EMAs flat and tangled, clear horizontal boundaries.
- Wait for an upper-band touch with %B ≥ 1, a rejection candle, and RSI/MACD non-confirmation. (Mirror for lower band.)
- Enter the fade. Stop just beyond the band/range extreme. Target the middle band.
- Skip it the moment the EMAs start to trend — the range is dead.
Setup D — The TTM Squeeze Fire (mechanical version of A).
- Load Bollinger Bands + Keltner Channels + a momentum histogram.
- Wait for squeeze-on (BB inside KC, red dots) to flip to squeeze-fired (BB back outside KC, green dots).
- Take direction from the histogram: positive = long, negative = short.
- Enter on the fire, stop on the far side of the coil, target 1:3. This is Setup A with the on/off light doing the eyeballing for you.
Across all four: no confirmation, no trade. The bands hand you the where and when; the candle, the volume, and the EMA bias give you the go.
Frequently Asked Questions
Should I ever change the 20, 2 default? For almost everyone, no. It's robust across instruments and timeframes, and the people who change it are usually curve-fitting to recent charts. If you genuinely lengthen the period for a specific tested reason, widen the deviations slightly (Bollinger's guidance: ~2.1 at 50 periods); if you shorten it, tighten them (~1.9 at 10 periods). But the honest answer is: leave it and get better at reading.
Do Bollinger Bands work on all timeframes? Yes — the mechanism (volatility mean-reverts) is scale-independent, so squeezes, walks, and fades appear on the 1-minute and the weekly alike. What changes is noise: lower timeframes have more false signals, so confirmation discipline matters more the lower you go. The multi-timeframe section is how you manage that.
Which is better, Bollinger Bands or Keltner Channels? Wrong question — they're better together. That's the whole TTM Squeeze insight. Bollinger uses standard deviation (reacts faster to volatility change); Keltner uses ATR (smoother). The fact that BB contracts inside KC in a real squeeze is precisely because they measure volatility differently. Use both.
Can I trade Bollinger Bands by themselves? You can trade the squeeze with just the bands and volume, because the squeeze is the one signal that's mostly self-contained. But for touches, walks, and fades you need regime (EMAs) and confirmation (candles, volume) — the bands alone don't supply direction. Trading touches on bands alone is Mistake 6.
What's the single best signal on the tool? The squeeze, without close competition. It's the only read that gives you an edge in timing rather than a description of the present, and its tight stop is what makes 1:3 reward-to-risk achievable.
Why did price keep going after touching the band — isn't that "impossible"? No. The "95% inside the bands" figure is a normal-distribution idealization, and markets have fat tails and trends. In a strong trend price rides the outer band for many bars. A touch is normal, not extreme. Expecting the band to contain price is Mistake 2.
How do I avoid the head fake? Wait for a confirmed close outside the coil on above-average volume before committing, and keep a flip plan ready. If a break reclaims the range fast on weak volume, it was a fake — don't marry it. Better to enter the second, confirmed move than to get chopped on the first, unconfirmed one.
Do the bands predict direction at all? No, and internalizing that is the whole point of this guide. They measure volatility and price's position within it. Direction comes from structure, EMAs, and higher-timeframe bias — you supply it; the bands don't.
What's %B actually for? Turning "how stretched is price?" into a single number you can set rules and alerts on, and making divergence visible (price higher high, %B lower high = fading thrust). It's the bands rendered as an oscillator.
What's Bandwidth actually for? Detecting and ranking squeezes numerically. A multi-month Bandwidth low is a squeeze; sorting a watchlist by each name's Bandwidth percentile surfaces tomorrow's coiled setups without flipping through every chart.
Quick-Reference Cheat Sheet
- Construction: 20-period SMA (middle), ±2 standard deviations (upper/lower). Default 20,2 — leave it.
- What they measure: VOLATILITY, not direction. Width = volatility. Position = stretch. Regime supplies direction.
- Read order: Width first → regime (EMAs) → walk or fade → width extremes → confirm with candle + volume. Regime before touch, always.
- Width tight (squeeze): move loading. Highest-value signal. Trade the confirmed expansion, tight stop, watch the head fake.
- Width wide (bulge): move mature. Manage risk, don't chase. In a shock, a huge outer band is normal, not extreme.
- Trend regime (EMA 12/22/55 stacked): price WALKS the band. Touch = strength. Trade WITH it. Never fade a walk. Walk ends on structure break, not touch count.
- Range regime (EMAs flat): price FADES off the band toward the middle. Touch + confirmation = reversion trade. Target the middle band.
- High-vol regime (shock): bands blow wide; use them for risk, not entries. Size down.
- Low-vol regime (coil): wait, don't boredom-trade. Set a Bandwidth alert.
- %B: where price sits in the bands. 1 = upper, 0.5 = middle, 0 = lower, >1 or <0 = outside. Watch for divergence (price higher high, %B lower high).
- Bandwidth: how wide the bands are. Multi-month low = squeeze. Rising = expanding. Falling = compressing. Rank a watchlist by it to hunt coils.
- TTM Squeeze: BB inside Keltner Channels = squeeze ON; BB pushes back outside KC = squeeze FIRED. Take direction from a momentum histogram.
- Volume: confirms every band signal. Break on volume = real. Break on no volume = trap. When bands and tape disagree, believe the tape.
- Multi-timeframe: higher TF sets bias, trading TF sets setup, lower TF sets trigger. Size up when they nest; pass when they conflict.
- Bias: daily 55 EMA sets the side. Trade band signals that agree with it.
- Touch ≠ reversal. A touch is an alert. The signal is touch + confirmation + regime.
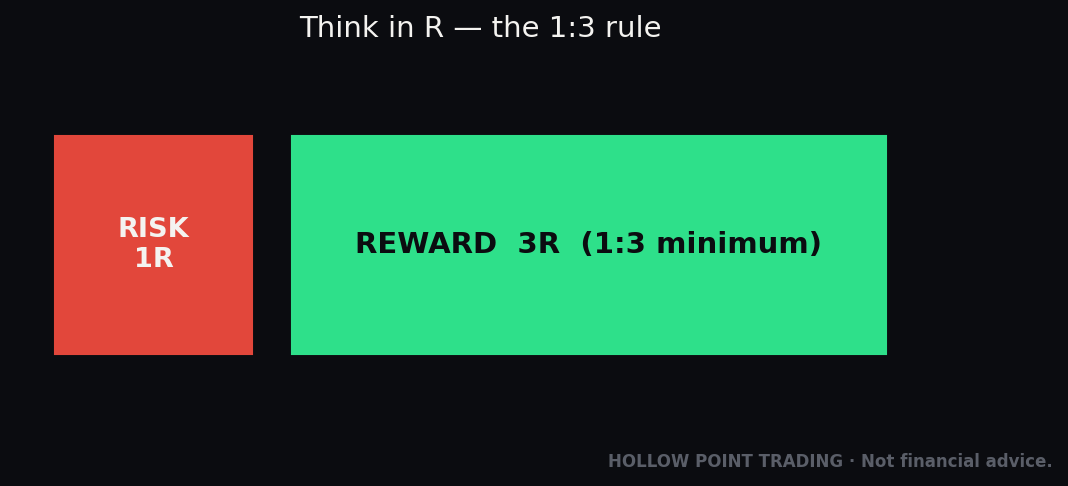
- R/R: 1:3 minimum. The squeeze's tight stop is what makes the math work. Enter early or don't enter — chasing the expansion late throws the edge away.
The bands aren't a crystal ball and they were never meant to be. They're a volatility microphone — they tell you when the market is quiet and coiling, when it's loud and stretched, and where price sits in that envelope. Supply the direction yourself from structure and your EMAs, wait for the coil to fire, confirm with the tape, and let a tight stop do the heavy lifting on your reward-to-risk. That's the whole discipline. The levels do the work; you just have to stop fading strength and start respecting the squeeze.
Bound by rules, feared by trade.