
Here is the uncomfortable truth nobody selling you a "97% win rate" course wants you to sit with: you can be right about direction more often than you're wrong and still blow up your account. You can have a brilliant read on the tape, nail the macro, pick the strongest stock in the strongest sector — and hand it all back because you sized one trade too big, refused to take one loss, or held five positions that were secretly the same bet.
Trading is not a game of being right. It's a game of staying solvent long enough for your edge to pay out. Risk management is the machine that keeps you in the chair. Everything else — your indicators, your entries, your thesis — is what you do while the risk machine keeps you alive.
This is the guide I wish someone had drilled into me before I learned it the expensive way. We're going to cover the math of drawdown, fixed-fractional risk, how to size a position off your stop, thinking in R-multiples, expectancy and why 1:3 is the floor, structural stops, scaling, correlation risk, how the whole system behaves in different market regimes, how it stacks across timeframes, how it combines with your other tools, the mistakes that quietly kill accounts, and the psychology of actually taking the loss. Worked numbers throughout. Let's build the machine.
Why Risk Is The Job, Not Entries
Beginners obsess over entries because entries feel like skill. Finding the perfect setup, the exact bar to click buy — that's the part that looks like being a genius trader in a movie.
But your entry is the one variable you control the least. Once you're in, the market does whatever it wants. What you actually control is:
- How much you lose when you're wrong (position size + stop)
- How much you make when you're right (targets + management)
- How often you're willing to be wrong before you step back (drawdown limits)
Notice all three are risk decisions, not entry decisions. A mediocre entry with disciplined risk survives. A perfect entry with sloppy risk dies. The market is an infinite series of setups; there's another one in five minutes. There is not an infinite series of accounts. You get the ones you fund. Protect them like they're the finite resource they are.
The Hollow Point ethos is built on this inversion: discipline over prediction. You don't need to predict. You need to control the downside so precisely that being wrong is survivable and being right is profitable. Do that, and a modest edge compounds into a career.
The two questions that reorganize everything
Every professional trade starts with two questions asked in a specific order, and beginners ask them backwards. The beginner asks first, "How much can I make?" and only later, if at all, "How much can I lose?" The professional asks, "Where am I wrong, and what does that cost me?" before thinking about upside at all. The reason is structural: the downside is knowable and fixable in advance, while the upside is a hope. You can guarantee your maximum loss with a resting order. You cannot guarantee a single dollar of profit. So you engineer the thing you can control and let the thing you can't take care of itself.
This is why we say risk is the job. The entry is a five-second decision. The risk architecture — how much, where's the stop, what's the reward ratio, does this correlate with what I already hold, what happens to my week if this and two others all lose — that's the actual work. When you catch yourself spending 90% of your screen time hunting entries and 10% on risk, you have the ratio inverted, and the market will eventually collect the difference.
The professional's mental inversion
There's a mental trick that separates the traders who last from the ones who churn. Beginners think of a trade as a bet on being right. Professionals think of a trade as the purchase of an option on being right, at a fixed and known price. You pay 1R. In exchange, you get a shot at 3R or more. If the shot misses, you lose exactly what you paid — no more, because you set that price in advance and enforced it with a resting order. Reframed this way, a losing trade is not a failure; it's an option that expired worthless. You budgeted for it. It's a line item, not a wound.
The Math Of Drawdown: Why A 50% Loss Needs A 100% Gain
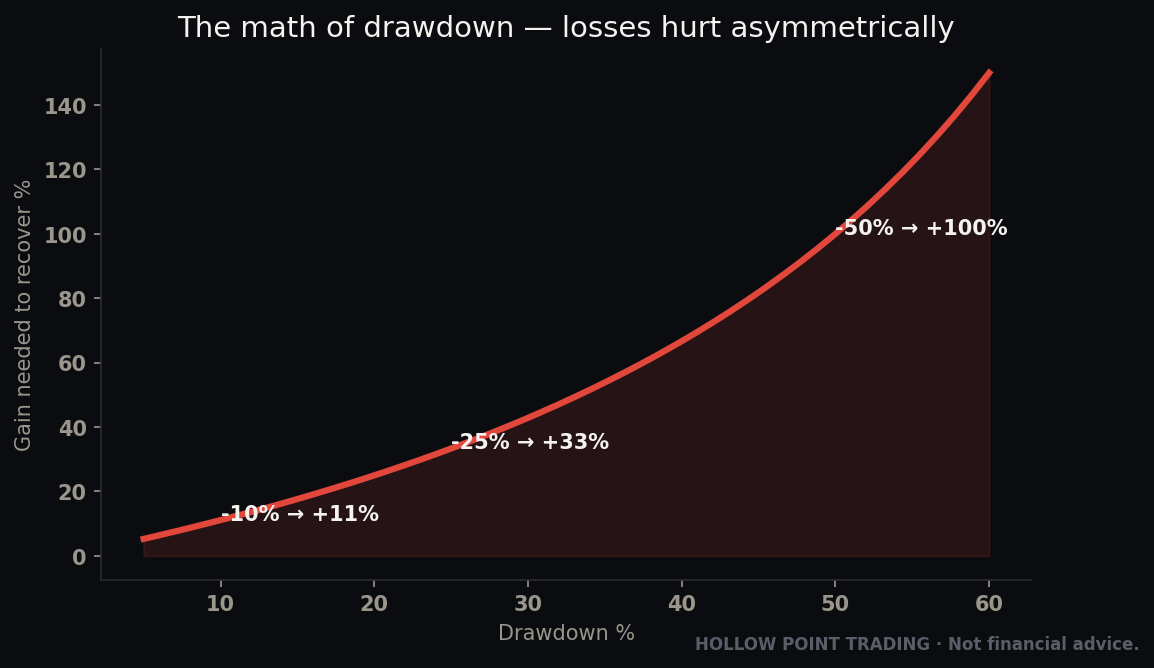
This is the single most important arithmetic in trading, and it's the one most people never actually run. Losses and gains are not symmetric. When you lose a percentage of your account, you have to gain a larger percentage just to get back to even, because you're now working from a smaller base.
Here's the recovery math. If you lose X%, the gain you need to recover is:
Gain needed = Loss / (1 − Loss)
Run it across the ladder:
| Drawdown | Gain required to break even |
|---|---|
| 10% | 11.1% |
| 20% | 25% |
| 30% | 42.9% |
| 40% | 66.7% |
| 50% | 100% |
| 60% | 150% |
| 70% | 233% |
| 80% | 400% |
| 90% | 900% |
Read that table slowly. A 10% loss is a shrug — you need 11% to recover, roughly symmetric. But the curve goes vertical fast. Lose half your account and you don't need to make half back — you need to double what's left. Lose 80% and you need a 400% return, a five-bagger on your remaining capital, just to be flat.
Concrete: you start with $50,000. You take a brutal stretch and draw down 50% to $25,000. To get back to $50,000, you must make $25,000 on a $25,000 base — a 100% return. If you're a genuinely excellent trader compounding 20% a year, that's roughly 3.8 years of elite performance just to erase the hole.
This is why the entire game is not going there. Small losses are recoverable in the normal course of business. Deep drawdowns are career-enders not because the money is gone, but because the math of getting it back is so hostile — and because the psychological damage of trying to make 100% back usually triggers exactly the reckless behavior that finishes the account off.
The compounding cost of time
The recovery table only shows the arithmetic hole. It hides a second, crueler cost: time and compounding you'll never get back. Money that isn't in your account can't compound. Suppose two traders both start at $50,000 and both compound at a genuine 25% a year. Trader A never has a drawdown worse than 8%. Trader B has one 45% drawdown in year two and then trades identically well forever after. Ten years later, Trader A is miles ahead — not because B's edge was worse, but because B's compounding curve got amputated at the knee and had to regrow from a stump. The drawdown didn't just cost the dollars lost; it cost every dollar those dollars would have earned for a decade. Deep holes steal your future, not just your present.
Why the psychological hole is deeper than the math hole
Here's the part the table can't show you. When you're down 40%, you are not the same trader you were at even. You're scared, you're angry, you're desperate to "make it back," and desperation is the exact emotional state that produces oversized revenge trades and abandoned stops. So the deep drawdown is doubly lethal: the math of recovery is hostile and the person attempting the recovery is compromised. This is why shallow-by-design isn't just financial hygiene — it's how you keep the decision-maker intact. A trader who never goes below a 10% drawdown is always trading with a clear head. A trader at −50% is trying to solve the hardest math in trading with the worst version of their own mind. The takeaway that flows from this table: keep your losses small and shallow by design, before you ever enter, so you never get near the vertical part of the curve — for the sake of both the account and the operator. Which brings us to the mechanism.
Fixed-Fractional Risk: The 1–2% Rule
The core mechanism of survival is fixed-fractional risk sizing. You decide, in advance, the maximum percentage of your account you're willing to lose on any single trade. Then you size every position so that if your stop gets hit, you lose exactly that amount and no more.
The standard, battle-tested number is 1–2% of account equity per trade. Beginners and anyone still proving their edge should live at 1% or below. Even seasoned pros rarely exceed 2%.
Why so small? Do the survival math. At 2% risk per trade, how many losers in a row does it take to lose 20% of your account (the zone where recovery gets ugly)?
Because you're risking a fixed fraction, each loss shrinks the next bet slightly, so it's not simply 10 losses. Running the compounding: after 10 straight 2% losses you're down to about 81.7% of your account — roughly an 18% drawdown. At 1% risk, ten losers in a row only takes you to about 90.4% — a 9.6% drawdown, a scratch.
Now flip it to 10% risk per trade, the kind of size a gambler uses to "make it back fast." Ten losers takes you to about 34.9% of your account — a 65% drawdown requiring a 187% gain to recover. Same losing streak. One version is a bad week. The other is the end.
Streaks of 6, 8, even 10 losers happen to everyone, including profitable traders, purely through variance. Fixed-fractional sizing at 1–2% is what turns an inevitable cold streak from a catastrophe into a footnote. That's the whole point: it makes the unavoidable survivable.
The math of losing streaks you will experience
People underestimate how common long losing streaks are because they intuitively expect a 50%-win system to alternate win-loss-win-loss. It doesn't. Randomness clusters. If your true win rate is 40% — which is a profitable rate at 1:3 — the probability of hitting a run of six straight losers somewhere across a few hundred trades isn't a freak event; it's an expectation. With a 40% win rate, each loss has a 60% chance of being followed by another loss, so six in a row has a raw probability of 0.6^6 ≈ 4.7% on any given starting point — and across 200 trades you'll get multiple starting points, making a six-streak nearly certain to appear at least once. Eight-streaks show up over a career. The question is never whether you'll hit an ugly cold run; it's whether your sizing turns it into a 6% dip you barely notice or a 40% crater you spend two years climbing out of. Fixed-fractional sizing is the answer that's already decided before the streak begins.
Fixed-fractional vs. fixed-dollar vs. fixed-share
There are three ways people size, and only one of them is self-correcting.
Fixed-share ("I always buy 100 shares") ignores both account size and stop distance. It's the worst of the three — your dollar risk swings wildly from trade to trade depending on where the stop lands, and a single wide-stop trade can risk 5x what a tight one did without you noticing.
Fixed-dollar ("I always risk $500") is better — at least your risk per trade is constant. But it doesn't scale with the account. After a good run to $80,000 you're still risking the same $500 you risked at $40,000, leaving growth on the table; after a drawdown to $30,000 you're still risking $500, which is now a larger fraction and quietly accelerating the bleed.
Fixed-fractional ("I always risk 1% of current equity") is the professional standard because it's anti-fragile against your own results. When you're winning and the account grows, your dollar risk grows with it, so winners compound. When you're losing and the account shrinks, your dollar risk automatically shrinks too, so the cold streak decelerates itself. The method leans into strength and eases off in weakness without you having to make a single emotional decision. That automatic throttle is the whole magic.
Recompute the base on a schedule, not every trade
A practical wrinkle: if you literally recompute 1% off your exact equity after every single fill, your size jitters constantly and a bad morning shrinks your afternoon size in a way that can feel punishing. Most pros pick a cadence — recompute the risk base weekly or monthly, or after any move of more than ~10% in equity — and hold that dollar-R constant in between. So you might decide, "This month, 1R = $520," and size every trade to $520 until the next reset. This keeps the discipline of fixed-fractional while removing the noise. The key is that the base does ratchet down after a real drawdown — you're just not whipsawing your size intraday.
Position Sizing Off The Stop: The Worked Math
Here's where most people get it backwards. They pick a share count first ("I'll buy 100 shares") and then wonder where to put the stop. That's insane — your share count should be the output, not the input.
The correct order is:
- Decide your account risk in dollars (your % rule).
- Find your entry and your structural stop (more on structure below).
- Measure the stop distance (dollars per share/contract from entry to stop).
- Divide. Position size = dollar risk ÷ stop distance.
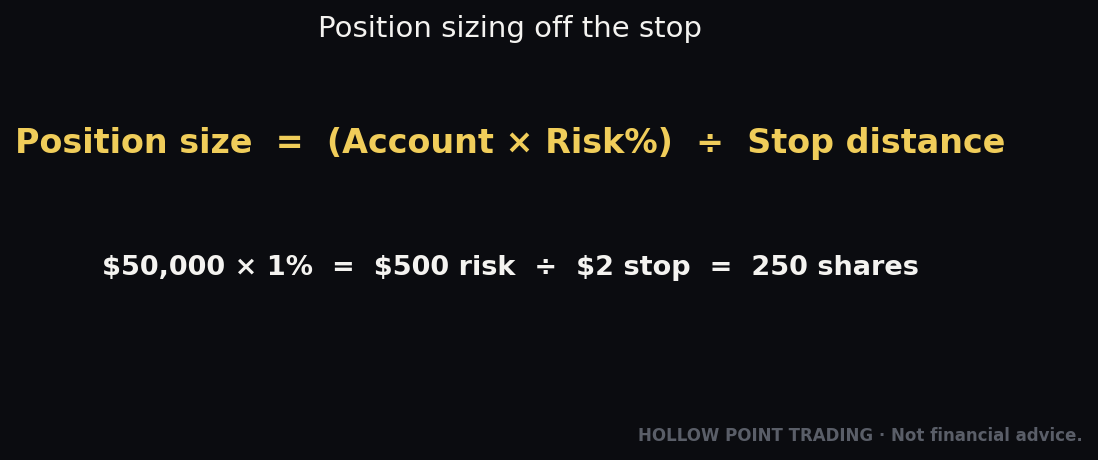
The master formula:
Position size = (Account × Risk %) ÷ (Entry − Stop)
Let's run it four times so it becomes muscle memory.
Example 1 — Stock, tight stop. Account: $50,000. Risk: 1% = $500. You want to buy XYZ at $100 with a stop at $97 (structure just below a support shelf). Stop distance = $100 − $97 = $3 per share. Shares = $500 ÷ $3 = 166 shares (round down to 166). Position cost = 166 × $100 = $16,600. If stopped, 166 × $3 = $498. Right at your 1%.
Example 2 — Same account, wider stop. Same $500 risk. Now the setup needs a stop $6 away — entry $100, stop $94. Shares = $500 ÷ $6 = 83 shares. Position cost = 83 × $100 = $8,300. If stopped, 83 × $6 = $498. Still 1%.
Look at what just happened. The wider stop didn't make you risk more — it made you buy fewer shares. Your dollar risk stayed pinned at $500. The stop distance sets the size; the size never sets the risk. This is the entire mechanism, and internalizing it fixes 90% of blow-up behavior.
Example 3 — Bigger account, 2% risk, more expensive stock. Account: $100,000. Risk: 2% = $2,000. Entry $250, structural stop $238. Stop distance = $12. Shares = $2,000 ÷ $12 = 166 shares. Position cost = 166 × $250 = $41,500 — a big-looking position, 41% of the account in one name. But the risk is still just $2,000, because the stop is only $12 away. This is why position cost and position risk are different animals. Never confuse "I have a lot of capital deployed" with "I have a lot at risk."
Example 4 — Futures (NQ), because HPT lives on the tape. Account: $50,000. Risk: 1% = $500. NQ (Nasdaq 100 futures) moves $20 per point on the full contract, or $5 per point on the Micro (MNQ). Say your entry is 20,000 and structure puts your stop 20 points away. On the Micro: 20 points × $5 = $100 risk per contract. Contracts = $500 ÷ $100 = 5 MNQ contracts. On the full NQ: 20 points × $20 = $400 per contract. You could hold 1 contract ($400 risk) and stay under $500; 2 contracts ($800) would break your rule. The instrument's tick value is just another version of "stop distance in dollars." Same formula, always.
Example 5 — Options, where the stop is on the underlying
Options confuse people because the contract price and the thing you're actually betting on move at different speeds. Do not size off the option premium's wiggle — size off the underlying's structural stop, translated through delta.
Account: $50,000. Risk: 1% = $500. You're long SPY calls. The underlying is at $560; your structural stop on SPY is $555 — a $5 move against you invalidates the idea. Your calls have a delta of roughly 0.50, so for a $5 move in SPY you expect roughly $5 × 0.50 = $2.50 of premium loss per share, or $250 per contract (100 shares). Contracts = $500 ÷ $250 = 2 contracts. You then set an alert (or a mental trigger) at SPY $555, not at some arbitrary premium level, because the underlying's structure is what proves you wrong. The premium is just the vehicle. (This is a simplification — delta shifts as price and time move, and a fast adverse move can cost more than the linear estimate, so it's prudent to treat the delta-based number as a floor on risk, not a ceiling, and give yourself margin.)
Example 6 — Accounting for slippage and gaps
Every example above assumes you exit at exactly your stop price. In fast tape you won't. A stop order becomes a market order when touched, and in a thin or gapping market it can fill well past your level. So your true risk is a little wider than your drawn stop.
Practical fix: pad your risk estimate. If your stop distance is $3, size as though it were $3.30–$3.50 to leave room for slippage — meaning you buy slightly fewer shares than the clean formula says. On instruments prone to gaps (single stocks over earnings, low-float names, overnight futures holds), the pad should be bigger, or you simply don't hold through the gap-risk event at all. The trader who sizes to the optimistic fill is the one who discovers, on the one bad morning, that their "1% risk" was really 2.5%.
The discipline: you never adjust the risk to fit the position you want. You adjust the position to fit the risk you've allowed.
R-Multiples: Learn To Think In R
Once you size off your stop, something beautiful happens — every trade becomes measurable in the same unit, no matter the price, the instrument, or the size. That unit is R.
R is your initial risk on the trade — the dollar amount you'd lose if stopped. In Example 1, R = $500. That's it. Now every outcome gets expressed as a multiple of R:
- Stop out = −1R (you lose your defined risk)
- Take profit at 3× your risk = +3R
- Cut early for a small loss = maybe −0.4R
- Let a winner run to 5× = +5R
Thinking in R detaches you from dollars, which is where emotion lives. A $500 loss feels like something. "−1R" is just a data point — one of a thousand you'll log. It flattens the emotional spikes and lets you evaluate your trading as a statistical process instead of a series of gut punches and victory laps.
It also makes trades comparable. A +2R on a $200 risk and a +2R on a $2,000 risk are the same quality of trade, even though one made 10× the dollars. When you journal in R, you can finally see whether your decisions are good, independent of how much you happened to be sizing that week. Every serious trader's journal has an R column. Start yours today.
Your account performance is then just the sum of your R-multiples. A month of: −1, −1, +3, −0.5, +2, −1, +4, −1 = +4.5R. If your average R was $500, that's +$2,250. Clean, countable, emotionless.
R lets you audit your own execution
Here's the deeper payoff. When you log in R, you can separate two things that beginners fatally conflate: the quality of your decisions and the luck of your outcomes. Two traders both make +3R on paper. One planned a 1:3 trade, held to target, and banked exactly what the setup offered — a clean, repeatable +3R. The other planned a 1:1, got lucky when the stock ran, and rode a windfall to +3R he had no plan to capture and won't capture again. Same number, completely different process. Only an R-based journal, with your planned R:R logged next to your realized R, exposes the difference. Over a hundred trades, the gap between your average planned R and your average realized R is the single most diagnostic number in your trading. If realized is far below planned, you're bailing early. If realized swings wildly above planned on a few names, you're getting rescued by luck, not skill — and luck reverts.
The distribution matters more than the average
Don't just track your average R — look at the shape of your R distribution. A healthy trend-following profile is a pile of small −1R and −0.3R losers with a thin tail of big +4R, +6R, +9R winners. That's what asymmetric payoff actually looks like on paper. The danger sign is the opposite shape: lots of small +0.5R and +1R winners (you're bailing on winners early to feel good) and a fat tail of −2R, −3R, −5R losers (you're letting losers run past the stop). That distribution feels good day to day — you win often — but it's a slow-motion account death, because the rare big loser eats a month of small wins. If your journal shows that shape, you don't have a strategy problem; you have a discipline problem, and R is the only lens that makes it visible.
The 1:3 Minimum And Expectancy: The Engine Of The Edge
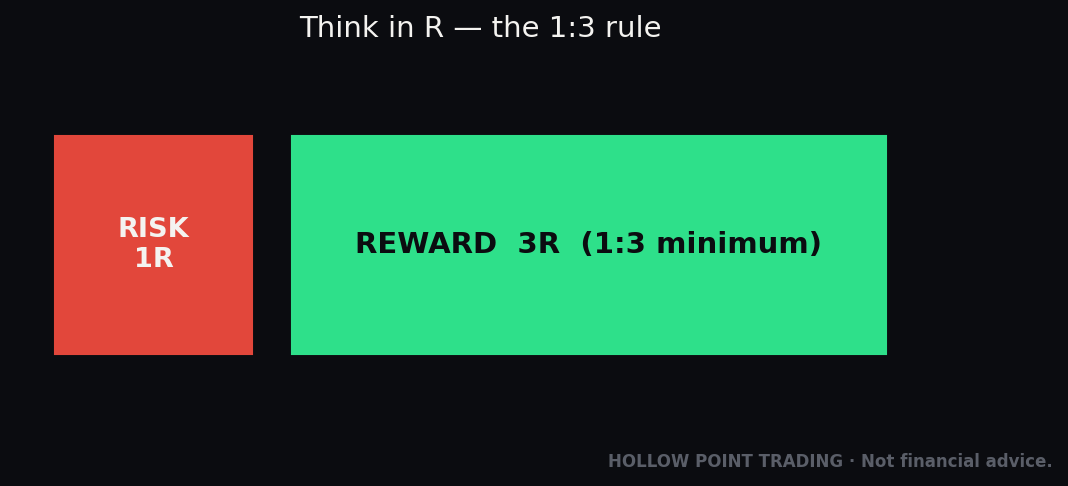
Here's the payoff for all this structure. The Hollow Point standard is a 1:3 risk/reward minimum — you don't take the trade unless the target is at least 3× the distance of your stop. Risk 1R to make 3R or more, or pass.
Why does this matter so much? Because of expectancy — the average amount you expect to make (or lose) per trade over a large sample. This is the formula that determines whether you have a business or a slow leak:
Expectancy = (Win% × Avg Win) − (Loss% × Avg Loss)
The magic of a 3:1 reward structure is that it lets you be wrong most of the time and still make money. Watch.
Suppose you win only 40% of your trades. Six out of ten are losers. Sounds like a struggling trader. But you enforce 1:3 — average win = 3R, average loss = 1R:
Expectancy = (0.40 × 3R) − (0.60 × 1R) = 1.2R − 0.6R = +0.6R per trade.
You lose more often than you win and you net +0.6R every single trade on average. Over 100 trades at $500 risk each, that's +60R = +$30,000. That's the entire secret of professional trading in one line: asymmetric payoff beats high accuracy.
Now find the break-even win rate for a 1:3 payout. Set expectancy to zero:
(W × 3) − ((1−W) × 1) = 0 → 3W − 1 + W = 0 → 4W = 1 → W = 25%.
At 1:3, you only need to be right one time in four to break even. Everything above 25% is profit. Compare that to a trader taking 1:1 trades, who needs to win more than 50% just to survive costs. The reward ratio is doing the heavy lifting, not the crystal ball.
This is why HPT weights the whole process toward finding 1:3+ setups and skipping everything else. Most "setups" don't offer 3R of room before the next wall. Those aren't trades — they're temptations. The discipline of demanding 1:3 is what makes a coin-flip win rate profitable. Miss this and no entry system on earth will save you.
The break-even table you should memorize
Different reward ratios have different break-even win rates, and knowing them lets you judge any trade instantly:
| Reward:Risk | Break-even win rate |
|---|---|
| 1:1 | 50% |
| 1:1.5 | 40% |
| 1:2 | 33% |
| 1:3 | 25% |
| 1:4 | 20% |
| 1:5 | 16.7% |
The lesson jumps off the page: as you demand more reward per unit of risk, the accuracy you need to survive collapses. A 1:5 trade only needs to hit one time in six. This is why patient traders who wait for high-R setups can be "wrong" constantly and still compound — and why traders scalping 1:1 are locked into a brutal accuracy requirement that leaves no margin for the inevitable cold streak or a few bad fills.
Expectancy per trade vs. expectancy per unit of time
There's a subtlety that separates good traders from great ones. Raw expectancy per trade isn't the whole story — what compounds your account is expectancy times frequency. A setup worth +0.6R that appears twice a week generates +1.2R weekly. A setup worth +1.0R that appears once a month generates +0.25R weekly. The lower-expectancy setup, if it fires often enough, builds the account faster. So when you evaluate a strategy, ask both "what's the edge per trade?" and "how often does it fire?" The two together — call it R per week or R per month — is the number that actually pays your bills. This is also why over-filtering to only "perfect" setups can quietly starve your account: a pristine +2R setup that shows up twice a year loses to a solid +0.6R setup you can take twice a week.
The honesty tax
One caution: expectancy is only real if your win rate and your R:R are honest. If you set 1:3 targets but keep bailing at +0.8R while letting losers run to −1.5R, your real numbers are nothing like your planned ones. Suppose you plan +0.6R expectancy but actually realize +0.9R winners and −1.4R losers at the same 40% clip: (0.40 × 0.9) − (0.60 × 1.4) = 0.36 − 0.84 = −0.48R per trade. You've inverted a winning system into a losing one purely through execution, without changing a single entry. The math only works if you execute the math. Which is a psychology problem — we'll get there.
Stop Placement: Structure, Not An Arbitrary Percentage
Everything above depends on one thing: a stop that's placed where it actually belongs. Get this wrong and every other number is fiction.
The cardinal sin is the arbitrary stop — "I'll risk 5%," or "I'll set my stop $2 away," chosen because it fits the size you wanted rather than because it means anything on the chart. The market has no idea where your arbitrary line is, so it'll blow through it or miss it at random.
The right way: place your stop where your trade thesis is proven wrong, then size to it. Structure defines the stop; the stop defines the size. Structure means:
- Below a swing low (for longs) or above a swing high (for shorts) — the level that, if broken, says the trend you're trading has failed.
- Beyond a support/resistance shelf — the horizontal where buyers/sellers have defended before.
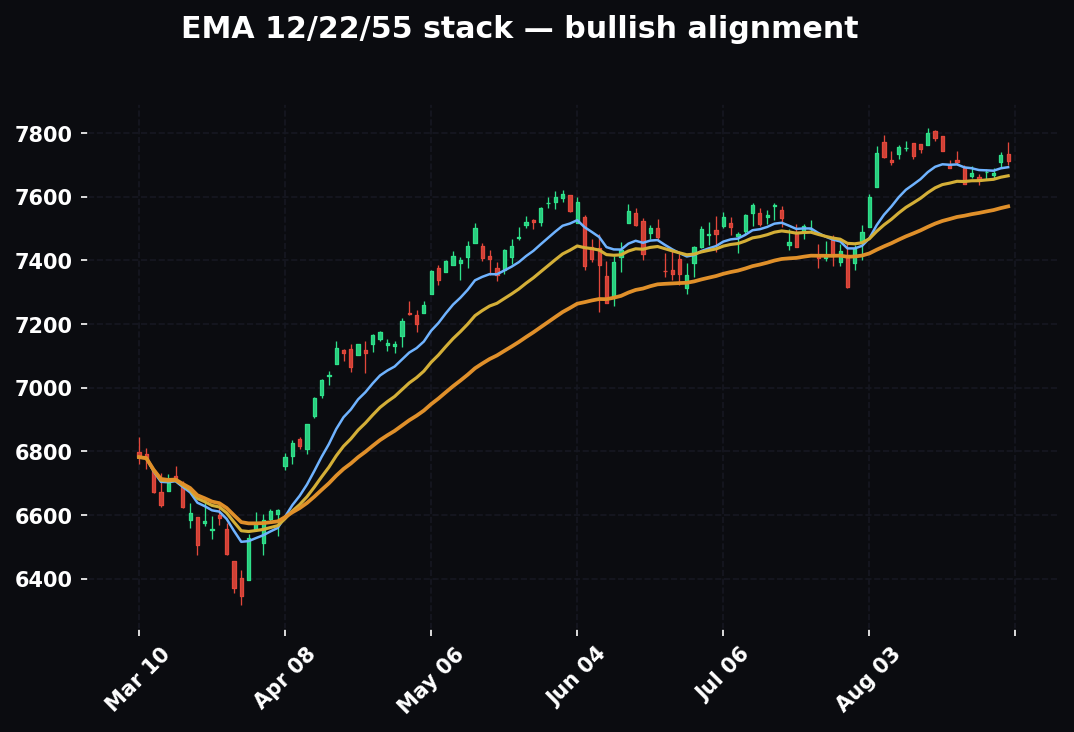
- Past a moving average that's acting as dynamic support — in the HPT framework, the EMA 12/22/55 stack; the 55 is the bias tell.
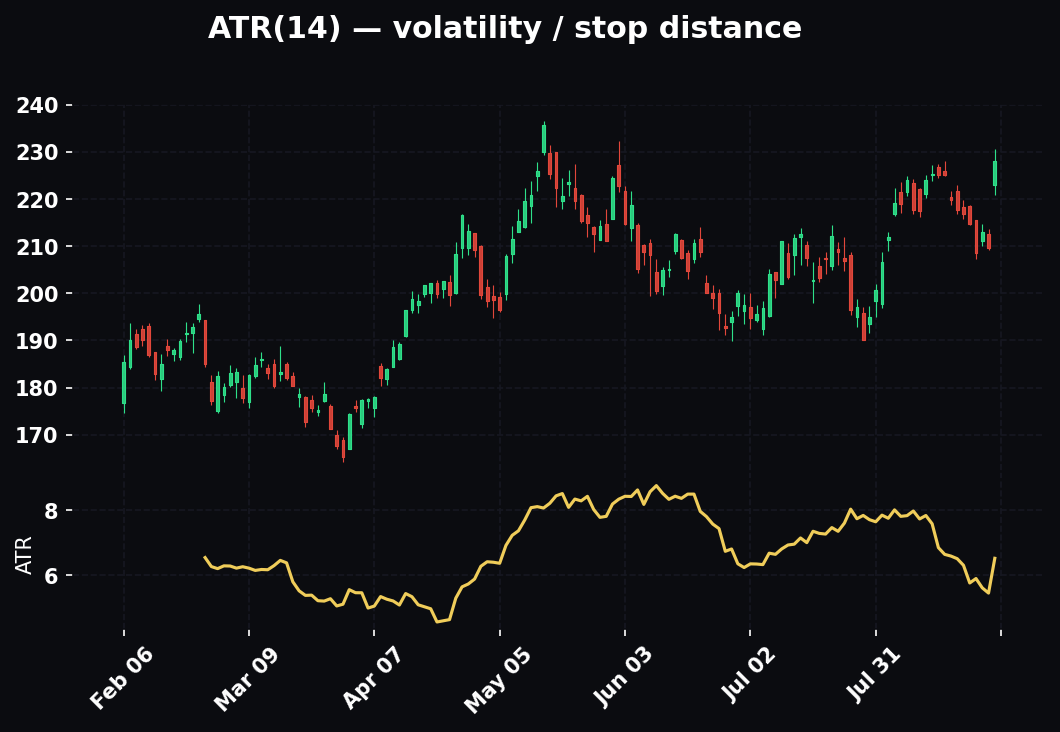
- Outside the noise — use a volatility measure like ATR (Average True Range, the typical range of a bar) so you're not stopped by normal wiggle. A common approach: stop = structure level ± some fraction of ATR, so you're just beyond where random movement reaches.
The logic: your stop should sit at the price where you were simply wrong — not where you got shaken out of a still-valid idea. If the level that invalidates your thesis is far away, the trade requires a wide stop, which means a small position (Example 2). If invalidation is close, you get a tight stop and can size up. Either way, the dollar risk stays constant. The structure sets distance; distance sets size; risk never moves.
The ATR buffer, worked
Say you're long a stock at $50. The nearest swing low — the structural invalidation — is $48.50. If you set your stop exactly at $48.50, you'll get picked off constantly, because market makers and algos probe just below obvious levels to trigger stops before reversing. So you add a volatility buffer. The 14-period ATR is $0.40. You place your stop a fraction of an ATR below the level — say 0.5 × ATR = $0.20 — putting the stop at $48.30 rather than $48.50. Now a normal wiggle to $48.45 doesn't kill you, but a genuine break of structure to $48.30 does, because at that point the swing low is truly broken and your thesis is truly wrong. Stop distance = $50 − $48.30 = $1.70, and you size off that. The buffer is the difference between getting stopped by noise and getting stopped by information.
Why tight stops aren't automatically better
Beginners love tight stops because a tight stop means a big position, which means big P&L when it works. But a stop placed inside the noise — closer than the structure justifies — is just a donation. You'll get 1R-stopped over and over on trades that would have worked, because your stop was inside the range the price naturally breathes through. The correct stop is as tight as the structure allows and not one tick tighter. Sometimes that structure is close and you get a beautiful tight stop and a big position. Sometimes it's far and honesty demands a wide stop and a small position. The trader who forces every stop to be tight is optimizing for size instead of survival, and the market charges a fee for that.
When the honest stop is too wide
And if the honest structural stop is so wide that a 1% position would be a laughably tiny number of shares — that's the market telling you the setup is too loose or too far from a clean level. You have three legitimate responses, in order of preference: (1) Pass — the cleanest choice; a setup without a nearby invalidation isn't an A-setup. (2) Wait for a pullback to a level closer to structure, which tightens the stop and improves the R:R. (3) Drop to a lower timeframe to find a tighter structural stop within the same thesis — but only if the lower-timeframe structure genuinely aligns, not as an excuse to manufacture size. What you never do is keep the wide stop and pump the share count anyway. A good stop location is part of what makes a setup an A-setup.
Scaling In And Out
You don't have to treat a position as one all-or-nothing block. Scaling lets you manage risk dynamically — but it has to serve the risk plan, not sabotage it.
Scaling in — entering in pieces. You take a third at first signal, add a third on confirmation, a third on a pullback. The key rule that keeps people out of trouble: your total risk across all tranches must still respect your 1% (or 2%) cap. Size each piece so the combined stop-out equals your defined R, not so each piece risks the full amount. Adding to a position while keeping the same stop increases your risk — so if you add, you either accept the higher risk consciously (within your cap) or you trail the stop up to keep total risk constant.
Scaling in, worked with numbers
Account $50,000, risk 1% = $500 total. You like a long but want confirmation. You plan three tranches of ~$167 risk each. First third: entry $100, stop $97 ($3 risk/share) → 55 shares, risking $165. Price confirms and pushes to $101; you add the second third with the same $97 stop — but now that tranche risks $4/share, so 41 shares risks $164. Price pulls back to $100.50 and holds; you add the final third, stop still $97, $3.50/share → 47 shares, $164. Total: 143 shares, blended risk ≈ $493 to the $97 stop — right at 1%. Notice you pre-planned the tranche sizes so the combined stop-out equals your R. The amateur version adds a full-size position each time and wakes up risking 3% on one name.
Scaling out — taking profit in pieces. A clean, popular structure with a 1:3 trade: sell a third at +1R, a third at +2R, let the last third run to +3R or beyond with the stop trailed to breakeven. This locks in gains, reduces the emotional urge to bail on the whole thing, and — critically — once you're at breakeven on the runner, that trade can no longer hurt you. You've converted an open risk into a free option on more upside.
The cost of scaling out, honestly stated
Scaling out is not free, and pros are honest about the trade-off. If you scale a third at +1R, a third at +2R, and a third at +3R, your realized average on a winner that reaches full target is +2R — not +3R. Against that, on trades that reverse after +1R, scaling out banks something instead of round-tripping to breakeven or worse. So scaling out lowers your average winner but raises your win consistency and cuts the emotional cost of watching gains evaporate. For most traders — especially anyone whose journal shows they bail on full positions out of fear — that trade is worth it, because the discipline it buys is worth more than the fractional R it costs. For a highly disciplined trend trader who can genuinely let a full position ride to target without flinching, letting it all run captures more of the fat tail. Know which trader you are by reading your own journal, not your self-image.
The deadly version
The deadly version of scaling in is averaging down — adding to a loser to lower your cost basis. This is martingale behavior, and it's how small losses become account-killers. You're throwing more money at a thesis the market is actively rejecting. There's a seductive logic to it — "it's cheaper now, better value" — but a trade going against you is the market's evidence that your read was wrong, and the correct response to disconfirming evidence is to get smaller or out, not bigger. Adding to winners is a strategy; adding to losers is a prayer. Don't pray with your account. The distinction is clean and absolute: you may add to a position that is proving you right and moving to profit; you may never add to a position that is proving you wrong and moving to your stop.
Correlation Risk: Don't Hold Five Versions Of The Same Trade
Here's the trap that ambushes people who think they're managing risk perfectly. You size every position at a disciplined 1%. You've got five positions on. You feel diversified. You believe your total risk is 5%.
It might be 5%. It might be effectively 15%.
Correlation risk is the hidden exposure that comes from holding positions that secretly move together. If you're long NVDA, AMD, MU, SMCI, and long NQ futures, you do not have five independent trades. You have one giant bet on semiconductors and tech beta, expressed five ways. When that theme sells off — and correlated things sell off together, especially in a panic — all five stops get hit at once. Your "five separate 1% risks" fire simultaneously and you're down 5%+ in an afternoon on what is really a single idea gone wrong.
Correlation spikes exactly when it hurts most. In a market-wide flush, correlations across risk assets race toward 1.0 — everything drops together, and your careful per-trade sizing means nothing because the trades weren't actually separate.
How to measure and manage it
- Group by theme, not by ticker. Ask: if my macro thesis is wrong, how many of these die together? Those are one position for risk purposes.
- Cap total risk per theme. However many correlated names you hold, the combined risk should respect a single-trade-style limit (say, no more than 2% at risk across an entire correlated cluster). So if you want to be long four semis, size each at ~0.5% so the cluster risks 2%, not 4×1% = 4%.
- Cap total open risk across the whole book — many pros keep aggregate open risk to ~6% or less, so even a broad bad day is a controlled event.
- Watch inverse correlations too — long tech and short VIX and long a high-beta index is the same directional bet stacked three ways. So is being long six things that all die if yields spike.
- Beware correlation-of-the-day. Correlations aren't fixed. Two names that trade independently for months can lock together the instant a macro theme takes over the tape (a CPI print, a Fed day, a growth scare). During those regimes, treat everything risk-on as one book until the theme releases its grip.
The beta-weighting refinement
For a more precise handle, weight your positions by beta to a common driver — usually the index or the sector ETF. A position in a 2.0-beta name like a leveraged semi carries twice the market-move risk of a 1.0-beta name for the same dollar size. If you're long $20k of a 2.0-beta stock and $20k of a 1.0-beta stock, your effective market exposure is 3.0 "beta-dollars" per $20k unit, not 2.0. Summing beta-weighted exposure across the book tells you your true directional bet on the market. Beginners look at dollar exposure; pros look at beta-weighted exposure, because that's what actually moves when the tide goes out.
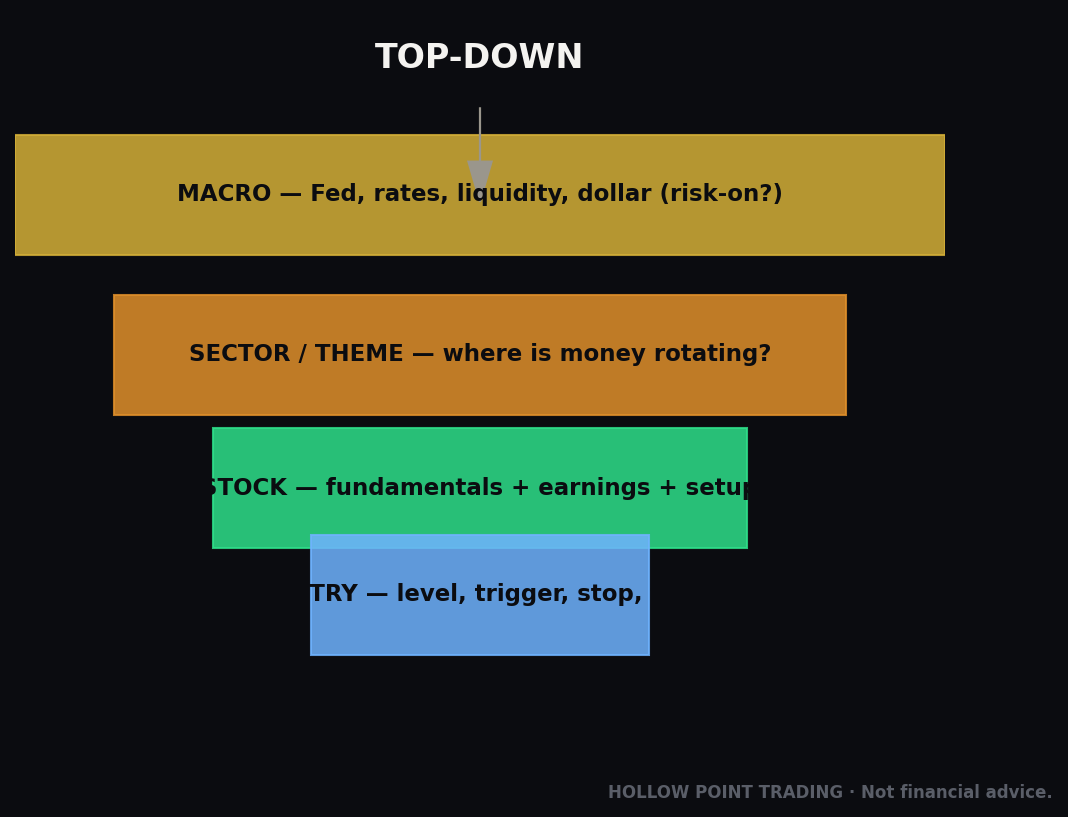
This is the HPT top-down discipline paying off: macro → sector → stock. When you build from the top, you see the theme you're actually expressing, so you don't accidentally place the same bet five times and call it a portfolio.
Risk Across Market Regimes
The rules don't change between regimes — 1:3, structural stops, fixed-fractional sizing are constant — but how you apply them has to adapt to what the market is actually doing. Treating a chop regime like a trend regime is how disciplined traders still bleed.
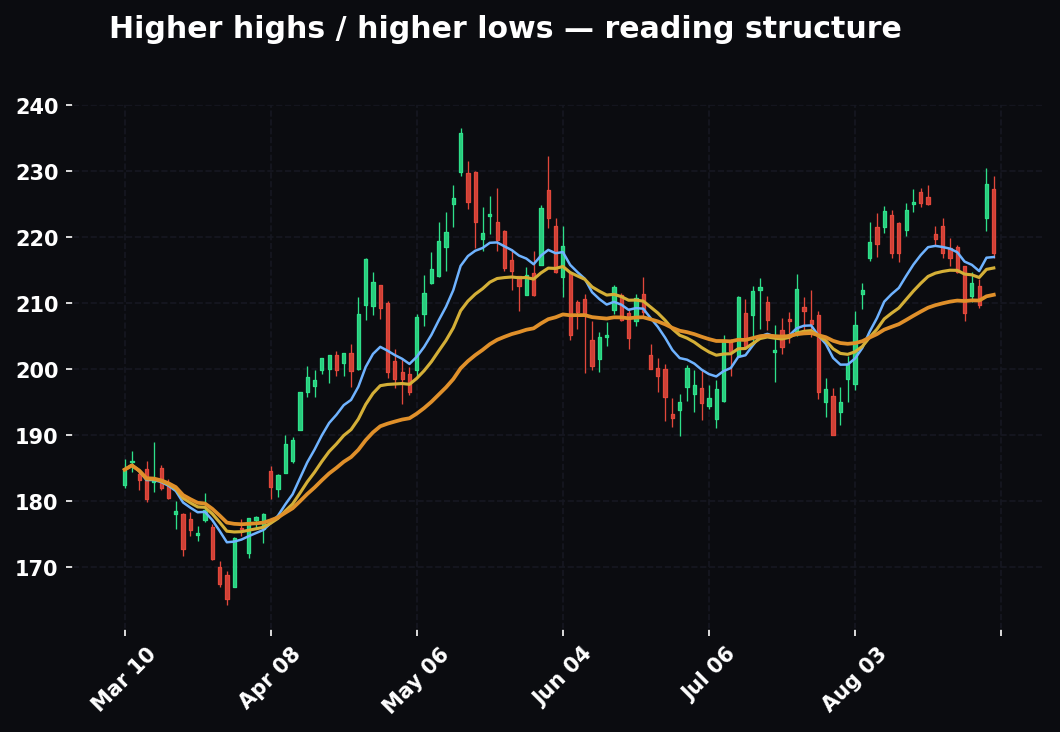
Trending regime
In a clean trend — price stacked above a rising EMA structure, higher highs and higher lows — your setups get easier and your R:R gets better. Pullbacks to structure offer tight stops (just below the higher low) against a target that can run for multiple R because the trend keeps making new highs. This is the regime to press: take the standard 1–2% risk, favor scaling into strength, and let winners run past 3R by trailing rather than capping. The mistake here is under-participating — taking a quick +1.5R when the trend was handing you +6R. In a strong trend, the fat right tail of your R distribution is where the year is made.
Choppy / range-bound regime
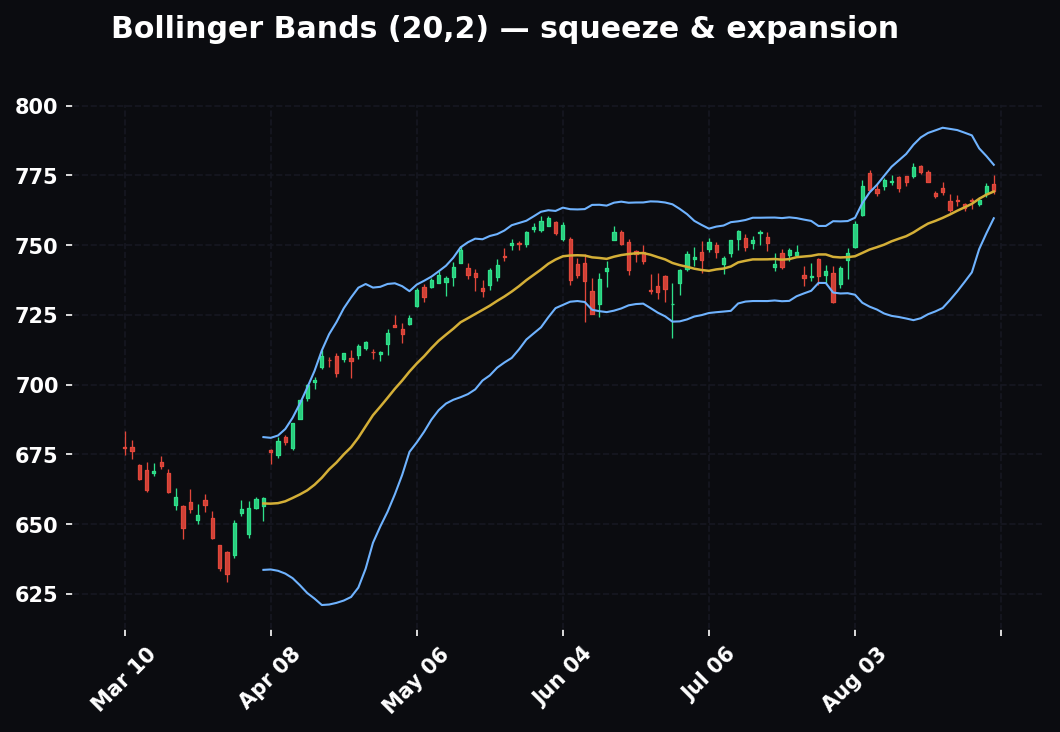
In a range, the trend that carries winners to 3R doesn't exist — price keeps reverting to the middle. Two consequences. First, your realized R:R compresses, because targets get hit less often before price turns back. Second, and more dangerously, breakouts fail — the range chews up trend-followers with a string of small losses (the "death by a thousand cuts" that quietly drains accounts). Adaptations: cut size (risk 0.5% instead of 1% while you confirm the regime), demand cleaner setups at the edges of the range (buy support, sell resistance, rather than chasing the middle), take profits more mechanically since runners rarely run, and — critically — reduce frequency. Chop is when the best trade is often no trade. The account killer in a range isn't one big loss; it's forty small ones from forcing trend setups into a market that has no trend.
High-volatility regime
When volatility explodes — VIX spiking, ATR doubling, gaps everywhere — the ground rules bite hardest. Wider ATR means honest structural stops are wider, which by the formula means smaller positions for the same 1% risk. Beginners do the opposite: they see the big ranges, get excited about the profit potential, and increase size right when they should be cutting it. In high vol you: (1) size down automatically because the stop distance is wider (the formula does this for you if you're honest about the ATR-adjusted stop), (2) widen your slippage pad because fills get ugly, (3) consider halving your normal risk % outright because correlations spike and your positions become more alike, and (4) respect that overnight gap risk is real — a stop can't protect you across a gap, so hold-through-the-close decisions need extra margin or no position. The high-vol regime offers the biggest R opportunities and the biggest ways to die. Smaller size, cleaner setups, tighter book.
Low-volatility / compression regime
The quiet, grinding, low-ATR regime has its own trap: complacency. Stops are tight, everything works, you drift your size up because "nothing moves much anyway." Then volatility mean-reverts — it always does — and the position you sized for a sleepy tape gets caught in the expansion. The discipline in low vol is to keep your fractional risk constant even though the tight stops tempt you into size, and to remember that compression is a coiled spring, not a permanent state. The trader who sizes for the calm gets carried out by the storm that follows it.
Multi-Timeframe Risk
Risk isn't managed on one chart — it's managed across a stack of them, and the timeframes have to agree for the size to be earned.
The bias timeframe sets permission; the entry timeframe sets the stop
The HPT framework runs top-down: a higher timeframe (daily, 4H) establishes bias — are we above or below the EMA 55, making higher highs or lower lows — and a lower timeframe (5m, 15m) provides the entry and the stop. The rule that ties them together for risk: only take full size when the entry-timeframe setup agrees with the higher-timeframe bias. A long on the 5m that lines up with a daily uptrend earns your full 1–2%. A long on the 5m against a daily downtrend is a counter-trend scalp — if you take it at all, it earns reduced size (say half) and a tighter target, because you're fading the dominant flow and your realistic R:R is worse.
How the stop lives on the lower timeframe
The entry timeframe gives you your structural stop, which is usually tighter than a higher-timeframe stop would be — that's the point, it improves your R:R. But you must respect the higher-timeframe invalidation as a hard backstop. Example: daily bias is long above the daily 55-EMA at $240. You enter on the 15m off a $246 pullback with a 15m structural stop at $244.50 (tight, $1.50 risk). Good — but you also know that a daily close below $240 kills the whole thesis. So your 15m stop protects the trade, and the daily level defines the war. If you get stopped on the 15m but the daily is still constructive, that's a losing skirmish, not a lost thesis, and you can re-enter on the next 15m setup. This is why multi-timeframe traders can be "stopped out" repeatedly and still be right — the lower-timeframe stops are cheap probes protecting a higher-timeframe conviction.
Timeframe and hold time must match the R:R
A common self-inflicted wound: taking a 1m scalp entry but holding for a daily-sized target. The stop was sized for a scalp (tiny), so a normal daily wiggle blows through it long before the big target can pay. Your entry timeframe, your stop, your target, and your intended hold time all have to live on the same scale. If you want a multi-day 5R target, you need a higher-timeframe structural stop and a position sized to that wider risk — not a scalp stop stretched across a swing hold. Mismatched timeframes are how traders get "stopped out at the low, right before it ran" — they were holding a swing thesis on a scalp's stop.
How Risk Combines With Your Other Tools
Risk management isn't a silo — it's the layer that turns your read into a sized decision. Here's how it interlocks with three core HPT tools.
Confluence with the EMA 12/22/55 stack
The EMA stack does two jobs for risk. First, it defines bias (price above a rising 55 = long permission), which gates your size as described above. Second, it provides dynamic structure for stops. When price is trending and riding the 22-EMA, that moving average is acting as support — so a stop just below the 22 (with an ATR buffer) is a legitimate structural stop that trails automatically as the average rises. As the trend carries and the EMAs climb, your trailing stop climbs with them, converting open risk into locked gains without you guessing at levels. The stack literally draws your trailing stop for you. The confluence rule: the tightest valid structure wins — if a horizontal shelf sits above the 22-EMA, use the shelf; if the EMA is the nearest defended level, use the EMA.
Confluence with the golden pocket (0.618–0.65 Fib)
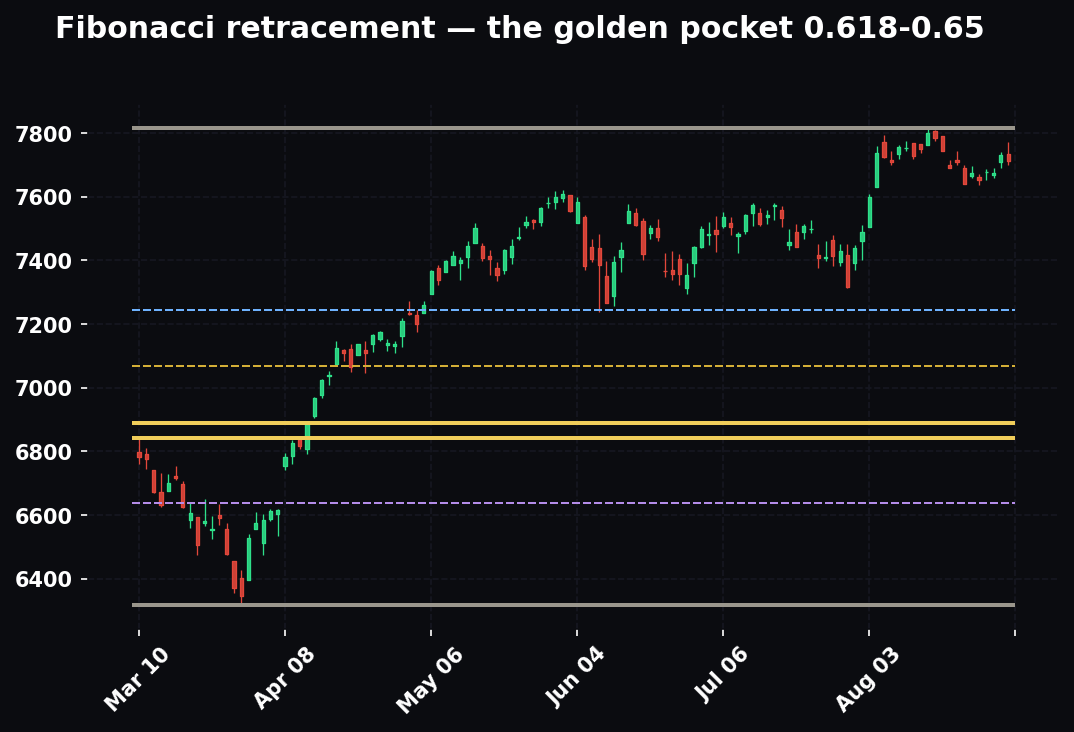
The golden pocket is one of the highest-value stop-placement gifts on the chart, because it gives you a precise invalidation. When price pulls back into the 0.618–0.65 retracement of an impulse leg and shows a reversal, your thesis is "the pocket holds and the trend resumes." That thesis is proven wrong at a clean, specific price: below the pocket (a break of the 0.65, or the 0.786 as a deeper backstop). So the pocket setup hands you a tight structural stop just beyond it, a defined target (prior high or a measured extension for 3R+), and therefore a clean position size. This is a textbook A-setup precisely because the risk is so well-defined: entry in the pocket, stop below it, target at the extension. When the golden pocket lines up with the EMA 55 and a prior support shelf at the same price, you have three tools naming the same stop — that confluence is what justifies pressing size to the top of your range.
Confluence with volume / VWAP and options walls (GEX)
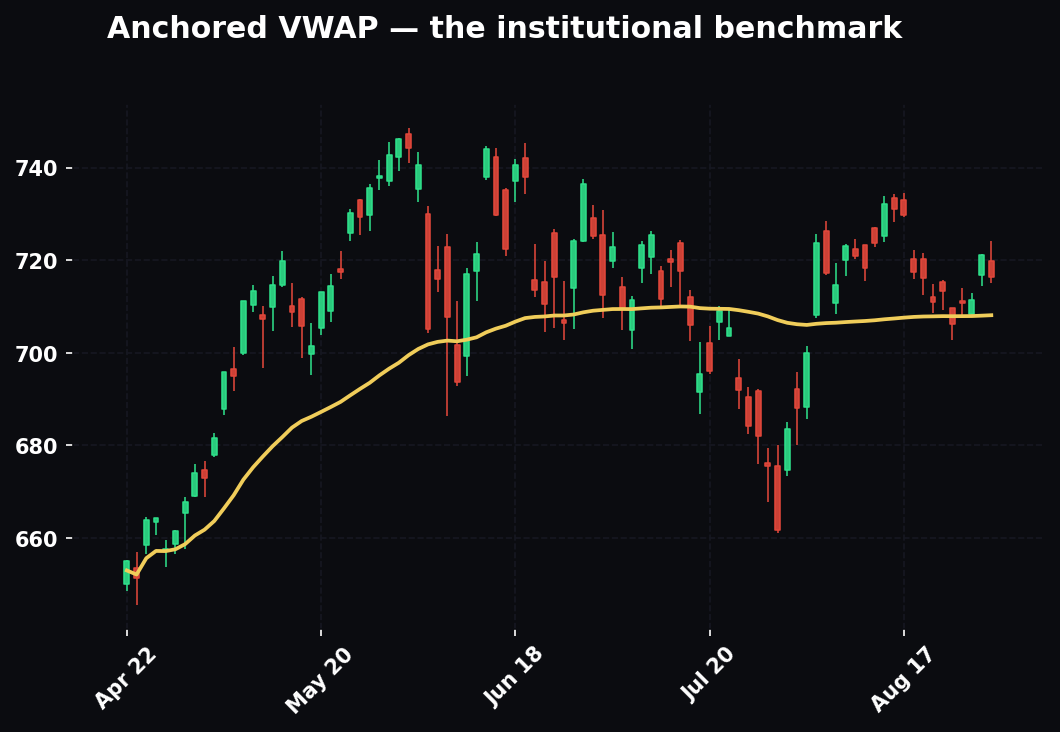
Volume structure and options positioning refine targets and stops together. Anchored VWAP and high-volume nodes (POC) act as magnets and as defended levels — a stop tucked beyond a POC is protected by the same participants who defended it. On the target side, options walls matter enormously for R:R: a big call wall overhead is a level price tends to pin under, which caps your realistic target. If your 3R target sits above a massive call wall, your honest target is the wall, and if the wall only offers 1.8R, the trade fails the 1:3 test — pass. Conversely, a gamma flip level or a put wall below can define where support should appear, tightening a long's stop logic. The confluence discipline: never draw a 3R target through a wall the tape is likely to respect. The options structure tells you where the room actually ends, and R:R is measured to real room, not hoped-for room.
Common Mistakes That Quietly Kill Accounts
Most accounts don't die from one dramatic blowup. They die from a repeated small error that compounds. Here are the ones that do the most damage, each with the fix.
1. Sizing before placing the stop. Picking a share count first and reverse-engineering the stop to fit. This inverts the entire mechanism and guarantees your risk is arbitrary. Fix: stop first (structure), size second (formula). Always.
2. Moving the stop away from price. The single most expensive habit in trading. You "give it room," the room becomes a canyon, and −1R becomes −4R. Every stop-widening is a decision to lose more money to avoid admitting you were wrong. Fix: the stop only ever moves in the direction of the trade (to lock gains), never away. Make it a hard order so the emotional you can't touch it.
3. Risking a fixed share count instead of a fixed fraction. "I always trade 100 shares" makes your dollar risk swing 5x between a tight-stop and wide-stop trade without you noticing. Fix: fixed-fractional sizing, recomputed off equity on a schedule.
4. Confusing position cost with position risk. Panicking at a $41,000 position when the actual risk is $2,000 (Example 3), or feeling safe in a $5,000 position with a stop so wide it risks $2,500. Fix: the only number that matters is dollars-to-stop. Cost is a financing question, not a risk question.
5. Averaging down. Adding to losers to lower the basis. Martingale in a costume. It feels like conviction; it's actually refusing to process disconfirming evidence. Fix: add only to winners, never to losers. A trade going against you is a reason to get smaller, not bigger.
6. Ignoring correlation. Five 1% positions in the same theme is one 5% bet that all fires at once in a flush. Fix: group by theme, cap cluster risk, watch beta-weighted exposure.
7. Over-trading in chop. Forcing trend setups into a rangebound tape and dying by a thousand −1R cuts. The losses are each small, so they don't alarm you, and that's exactly why they accumulate to a real drawdown. Fix: recognize the regime, cut frequency, demand cleaner setups, accept that no-trade is a position.
8. Revenge trading after a loss. Taking an immediate, oversized, un-planned trade to "make it back." This is the −1R that becomes the −6R because it was never a setup — it was an emotional reaction. Fix: a hard rule that after a loss (or two in a row), you wait a fixed cooldown before the next entry, and the next entry must be a pre-planned setup at full quality.
9. Widening risk after a winning streak. Overconfidence bloats size right before variance mean-reverts and the streak ends. The bigger size turns a normal cold patch into a real dent. Fix: fixed-fractional sizing keeps you honest; don't override it because you "feel hot." Feeling hot is not an edge.
10. Under-sizing after a losing streak (or freezing entirely). The opposite failure — you get gun-shy, cut size to nothing or stop trading, and then miss the winners that would have recovered the drawdown. Fix: trust the fixed fraction; it already shrinks your dollar risk automatically as the account shrinks. You don't need to additionally flinch. Take the A-setups at your rules.
11. Not accounting for slippage and gaps. Sizing to the optimistic fill and discovering on the bad morning that your 1% was really 2.5%. Fix: pad the stop estimate, size smaller than the clean formula, and don't hold through known gap-risk events without extra margin.
12. Setting arbitrary percentage stops. "I'll use a 3% stop on everything" ignores that structure lives at different distances on different charts. Sometimes 3% is inside the noise (instant stop-out); sometimes it's miles past invalidation (wasted risk). Fix: stops live at structure, distance varies by chart, and the dollar risk is what you hold constant — not the percentage move.
13. No maximum daily / weekly loss limit. Letting a bad day run unbounded because each individual trade was "within the rules." Three −1R trades plus a revenge trade is a −5R day that didn't have to happen. Fix: a hard daily stop (e.g., −3R and you're done for the day) and a weekly stop. The rule that ends the bleeding is the one that protects tomorrow's clear head.
How The Pros Use This Differently From Beginners
The formulas are the same for everyone. What changes with skill is the relationship to them.
Beginners hunt entries; pros hunt asymmetry. The beginner scrolls charts looking for a reason to be in a trade. The pro scans for the rare setup where a tight structural stop sits under a target with 3R+ of clean room, and passes on everything else without a flicker of FOMO. The pro is comfortable being flat. Most of the beginner's losses come from trades that were never worth taking.
Beginners see the stop as a threat; pros see it as the price of information. To the beginner, getting stopped feels like failure, so they sabotage the stop. To the pro, −1R is a budgeted business cost, indistinguishable emotionally from a shop paying rent. This single reframe is most of the gap between the two.
Beginners obsess over the current trade; pros think in samples. The beginner's whole emotional world rides on this one position. The pro knows no single trade matters — the edge shows up over hundreds — so they can take a loss cleanly, because it's one data point in a distribution they trust. They protect the process, and let the sample deliver the results.
Beginners size by feeling; pros size by formula. The beginner sizes up when confident and down when scared — which means biggest when euphoric (top-ticking) and smallest when fearful (bottom-ticking), exactly backwards. The pro's size comes from an equation that doesn't have feelings, so conviction never bloats risk. When a pro wants to express more conviction, they do it by taking the setup at all and letting the fixed fraction ride, not by breaking the sizing rule.
Beginners manage trades; pros manage books. The beginner looks at one position at a time. The pro sees the whole book — total open risk, theme concentration, beta-weighted exposure — and knows that five great individual trades can be one terrible portfolio. Their risk decisions happen at the book level, not just the ticket level.
Beginners want to be right; pros want to be paid. The beginner needs the market to validate their read and will hold a loser to be proven correct eventually. The pro is indifferent to being right — they'll take a loss on a "correct" thesis that isn't working yet and re-enter later without ego, because the P&L, not the pride, is the scoreboard.
Beginners have rules; pros have systems that enforce the rules.*** The beginner "tries" to honor stops and sizing through willpower, which fails under pressure. The pro removes willpower from the loop: hard resting stops set at entry, position size computed before the click, a daily loss limit that locks the platform, a journal that makes every deviation visible. They engineer an environment where the disciplined action is the default and the reckless action takes effort. Discipline isn't a personality trait they have and you don't — it's an architecture they built.
FAQ
Q: Isn't risking only 1% too slow to ever grow a small account? It feels slow, but it's the only path that survives long enough to compound. At +0.6R expectancy and even a modest trade frequency, 1% risk compounds meaningfully over a year while keeping you alive through the cold streaks that wipe out the "risk 10% to grow fast" crowd. The people who grow small accounts fast and keep it are rare; the people who grow them fast and blow up are the overwhelming majority. If your account is genuinely too small to make 1% meaningful in dollars, the answer is more capital or a prop/futures path — not more risk per trade.
Q: What if I can't find any 1:3 setups? Then you don't trade. "No 3R of room, no trade" is a feature, not a bug. A day, or several, with no qualifying setup is normal and correct. The account is not a slot machine that owes you action. Forcing sub-1:3 trades to feel busy is how a winning system gets executed into a losing one.
Q: Should the target be exactly 3R or can I aim higher? 1:3 is the floor, not the ceiling. In a strong trend, cap nothing — take partials and trail the runner for 5R, 8R, whatever the trend gives. The 1:3 rule filters out the trades that don't offer enough room; it never caps the ones that offer more.
Q: What about commissions and fees — do they change the math? Yes, at the margin, and more so for high-frequency scalping. Costs come straight off your expectancy. A 1:1 scalper with thin edge can be turned net-negative by fees alone, which is another argument for higher-R, lower-frequency trading where a few cents of cost is trivial against a multi-R target. Always compute expectancy after costs.
Q: How do I set a stop on something that gaps, like a stock over earnings? You largely can't — a stop can't protect you across a gap, because the price you wanted to exit at simply doesn't trade. The honest answer is either don't hold through the gap event, or size dramatically smaller (treat the whole position as your risk, because the gap could be enormous) and accept you're now in a different, higher-variance game. Never assume your stop will save you across a scheduled catalyst.
Q: Can I ever risk more than 2% on a truly A+ setup? Pros occasionally flex to 2–3% on their highest-conviction, best-defined setups — but only after they've proven an edge over a large sample, and never as a habit. If you're still learning, the answer is no. The temptation to make an exception "just this once" for a can't-miss setup is exactly the psychology that blows up accounts, because the can't-miss setups miss at the same rate as everything else in the moments that hurt most.
Q: My win rate is high — like 65%. Do I still need 1:3? If you genuinely sustain 65% over hundreds of trades, you can be profitable at lower R:R (at 1:1, 65% is very profitable). But two cautions: high win rates are usually inflated by cutting winners early and holding losers, which reverts brutally; and a high-win, low-R profile has a fat left tail — one abnormal big loser eats many small wins. Even high-win-rate traders benefit from a reward floor, because it protects against the day the accuracy temporarily vanishes.
Q: Where do I keep my daily loss limit? A common structure is −3R for the day (three full stop-outs, or the equivalent, and you're done) and a weekly limit around −6R to −8R. The exact number matters less than having one and honoring it. Its job is to stop a bad day from becoming a bad month by removing you from the screen before the emotional spiral produces the revenge trade.
The Cheat-Sheet
Print this. Tape it to the monitor.
The formulas
- Position size = (Account × Risk %) ÷ (Entry − Stop)
- R = your dollar risk if stopped (−1R)
- Expectancy = (Win% × Avg Win) − (Loss% × Avg Loss)
- Gain to recover a loss = Loss ÷ (1 − Loss)
- Break-even win rate = 1 ÷ (1 + Reward:Risk) → 25% at 1:3
Break-even win rates by R:R
- 1:1 → 50% · 1:2 → 33% · 1:3 → 25% · 1:4 → 20% · 1:5 → 16.7%
Recovery math (memorize the cliff)
- −10% needs +11% · −20% needs +25% · −50% needs +100% · −80% needs +400%
The rules
- Risk 1–2% per trade. Prove your edge at 1% or less.
- 1:3 R/R minimum. No 3R of clean room to the next wall, no trade.
- Stop goes at structure (invalidation) + an ATR buffer, then size to it — never the reverse.
- Set the stop as a hard resting order at entry. Mental stops evaporate.
- The stop moves only toward the trade (to lock gains), never away.
- Scale out to bank and de-risk; add only to winners, never losers.
- Group correlated names as one bet; cap cluster risk (~2%) and total open risk (~6%).
- Match timeframe, stop, target, and hold time — don't hold a swing on a scalp's stop.
- Trade full size only when the entry setup agrees with the higher-timeframe bias.
- Cut size in chop and high vol. Regime dictates aggression.
- Hard daily loss limit (~−3R) and weekly limit. Walk when hit.
- Losses live at −1R. Always. The refused stop is the account-killer.
The order of operations, every single trade
- Account × risk % = dollar risk (your R)
- Entry and structural stop (+ ATR buffer) → stop distance
- Is the target ≥ 3× the stop distance, to real room (below the wall)? If no, pass.
- Does this correlate with what I already hold? If yes, size to the cluster cap.
- Does the entry agree with higher-timeframe bias? If no, half size or pass.
- Dollar risk ÷ stop distance = position size (pad for slippage)
- Enter, set hard stop, walk away from the mouse
- Manage to plan; scale out or trail; log the result in R
The mental model Entries are where amateurs spend their attention. Risk is where professionals spend theirs. Be wrong 60% of the time and still get rich — but only if every loss is small, every winner is bigger, and you're never holding five copies of the same bet when the floor drops out. Your stop is not a failure; it's the price of information, budgeted in advance. Your edge doesn't live in any single trade — it lives in the sample, and your only job is to protect the process long enough for the sample to pay you.
Master this and you don't have to predict the market. You just have to survive it long enough for your edge to pay you.
The Psychology Of Taking The Loss
You can know every formula in this guide and still blow up, because the hardest part isn't the math — it's clicking the button that turns a paper loss into a real one.
Taking a −1R loss is admitting you were wrong, and the human brain hates that so much it invented a whole menu of ways to avoid it: moving the stop "just a little" to give it room, canceling the stop entirely and "watching it closely," averaging down to lower the basis, telling yourself it'll come back. Every one of these swaps a small, planned, survivable loss for an unbounded, unplanned, account-threatening one. The −1R you refuse to take is how −1R becomes −8R.
The reframe that fixes it: your stop loss is not a failure — it's the price of information. You paid 1R to find out this trade wasn't working. That's the cost of doing business, budgeted in advance, no different than a shop paying rent. A trader who takes 1R losses cleanly has an edge over the market itself, because they've removed the one behavior that kills accounts.
Why the brain fights the stop
It helps to know your enemy. Two well-documented biases do most of the damage. Loss aversion means a loss hurts roughly twice as much as an equivalent gain feels good — so the brain will take irrational risks to avoid realizing a loss, which is exactly the impulse behind moving stops and averaging down. The disposition effect is the measured tendency to sell winners too early (to lock in the good feeling) and hold losers too long (to avoid the bad one) — the precise opposite of "cut losers, ride winners." You are not weak-willed; you are running default human wiring that happens to be catastrophic for trading. The fix isn't to feel differently — you can't argue yourself out of loss aversion in the moment. The fix is to remove the decision from the moment by pre-committing with hard orders when you're calm.
The habits that make discipline automatic
- Set the stop as a hard order the moment you enter. Not a mental stop — a resting order. Mental stops evaporate under pressure. Decide when you're calm and objective (before entry), so the emotional you doesn't get a vote. This is the single highest-leverage habit in trading.
- Think in R, journal in R. When a loss is "−1R, logged," it's a data point in a large sample, not a personal indictment. You expect losers — a 40%-win, +0.6R-expectancy system needs its losers to exist. Each one is part of the plan working.
- Zoom out to the sample. No single trade matters. Your edge shows up over hundreds of trades. The individual −1R is noise; the process is signal. Protect the process by honoring the stop, and the sample takes care of itself.
- Use a hard daily loss limit as a circuit breaker. After −3R on the day, you're done — platform closed, not negotiable. This exists because the most dangerous moment is right after a painful loss, when the desire to "make it back now" overrides every rule. The limit removes you from the screen before the spiral starts.
- Institute a cooldown after any loss. A fixed pause — even five minutes away from the desk — before the next entry, and the next entry must be a pre-planned A-setup. This breaks the reflex that turns one loss into a revenge trade.
The trader who survives
The trader who survives isn't the one who's right most often. It's the one who takes the loss without flinching, keeps every loser at −1R, and is still sitting in the chair — capital intact, discipline intact — when the next A+ setup shows up. Everything in this guide, every formula and table and rule, exists to serve that one outcome: keep the operator solvent and clear-headed, trade after trade after trade, until the edge does what edges do. That's the whole job.
Bound by rules, feared by trade.